In September 2026 Antarctic sea ice peaked at its third-lowest winter maximum in the satellite record, while Arctic ice reached a minimum tied for tenth-lowest. This film explains how sea ice works: why salt water freezes at minus 1.8 degrees, how slush becomes pancakes and then floes metres thick, how freezing squeezes out salt and helps feed deep ocean circulation, why the two poles behave so differently, how a white surface reflects sunlight and a dark one absorbs it, how satellites measure the ice through clouds, and why melting sea ice does not raise sea level. Freeze the sea, watch brine sink, switch between the poles, and melt the mirror.
Interactive 3D film9 min1978 to 2050Published 18 October 2026
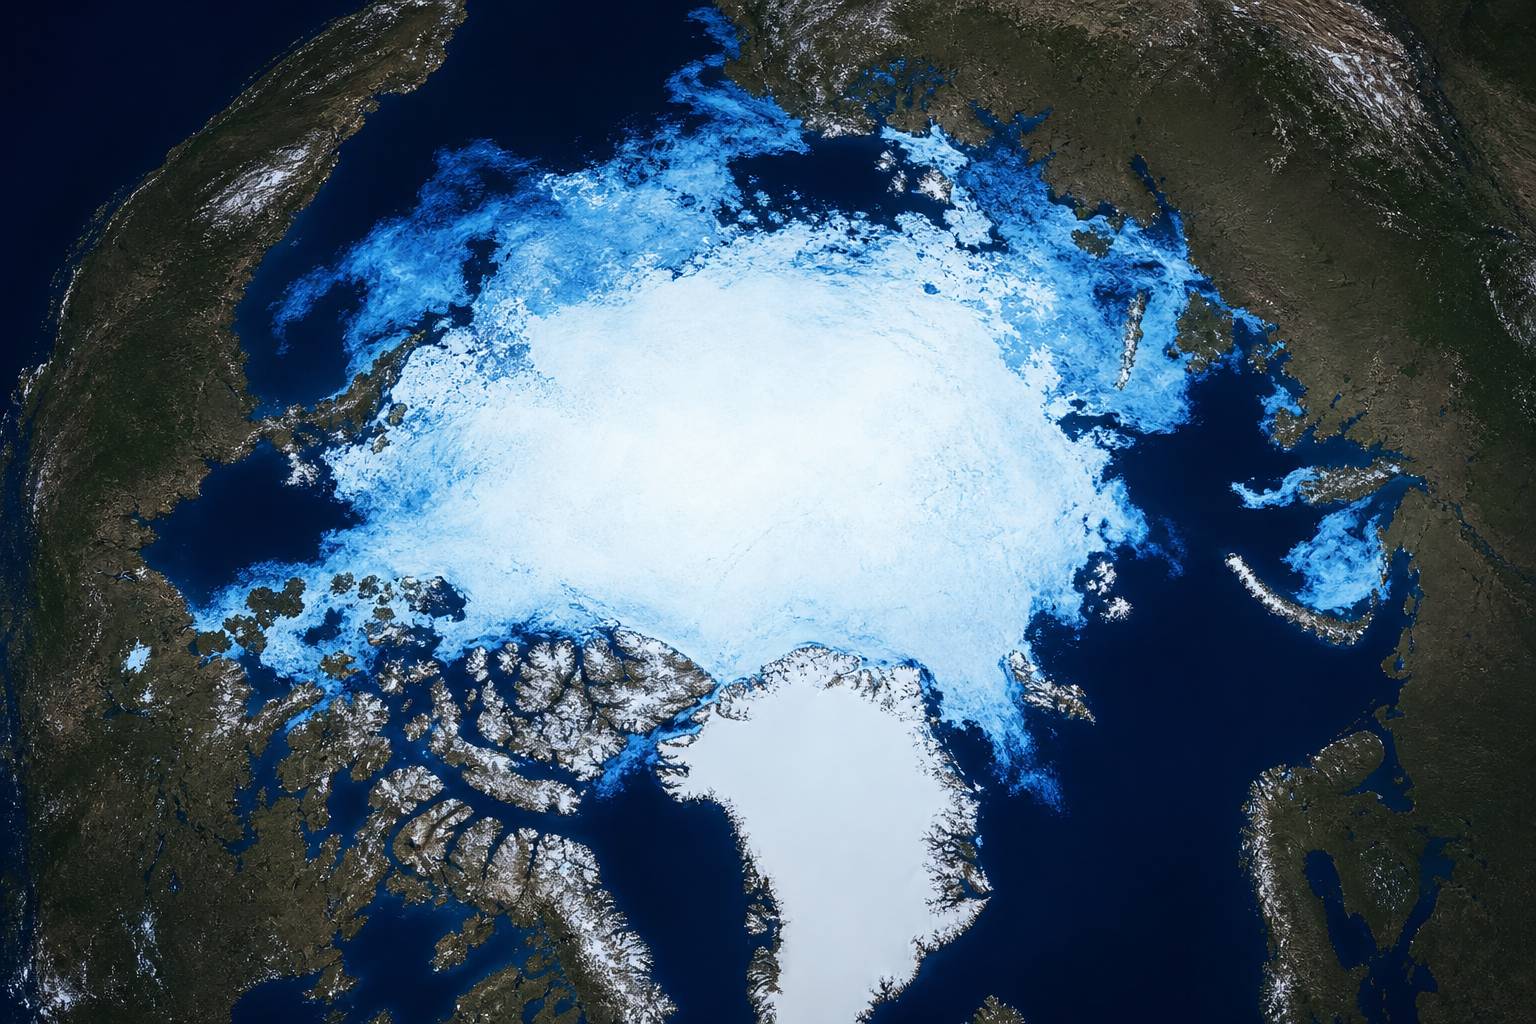
Every year, the ocean around Antarctica freezes into a white skirt larger than the continent itself. On the fourteenth of September 2026 it probably reached its widest: about seventeen point six million square kilometres.
NASA and the National Snow and Ice Data Center reported that this was the third-lowest winter peak in the satellite record. At the other pole, Arctic ice shrank to a summer low tied for tenth-lowest.
What is this frozen lid on the sea? And why did Antarctic ice, which grew a little for decades, suddenly start to shrink?
17.59 M km²
likely reached 14 September
3rd lowest
winter maximum on record
Antarctic winter peak, 2026
4.60 M km²
12 September
=10th lowest
with 2008, 2010 and 2025
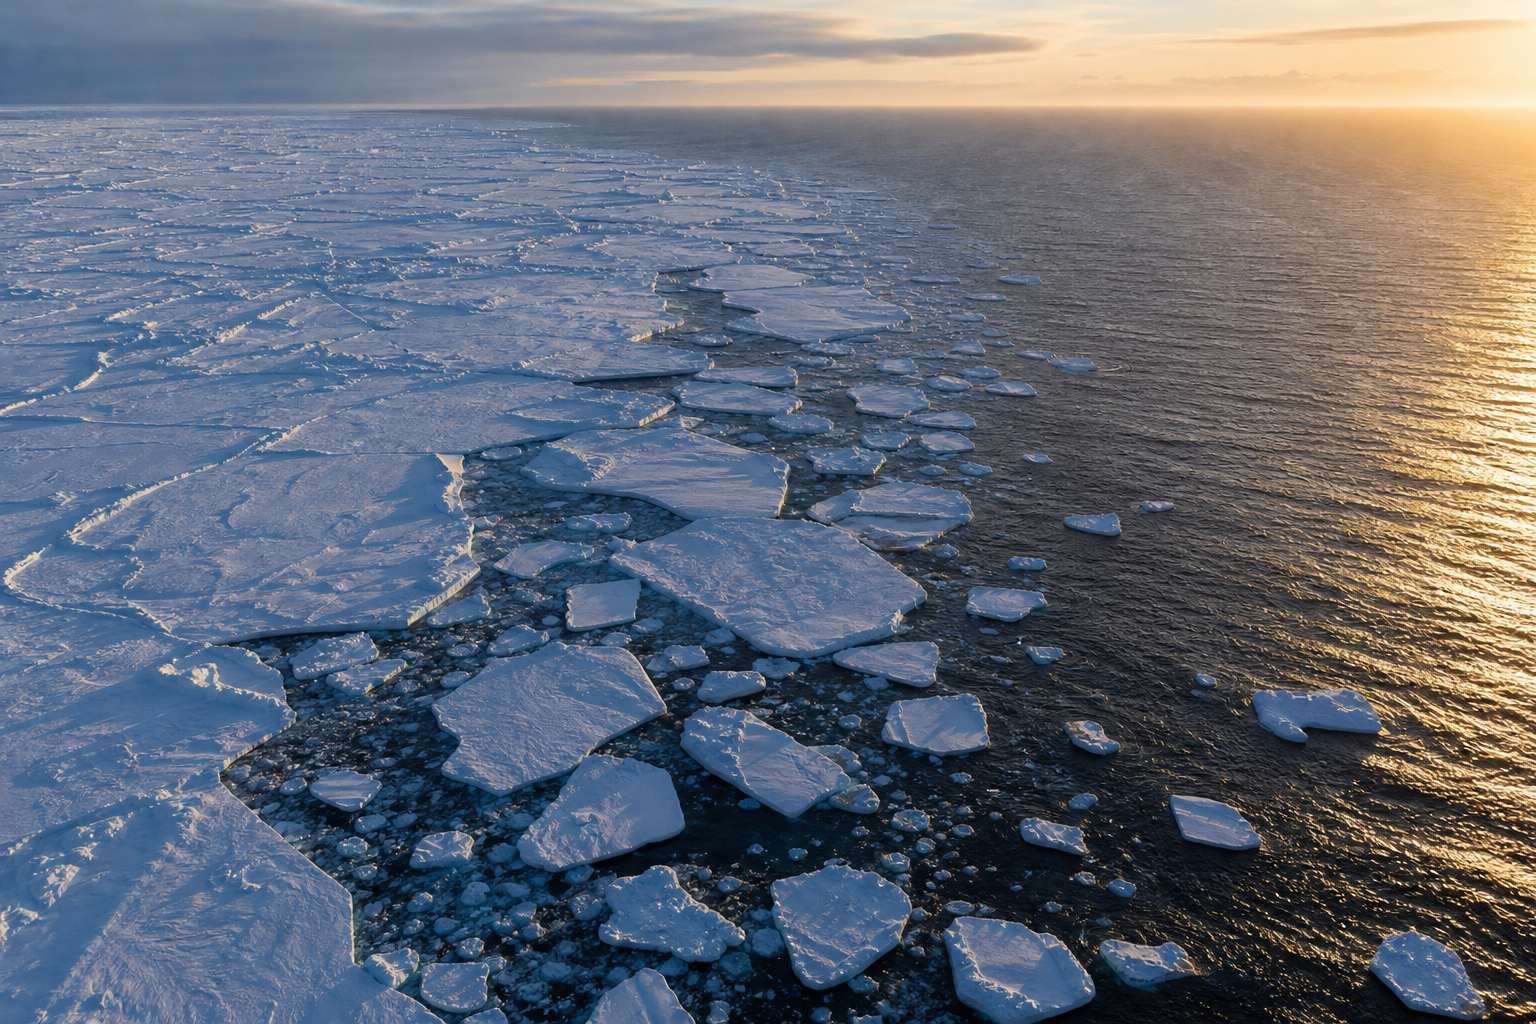
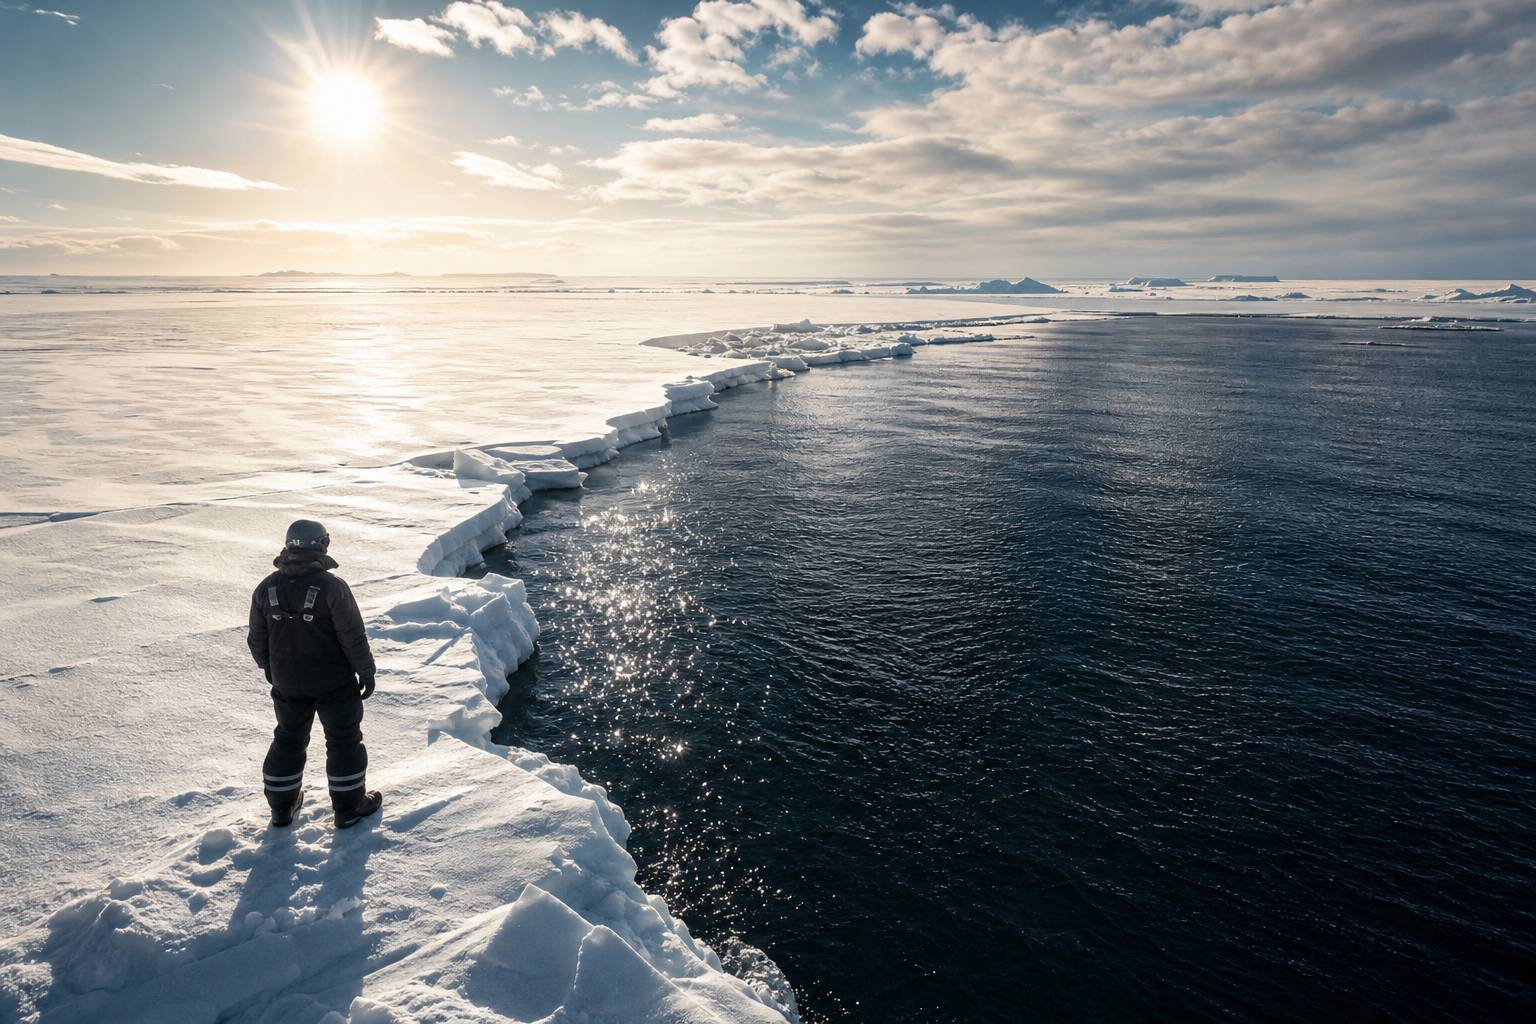
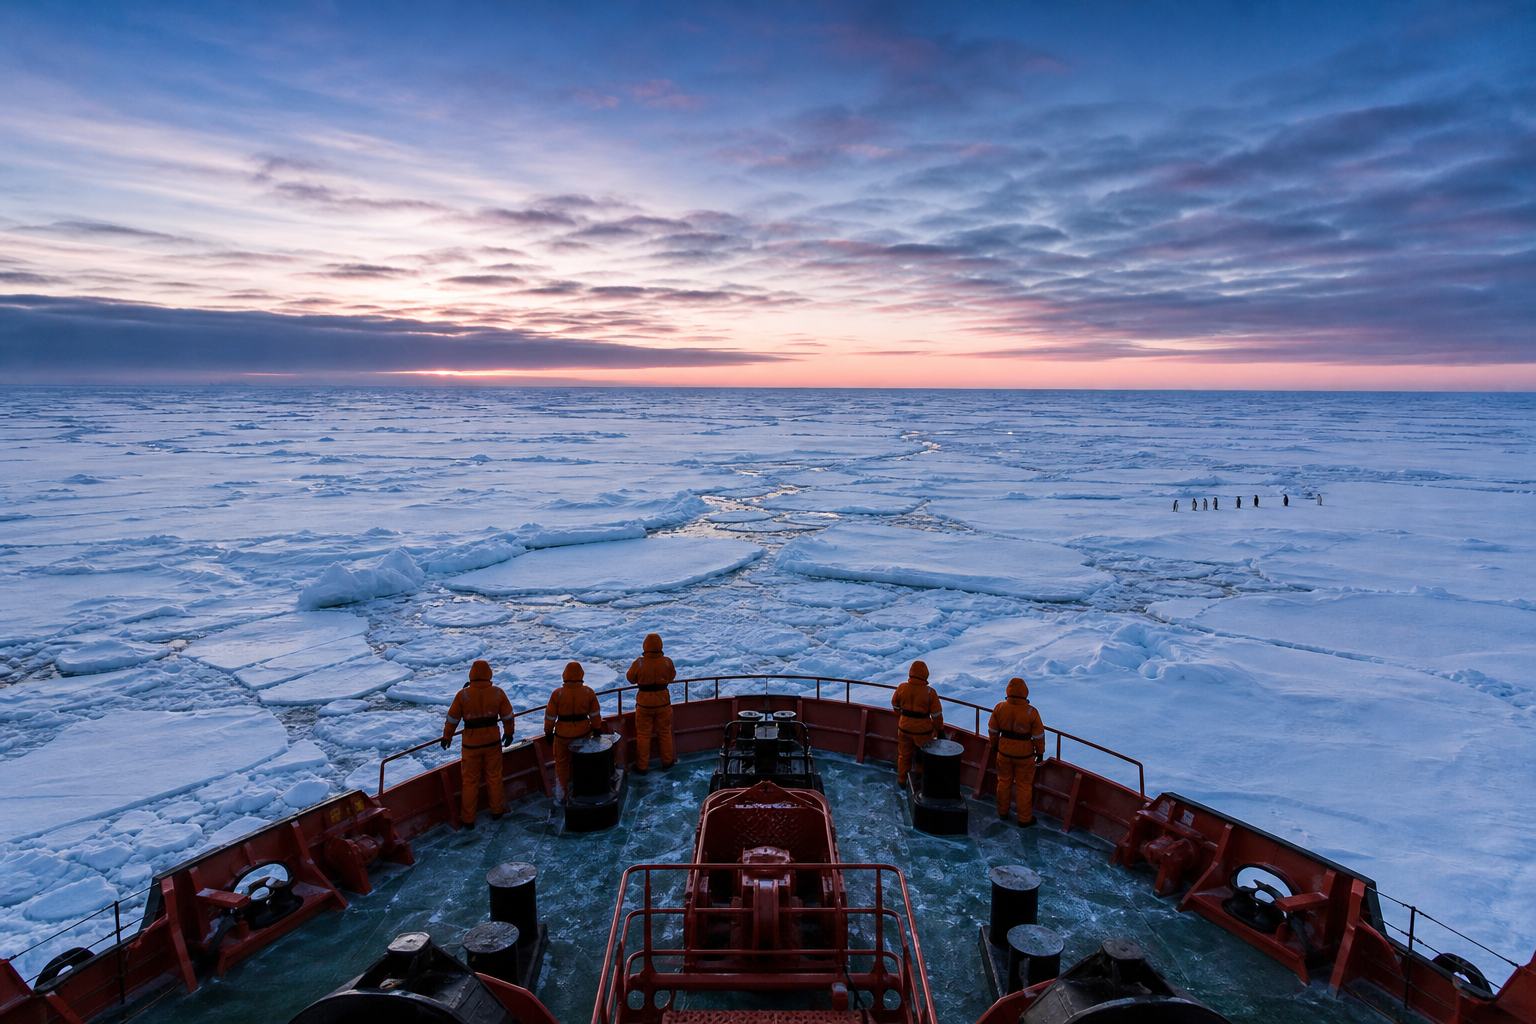
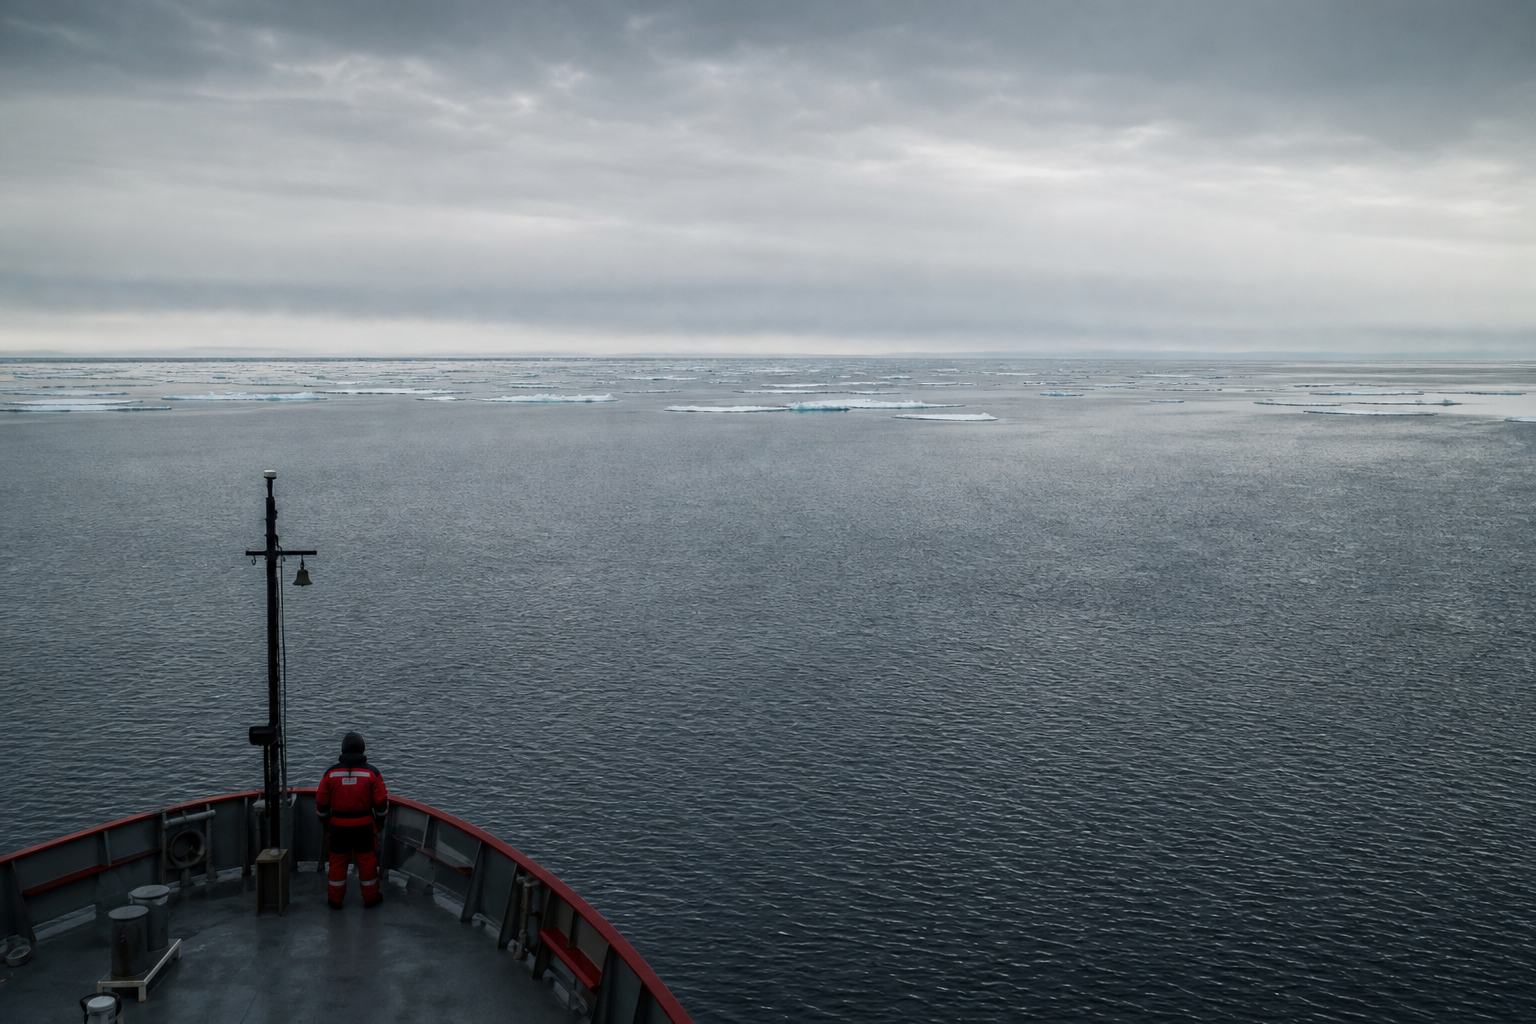
Arctic summer low, 2026The ice edge At its edge the pack thins into scattered floes; the Antarctic continent itself covers about 14 million km². AI-generated still.
Prologue · The news
Both poles, September 2026
NSIDC: Antarctic sea ice most likely reached its maximum of 17.59 million km² on 14 September 2026, the third-lowest maximum on record. Arctic sea ice reached 4.60 million km² on 12 September, tied for tenth-lowest in the nearly 48-year satellite record with 2008, 2010 and 2025. NASA Earth Observatory reported the Antarctic figure on 15 October.
Both figures were preliminary when announced. How to use: pick a chapter or press ← →; drag to rotate. Most steps have buttons.
The 3D scenes are schematic: ice extents on the globe are drawn as simple caps, not satellite maps.
Sea ice is not an iceberg and not a glacier. It is the sea itself, frozen: salt water that has turned solid and floats on the ocean surface.
Fresh water freezes at zero degrees Celsius. Dissolved salt gets in the way of the water molecules locking together, so ordinary seawater must cool to about minus one point eight degrees before it freezes.
Press Cool the sea and watch the first crystals appear at the surface, where the water loses heat to the freezing air.
sea ice: frozen seawater, floating
ice shelves: floating extensions of land ice
icebergs: calved from glaciers or ice shelves; fresh water
Three kinds of polar ice
fresh water
0 °C
seawater (35 parts per thousand salt)
≈ −1.8 °C
Freezing point
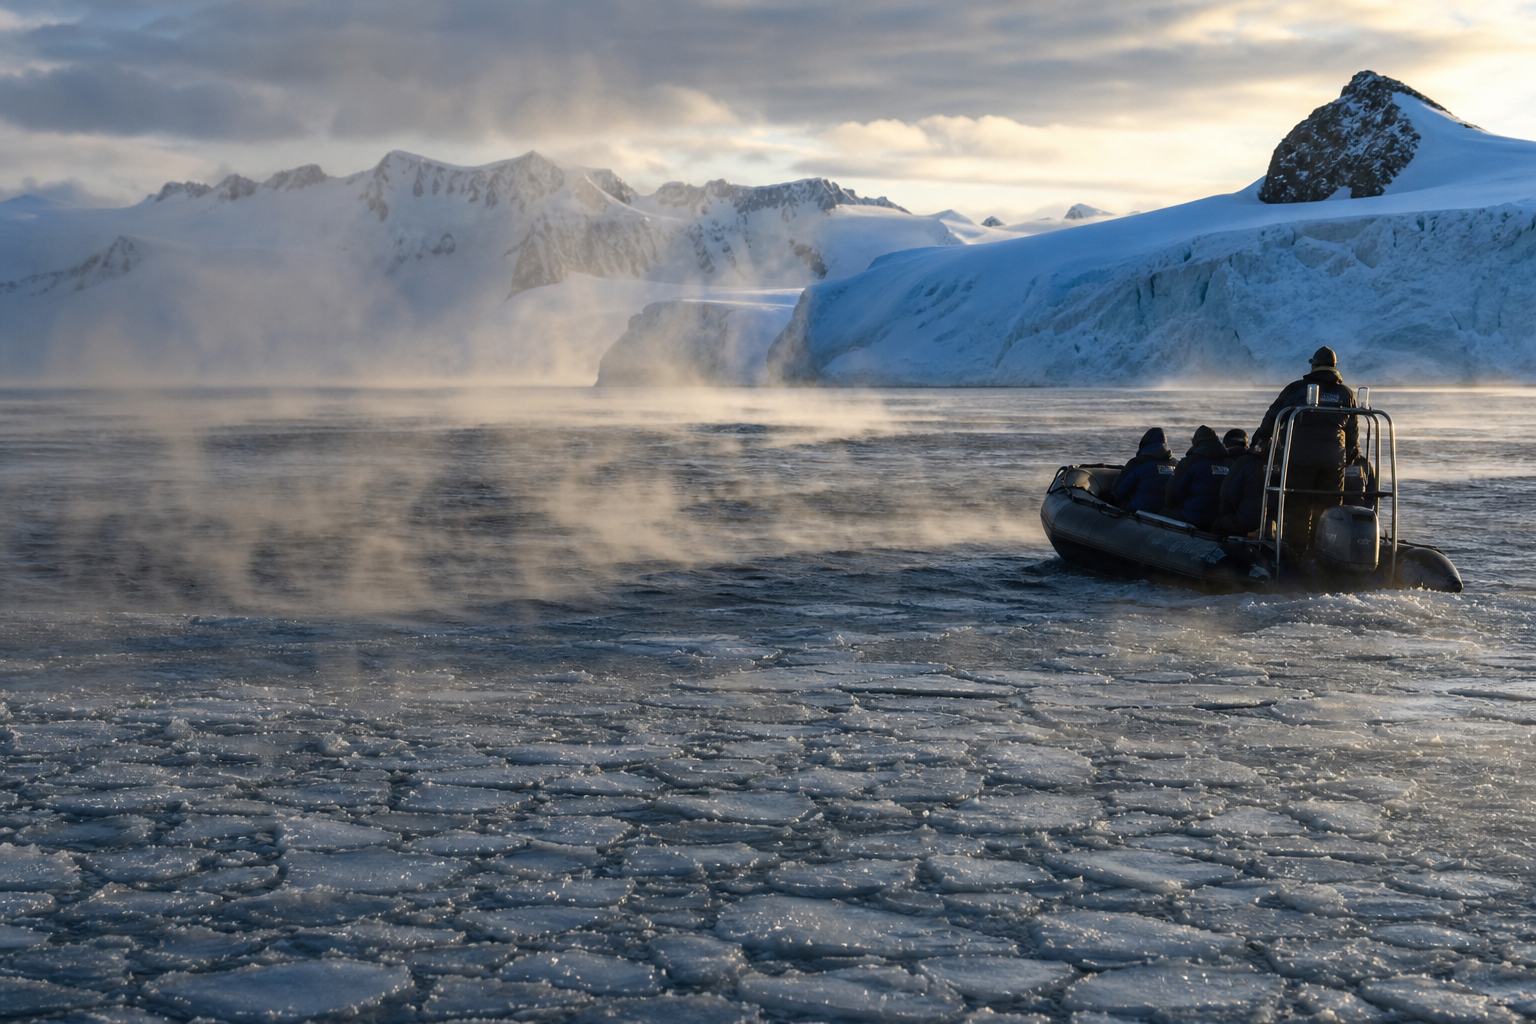
First ice Ice starts at the surface, where the sea loses heat to the frigid air. AI-generated still.
Chapter I · Freezing the sea
Freezing seawater
Met Office: sea ice is frozen seawater which floats on the surface of the ocean. Salt lowers the freezing point; seawater with a salinity of 35 parts per thousand freezes at around −1.8 °C.
AntarcticGlaciers.org: icebergs calve off tidewater glaciers or ice shelves and deliver cold, fresh water to the ocean; an ice shelf is a floating extension of land ice. In the scene, the temperature readout is illustrative.
Freezing starts with tiny crystals called frazil. In calm water they freeze into a thin, flexible sheet called nilas. In rough water they thicken into a soupy slush known as grease ice.
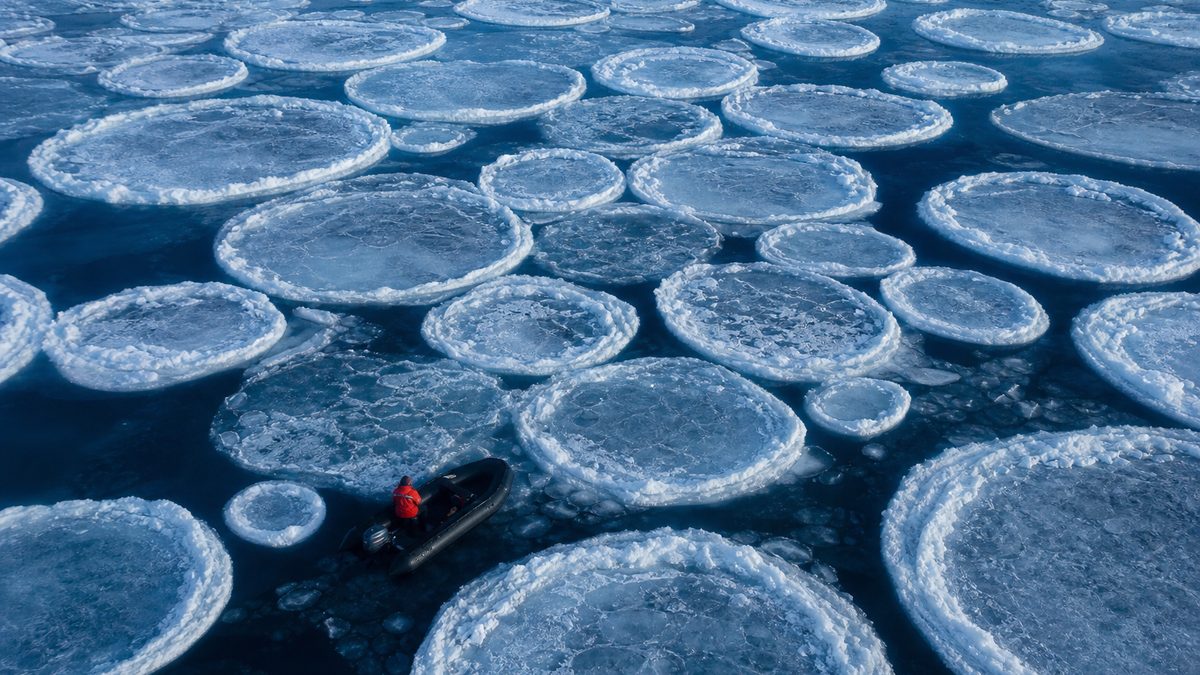
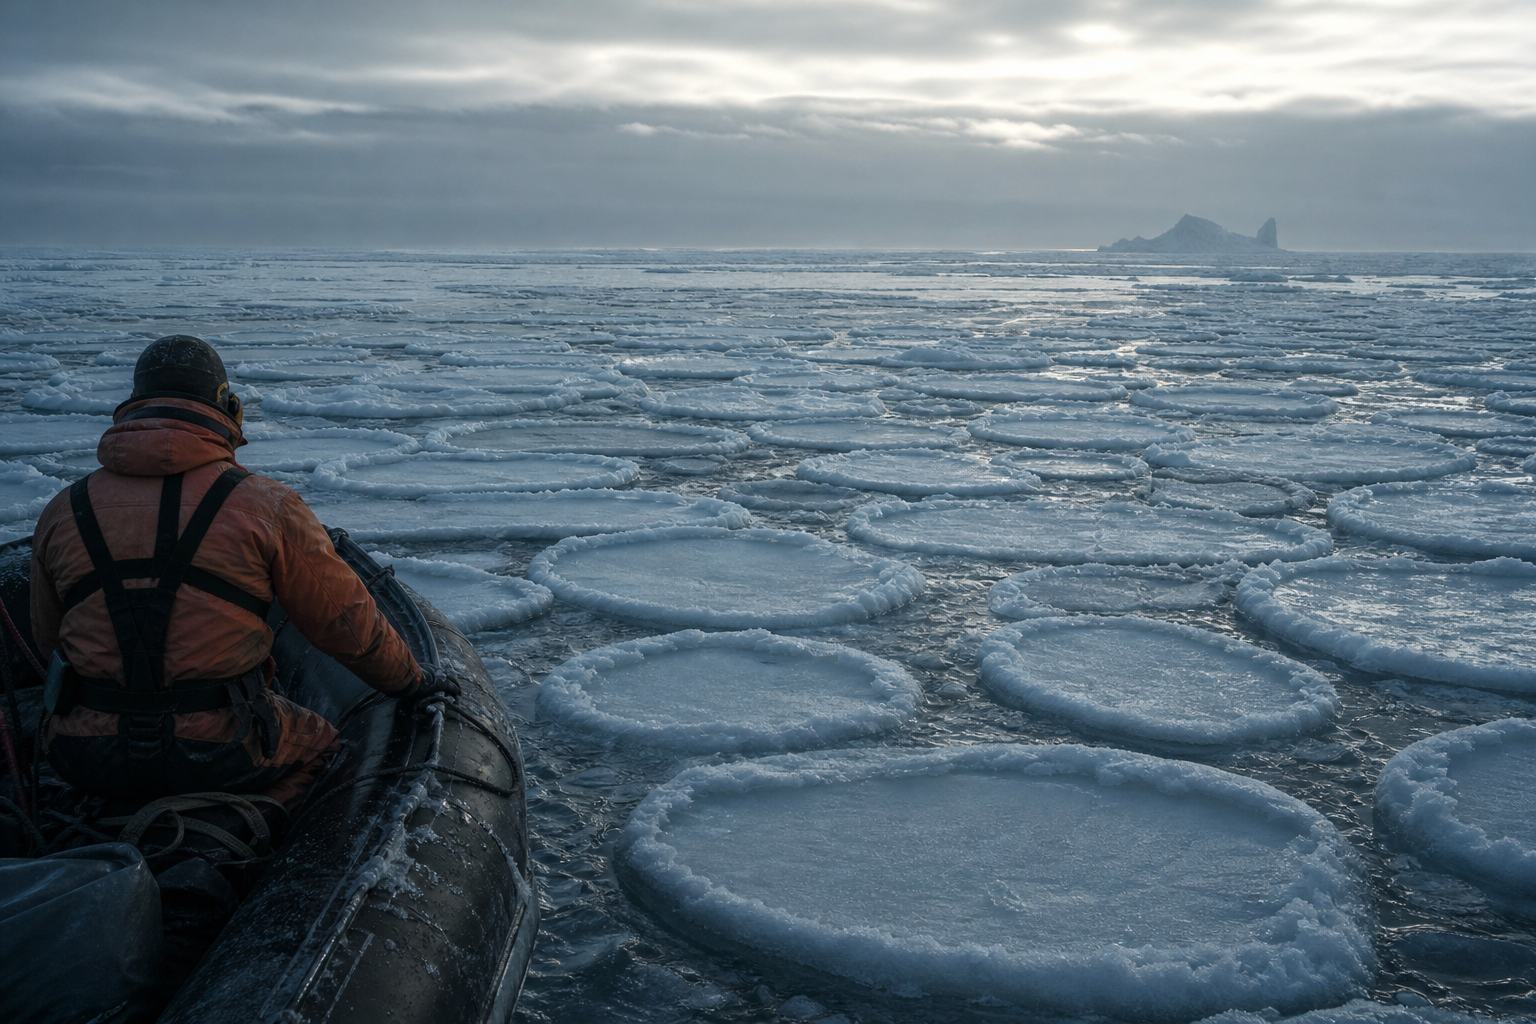
In rough water, the slush is pushed into round cakes that bump into each other and build raised rims. These pancakes can grow to several metres across and more than half a metre thick.
Then they freeze together into a sheet, and the sheet keeps growing from below as more seawater freezes onto its underside. Press Calm water and Rough water to compare.
frazil: tiny loose crystals
calm water: nilas, a thin flexible sheet
rough water: grease ice, then pancakes
Stages of new icePancake ice Collisions push slush onto the edges of each cake, building its raised rim. AI-generated still.
3–5 m
across
50–70 cm
thick
Pancakes (NOAA PMEL)
Chapter I · Freezing the sea
From frazil to floe
Met Office: ice starts as small crystal discs called frazil, which can form thin nilas in calm water or pancake ice in turbulent water; ice then thickens as seawater freezes on its underside (congelation growth). Wadhams (NOAA PMEL): in turbulent water frazil forms grease ice, which compresses into pancakes that can reach 3–5 m in diameter and 50–70 cm thick.
Press Rough water / Calm water in the scene.
The 3D scenes are schematic: ice extents on the globe are drawn as simple caps, not satellite maps.
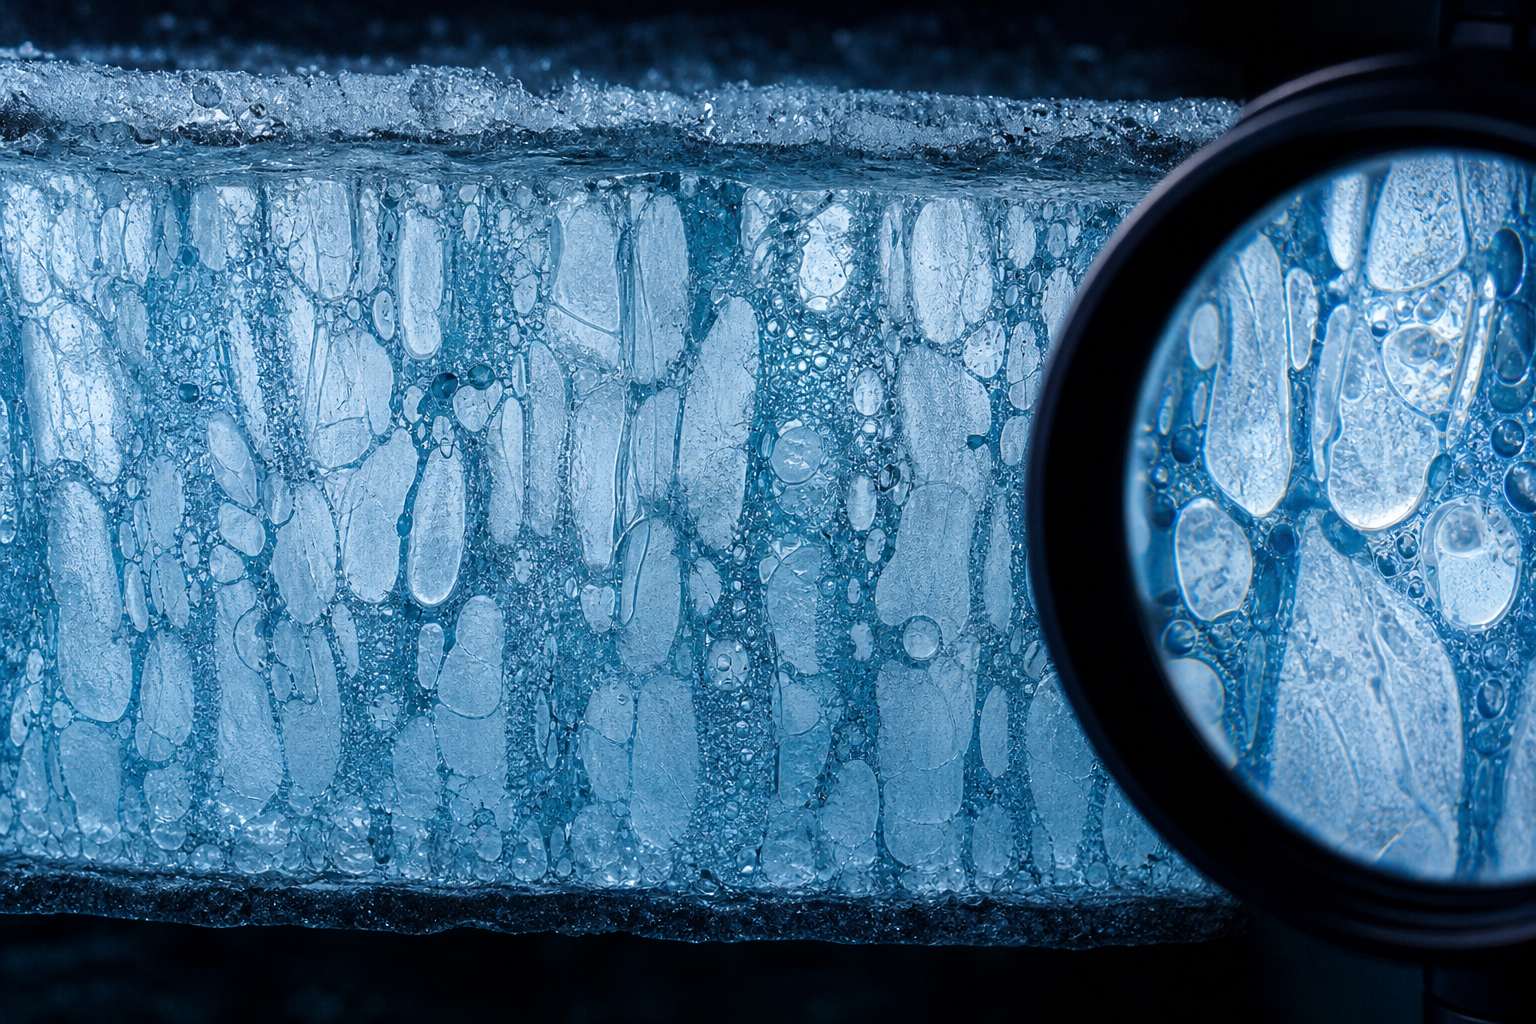
Here is the surprise. Ice crystals have no room for salt. As seawater freezes, most of the salt is pushed out into tiny pockets of very salty water called brine.
Over time the brine drains out. Young sea ice can hold about ten parts per thousand of salt; old ice only one to three. With less brine weakening it, ice that survives the summer becomes much stronger.
The salt that leaves the ice ends up in the water just below it, which becomes saltier, colder and denser, so it sinks. Press Freeze more to speed it up.
Near Antarctica, where strong winds keep patches of water open and ice forms fast, this sinking water helps make Antarctic Bottom Water, the densest and coldest water in the global ocean.
Brine pockets Between the ice crystals run channels of brine far saltier than the sea. Illustration, AI-generated.
seawater
~35‰
young sea ice
~10‰
old sea ice
1–3‰
Salt in sea ice (NOAA PMEL)
rejected salt makes the water below denser
it sinks down the continental slope
near Antarctica, winds keep coastal water open, so ice forms fast
From surface to sea floor
densest
and coldest water mass in the global ocean
Antarctic Bottom Water
Chapter I · Freezing the sea
Brine rejection
Wadhams (NOAA PMEL): as ice grows, salt is rejected and trapped in brine pockets; water from young sea ice may have a salinity of about 10 parts per thousand, dropping to 1–3 in old ice, which makes multiyear ice much stronger. University of Bergen: in Antarctic coastal polynyas, rapid ice formation expels salt, increasing the salinity and density of the water below; this dense shelf water sinks down the continental slope and contributes to Antarctic Bottom Water, the densest and coldest water mass in the global ocean.
A polynya is an area of open water kept free of ice inside the pack, often by strong winds. Press Freeze more in the scene to drop more brine.
The 3D scenes are schematic: ice extents on the globe are drawn as simple caps, not satellite maps.
Ice that grows through one Arctic winter, first-year ice, reaches about one and a half to two metres. Ice that survives one or more summers becomes older, multiyear ice, and thickens year after year to about three metres. Multiyear ice is strong enough to be a serious obstacle even for icebreakers.
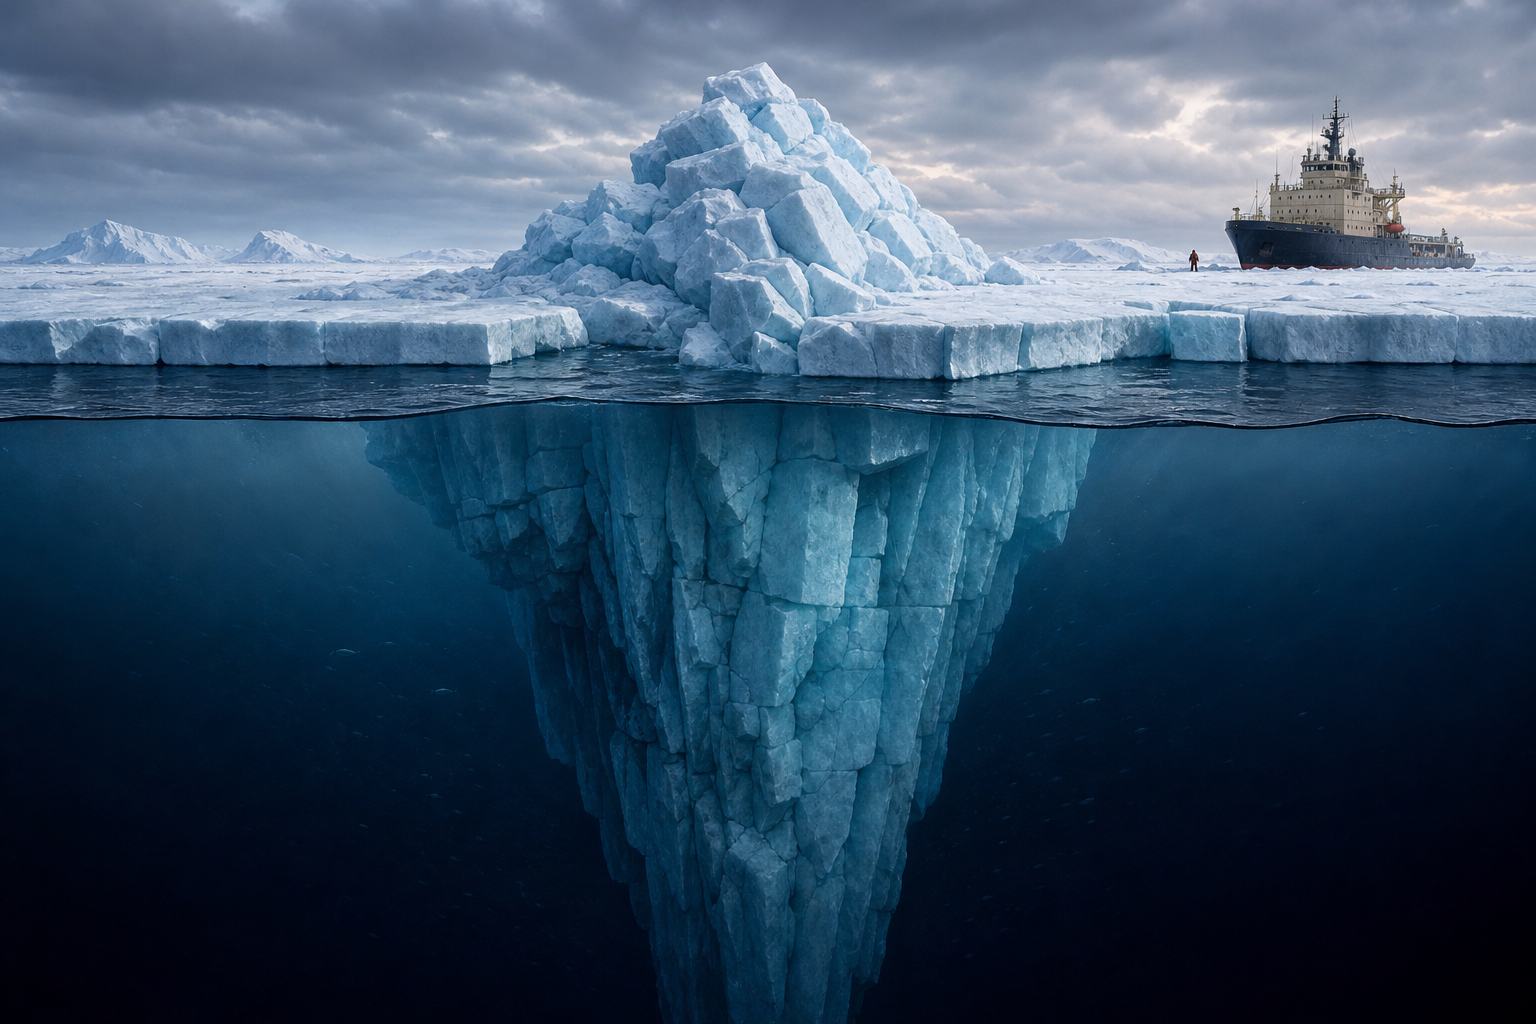
Wind and currents also push floes together. The ice crumples into pressure ridges, with keels that usually reach ten to twenty-five metres below the surface, and sometimes fifty.
On average, ridges probably hold about forty percent of the Arctic's sea ice mass, and more near the coasts.
pancake
0.5–0.7 m
first-year ice
1.5–2 m
multiyear ice
~3 m
Typical thickness (NOAA PMEL)
first-year: grown in one winter, still salty
multiyear: survived a summer, brine drained, harder
Two ages of iceA pressure ridge Most of a ridge is hidden: its keel of broken blocks hangs far below the waterline. Schematic, AI-generated.
10–25 m
typical keel depth
~40%
of sea ice mass
Ridges (Arctic)
Chapter I · Freezing the sea
Thickness
Wadhams (NOAA PMEL): ice grown in a single Arctic season can reach 1.5–2 m; multiyear ice grows yearly to a maximum of about 3 m. Wind-driven convergence builds pressure ridges whose keels can reach 50 m, though most are 10–25 m deep; ridged ice makes up roughly 40% of Arctic sea ice mass on average.
The cut-away in the scene is schematic and vertically exaggerated.
The two poles are opposites. The Arctic is an ocean almost enclosed by land. Its ice grows to about fifteen or sixteen million square kilometres in late winter and typically shrinks to about five or six million in September; recent years have gone lower, like this year's four point six.
Antarctica is the reverse: a continent surrounded by open ocean. With no land in the way, winter ice spreads far north, into warmer waters where much of it melts each summer.
This year it fell to about two point six million square kilometres in February, then grew almost sevenfold by September. Press Season to run the year.
15–16 M km²
maximum, Feb–Mar
5–6 M km²
minimum, September
Arctic (Met Office)
Arctic: an ocean basin enclosed by land
Antarctic: a continent ringed by ocean
Antarctic winter ice reaches warmer latitudes, so more melts
Why they differ
minimum, 26 Feb
2.58 M km²
maximum, 14 Sep
17.59 M km²
Antarctic sea ice, 2026 (NSIDC)
Chapter II · Two poles
Arctic and Antarctic
Met Office: Arctic sea ice reaches a maximum of about 15–16 million km² in February or March and a minimum of about 5–6 million km² in September; in the Antarctic the maximum comes in September and the minimum in February. NASA Earth Observatory: Antarctica is surrounded by ocean, so winter ice can spread far, into warmer latitudes where summer melt is more likely; the Arctic is an ocean basin enclosed by land. NSIDC: the 2026 Antarctic minimum was 2.58 million km² on 26 February; the maximum 17.59 million km² on 14 September.
“Almost sevenfold” is 17.59 ÷ 2.58 ≈ 6.8. The ice caps on the globe are schematic.
Sea ice matters far beyond the poles because of its colour. The share of sunlight a surface reflects is called its albedo.
Open ocean is dark: it reflects only a small fraction of sunlight and absorbs the rest as heat. Bare sea ice can reflect up to sixty percent. Fresh snow on top can push that to about ninety.
So a white sea throws most of the summer sunshine back to space, and a dark sea soaks it up. Press the buttons to compare the surfaces.
albedo=sunlight arrivingsunlight reflected0 means everything is absorbed, 1 means everything is reflected.
open ocean
0.05–0.25
bare sea ice
up to 0.6
snow-covered ice
up to 0.9
Albedo (Meereisportal)
75–95%
of sunlight absorbed by open ocean
~10%
absorbed by snow-covered ice
Turned around: what is absorbedIce meets water The edge of the ice is a boundary between a mirror and a sponge for sunlight. AI-generated still.
Chapter III · The mirror
Albedo
Meereisportal (Alfred Wegener Institute): the albedo of water bodies is very low (0.05–0.25), depending on the sun’s angle; sea ice can reflect up to 60 percent of incoming sunlight, and snow-covered ice can reach 0.9. Melt ponds absorb considerably more sunlight than the surrounding white ice.
The scene shows rays schematically: each surface returns its share of the incoming light.
Now link the two. A warm summer melts some ice and exposes dark water. The water absorbs more sunlight, warms up, and melts more ice.
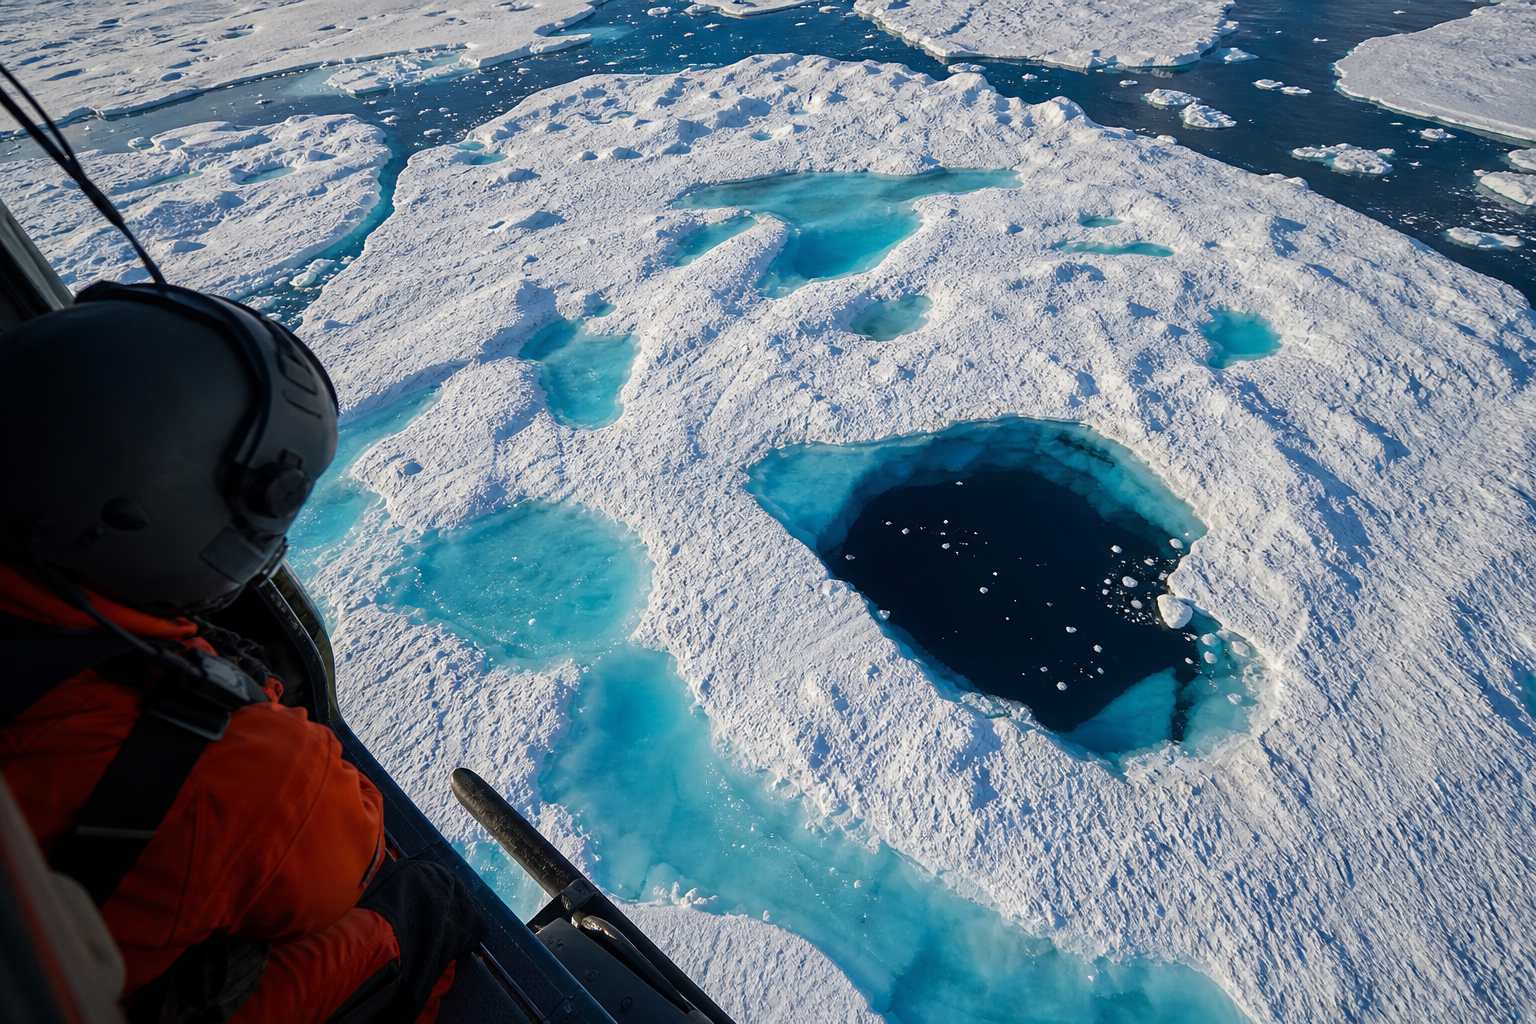
Melt ponds on the ice do the same on a small scale. Scientists call this the ice–albedo feedback: a positive feedback, where positive means self-reinforcing, not good. Press Warm summer to start the loop.
It is one reason the Arctic is warming about twice as fast as most other regions, an effect called polar amplification.
warmth melts ice
dark water is exposed
more sunlight absorbed
more warmth, more melting
The loopMelt ponds Blue melt ponds on summer ice absorb far more sunlight than the white ice around them. AI-generated still.
~2×
Arctic warming compared with most other regions
Polar amplification
Chapter III · The mirror
Ice–albedo feedback
Meereisportal: warmer summers melt snow and sea ice, exposing darker water, which absorbs more sunlight, warms and melts more ice, a positive feedback that contributes to polar amplification; the Arctic is warming about twice as fast as most other regions. The Met Office describes the same ice-albedo feedback as able to amplify Arctic warming.
The feedback is one of several reasons for polar amplification. Some studies give a larger factor for recent decades; this film uses the figure in the cited source.
Most of the polar ocean is dark for months and covered in cloud, so how do we measure the ice? With satellites that listen for microwaves.
Ice and water give off different amounts of natural microwave energy, and microwaves pass through clouds and need no daylight. This passive microwave record began with NASA's Nimbus-7 satellite in late 1978.
Later satellites have carried it on, building a long, continuous record of both poles from a chain of spacecraft, nearly forty-eight years so far.
months of polar night
frequent cloud
millions of square kilometres to cover
The problemA microwave view Microwave sensors map ice concentration day and night, through cloud. Illustration, AI-generated.
1978 Nimbus-7 begins the record
1987 DMSP satellites join
2002–11 NASA’s Aqua contributes
2025 JAXA’s GCOM-W added
The satellite record (NASA)
Chapter IV · Watching from space
Passive microwave
NASA Earth Observatory: passive microwave sensors detect sea ice through clouds, since microwaves can pass through them. The record began with NASA’s Nimbus-7 in late 1978; DMSP satellites were added in 1987, Aqua contributed from 2002 to 2011, and JAXA’s GCOM-W was added in 2025. NSIDC describes the record as nearly 48 years long.
“Passive” means the satellite only receives the microwaves that the surface naturally emits; it sends none of its own. The orbit in the scene is schematic.
In the Arctic, the record tells a clear story. In September 2012 the ice shrank to three point four one million square kilometres, nearly half the average of 1979 to 2000. The previous record, set in 2007, had been four point one seven million.
That is still the lowest on record. According to NSIDC, the twenty lowest Arctic minimums in the satellite era have all happened in the last twenty years.
This year's four point six million ties for tenth-lowest. One year can buck the trend; the long record is what scientists watch.
2007 (record until 2012)
4.17
2012 (record low)
3.41
2026
4.60
Arctic September minimum
−0.76 M km²
below the old record in five years
2012 vs 2007
20 of 20
lowest Arctic minimums fall in the last 20 years
NSIDC
single years vary with weather and winds
trends show over decades
2026 figures were preliminary
Reading a record
Chapter IV · Watching from space
Arctic minimums
NSIDC (2012): Arctic sea ice reached its minimum on 16 September 2012 at 3.41 million km², the lowest since satellite records began in 1979 and nearly half the 1979–2000 average; the previous record was 4.17 million km² in 2007. NSIDC (2026): the 2026 minimum of 4.60 million km² tied for tenth-lowest; the last 20 years hold the 20 lowest Arctic extents in the satellite record.
The chart in the scene shows only years given in the sources, not the full series.
Antarctica has been harder to read. From 1979 to 2014 its sea ice grew slightly, by about one percent a decade, and set record winter highs in 2012, 2013 and 2014.
Then, from 2016, it fell sharply. In 2023 Antarctica set both its lowest summer minimum and its lowest winter maximum on record, and 2026 brought the third-lowest maximum.
Scientists are still working out whether this is a lasting shift or part of the region's large natural swings.
1979–2014 ~+1% per decade
2012–14 record winter highs
2016– substantial losses
2023 lowest minimum and maximum
2026 third-lowest maximum
Antarctic sea ice (NASA)Southern Ocean ice Since 2016 Antarctic sea ice has mostly stayed below its historical average, with a few modest recoveries. AI-generated still.
A striking reversal from the preceding decades.NASA Earth Observatory, October 2026
Chapter IV · Watching from space
An open question
NASA Earth Observatory: from 1979 to 2014 Antarctic sea ice extent rose by about 1% per decade, though researchers are unsure the gain was a meaningful long-term change; winter extent set record highs in 2012–2014. The upward trend ended in 2015, and from 2016 the region saw substantial losses. In 2023 Antarctica recorded both its lowest summer minimum and lowest winter maximum. Scientists are tracking whether the declines are lasting or within normal variability.
This film does not assign a cause to the Antarctic decline: the cited source does not, and research on it is ongoing.
One common worry is that melting sea ice will flood coastlines. It will not, at least not directly. Fill a glass to the brim with water and ice, and wait. Press Melt floating ice to try it.
As the ice melts, the glass does not overflow. Floating ice already pushes aside its own weight of water, so its meltwater simply fills the space it took up. That is Archimedes' principle, and it works almost exactly the same way in the Arctic Ocean.
Ice on land is different: when glaciers and ice sheets melt, new water pours into the sea. Sea ice matters for a different reason: its mirror.
A full glass Try it at home: the level stays put as the ice melts. AI-generated still.weight of floating ice=weight of water it displacesSo the meltwater exactly fills the hole the ice made in the water.
meltwater from ice sheets and glaciers: yes (NASA)
seawater expanding as it warms: yes (NASA)
melting floating sea ice: not directly
What raises sea level
Chapter V · Why it matters
Archimedes and the sea
Florida Atlantic University / NASA education: melting Arctic sea ice does not contribute directly to sea level rise, because floating ice already displaces its own weight in water; as it melts, the meltwater fills the space the ice occupied (Archimedes’ principle).
The Arctic is a region where Earth loses heat overall: it is dark for months, and in summer its snow and ice reflect much of the sunlight.
The Intergovernmental Panel on Climate Change, in its sixth assessment, says the Arctic is likely to be practically free of sea ice in September at least once before 2050.
Practically free means very little ice is left, not none at all.
little sunlight for much of the year
snow and ice reflect much of what arrives
a net heat-loss region for the planet
Why the Arctic loses heat (Met Office)
The Arctic is likely to be practically sea ice free in September at least once before 2050.IPCC Sixth Assessment Report (via Hong Kong Observatory)
Late summer Where white ice once lay at summer’s end, more dark water would soak up sunlight. AI-generated still.
Chapter V · Why it matters
Projections
Met Office: the Arctic is a net heat-loss region for the planet, partly because sea ice and snow reflect much of the sun’s energy. IPCC AR6 (as summarised by the Hong Kong Observatory): the Arctic is likely to be practically sea ice free in September at least once before 2050.
The shrinking cap in the scene is schematic, not a projection map.
So sea ice is the ocean breathing with the seasons: salt water that freezes below minus one point eight, squeezes out its salt, and spreads a white mirror across the poles.
Next September, the satellites will measure it again. In the Arctic, will it set a new low? In the Antarctic, will the ice recover, or keep falling? Watch the numbers.
1978 satellite record begins
2012 Arctic record low
2023 Antarctic record lows
2026 Antarctic 3rd-lowest max; Arctic =10th-lowest min
before 2050 Arctic likely practically ice-free in a September (IPCC)
Milestones
salt water freezes at about −1.8 °C and rejects its salt
white ice reflects; dark water absorbs
floating ice does not directly raise sea level
Three ideas
Epilogue
Sources
Every number in this film comes from the sources below. 2026 figures were preliminary when announced.
Stills are AI-generated illustrations, not photographs.
The 3D scenes are schematic: ice extents on the globe are drawn as simple caps, not satellite maps.