Since mid-September 2026 floods have reached 51 Thai provinces. This film explains the fundamentals behind every river flood, using the Chao Phraya basin that covers a third of Thailand: where monsoon rain comes from, why soaked soil sends water to the river, how four rivers become one funnel, why dams cannot both store and protect, why a sinking delta city fears the tide, and what a “100-year flood” really means. Soak the soil, send a storm down the basin, run a dam through a wet season and roll thirty years of odds yourself.
Interactive 3D film9 min1964 to 2026Published 16 October 2026
Follow a raindrop from the mountains to the Gulf of Thailand.
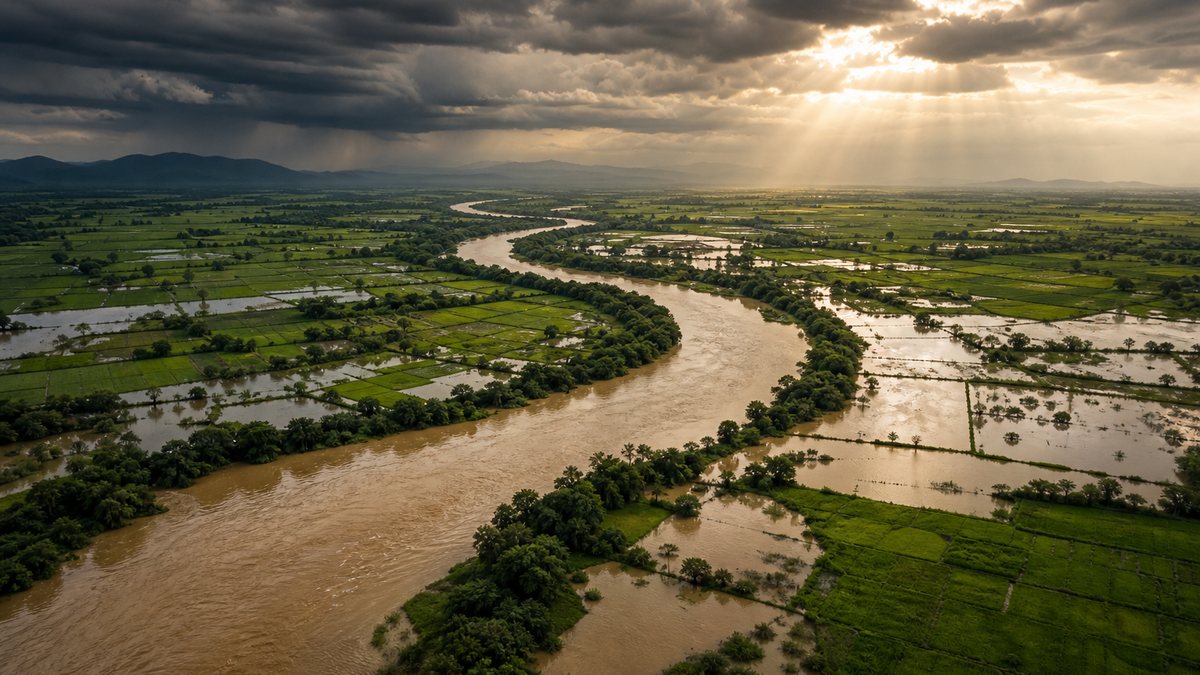
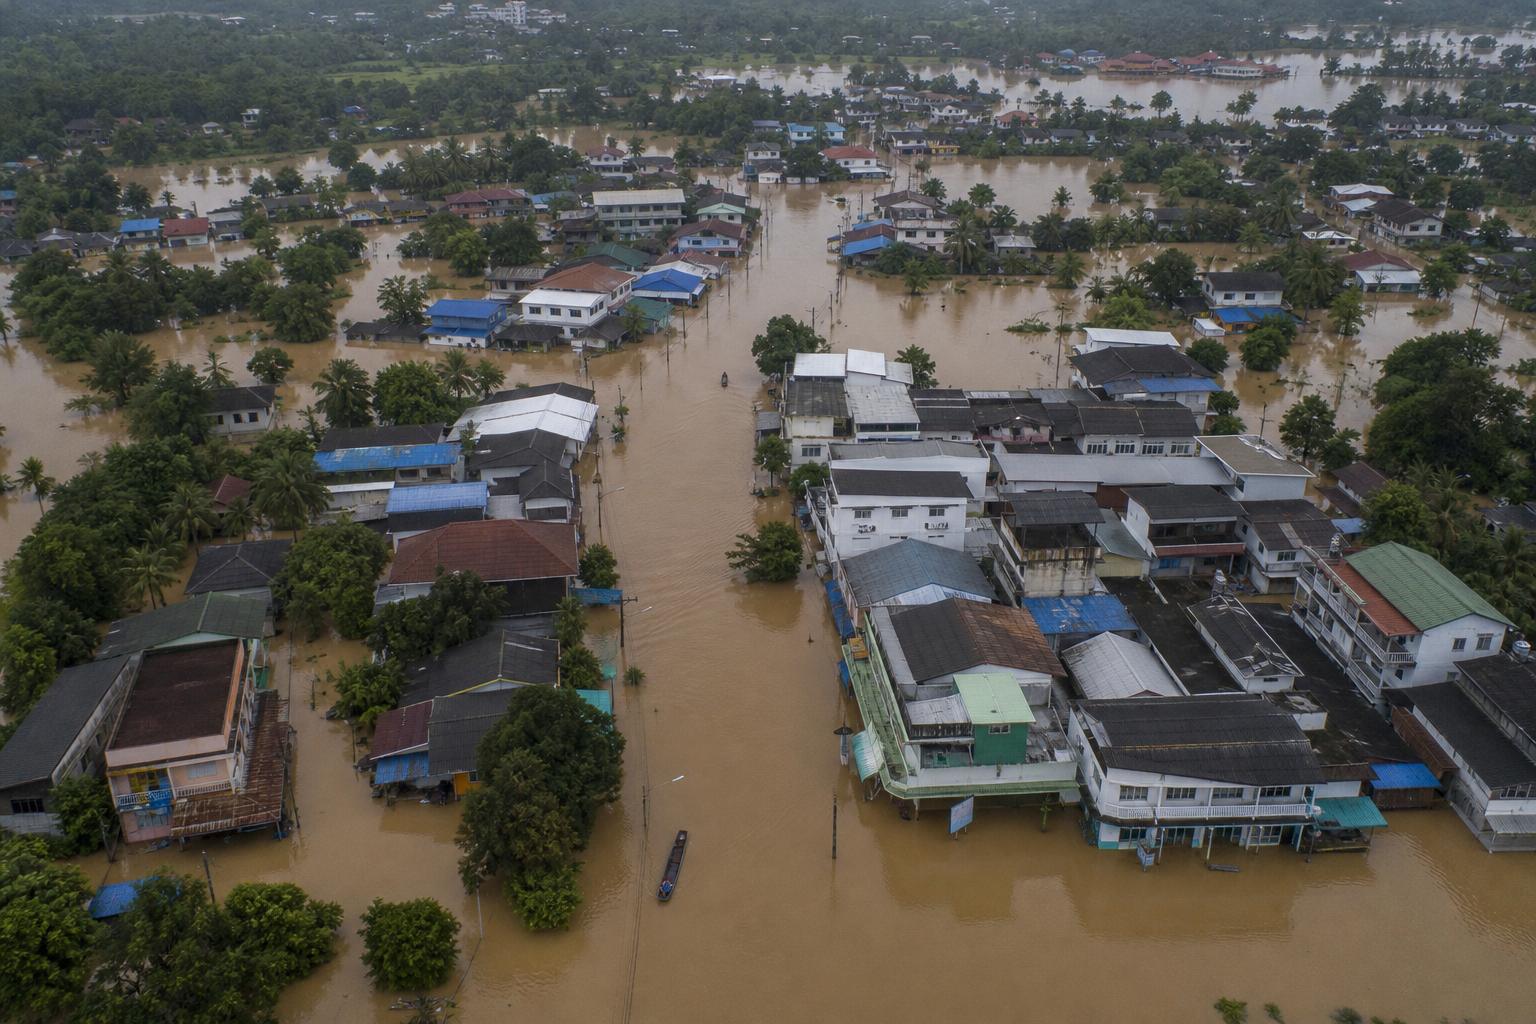
Water that fell on mountains weeks ago is now standing in rice fields and city streets. Since mid-September 2026, floods have reached fifty-one Thai provinces, and by the twelfth of October seventy-one people had died.
Floods like this are not bad luck. They follow rules: where rain falls, what the ground does with it, and how a whole country's water finds its way to the sea.
This year's floods spread across several river basins. This film follows the largest of them, the Chao Phraya, link by link, from the clouds to the tide.
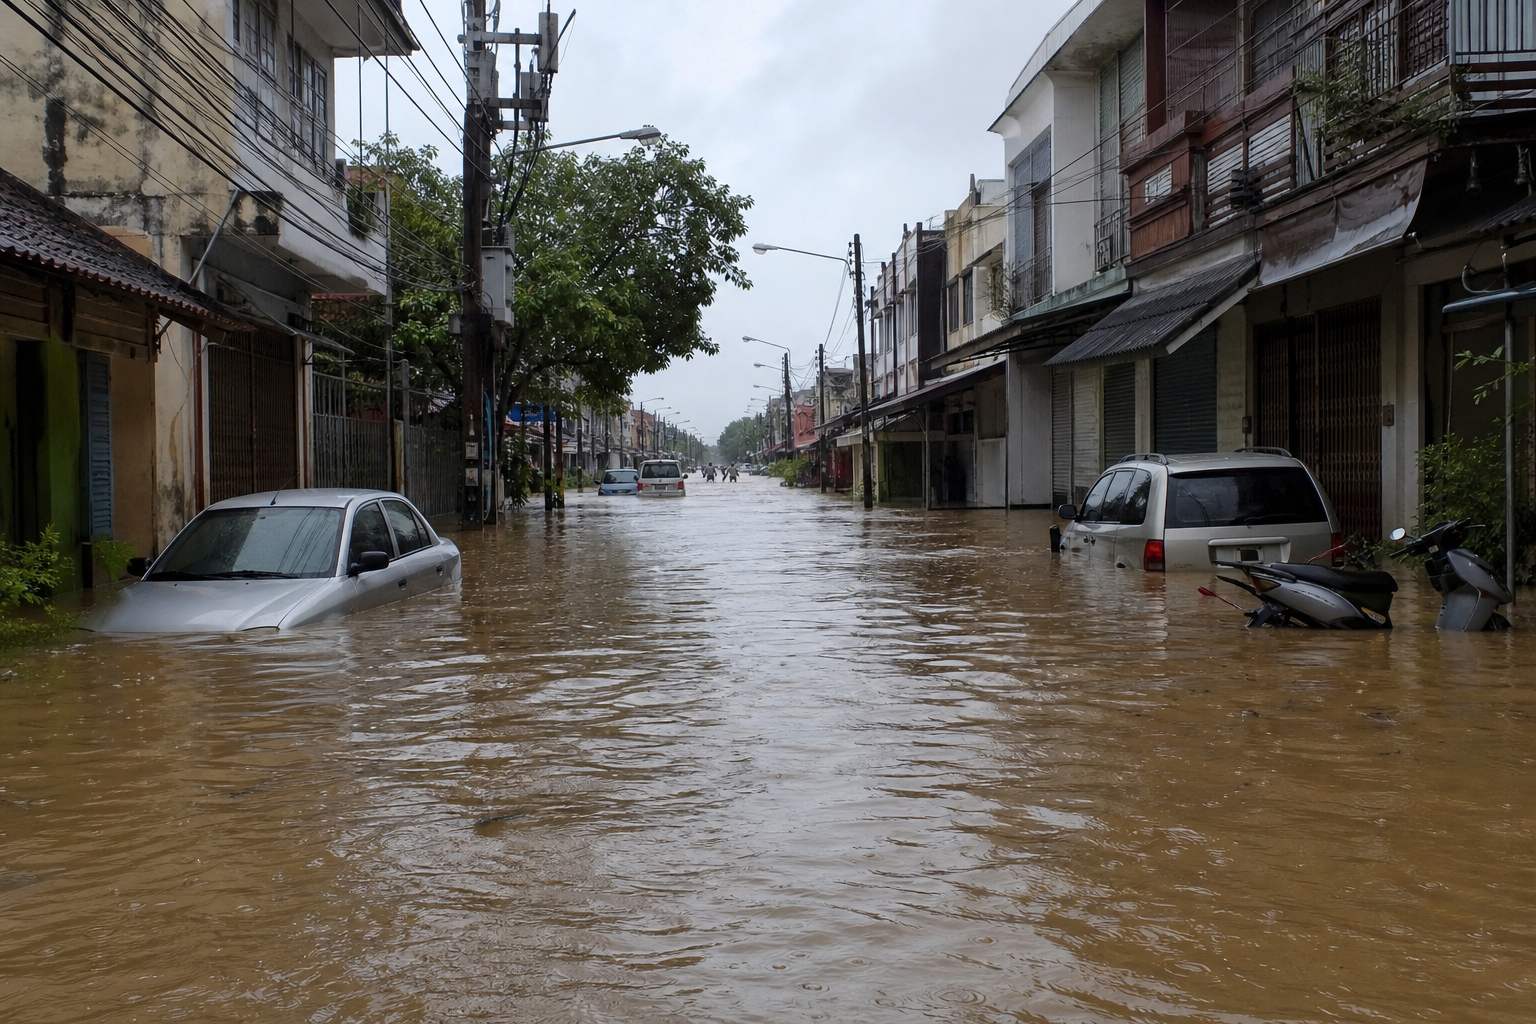
Bangkok, late September Low streets fill first; in 2026 some areas of the city stayed knee-deep for days. AI-generated still.
71
deaths
51
provinces flooded
~908,000
households affected
16 Sep – 12 Oct 2026
Sky: monsoon rain
Soil: soak in or run off
River: the funnel
Dam, delta, tide
The chain
Prologue · The news
Floods across Thailand
According to the Interior Ministry, floods between 16 September and 12 October 2026 affected 51 provinces and about 908,000 households and killed 71 people. Bangkok and about twenty other provinces still had flooded areas on 12 October.
AFP reported on 7 October that 19 people had died in Prachinburi, the highest provincial toll it listed, and that Bangkok received about a month of rain in a few days in late September. This film is not a report on 2026: it explains the physics and history behind every river flood in the Chao Phraya basin.
How to use: pick a chapter or press ← →; drag to rotate. Eight steps have buttons you can press.
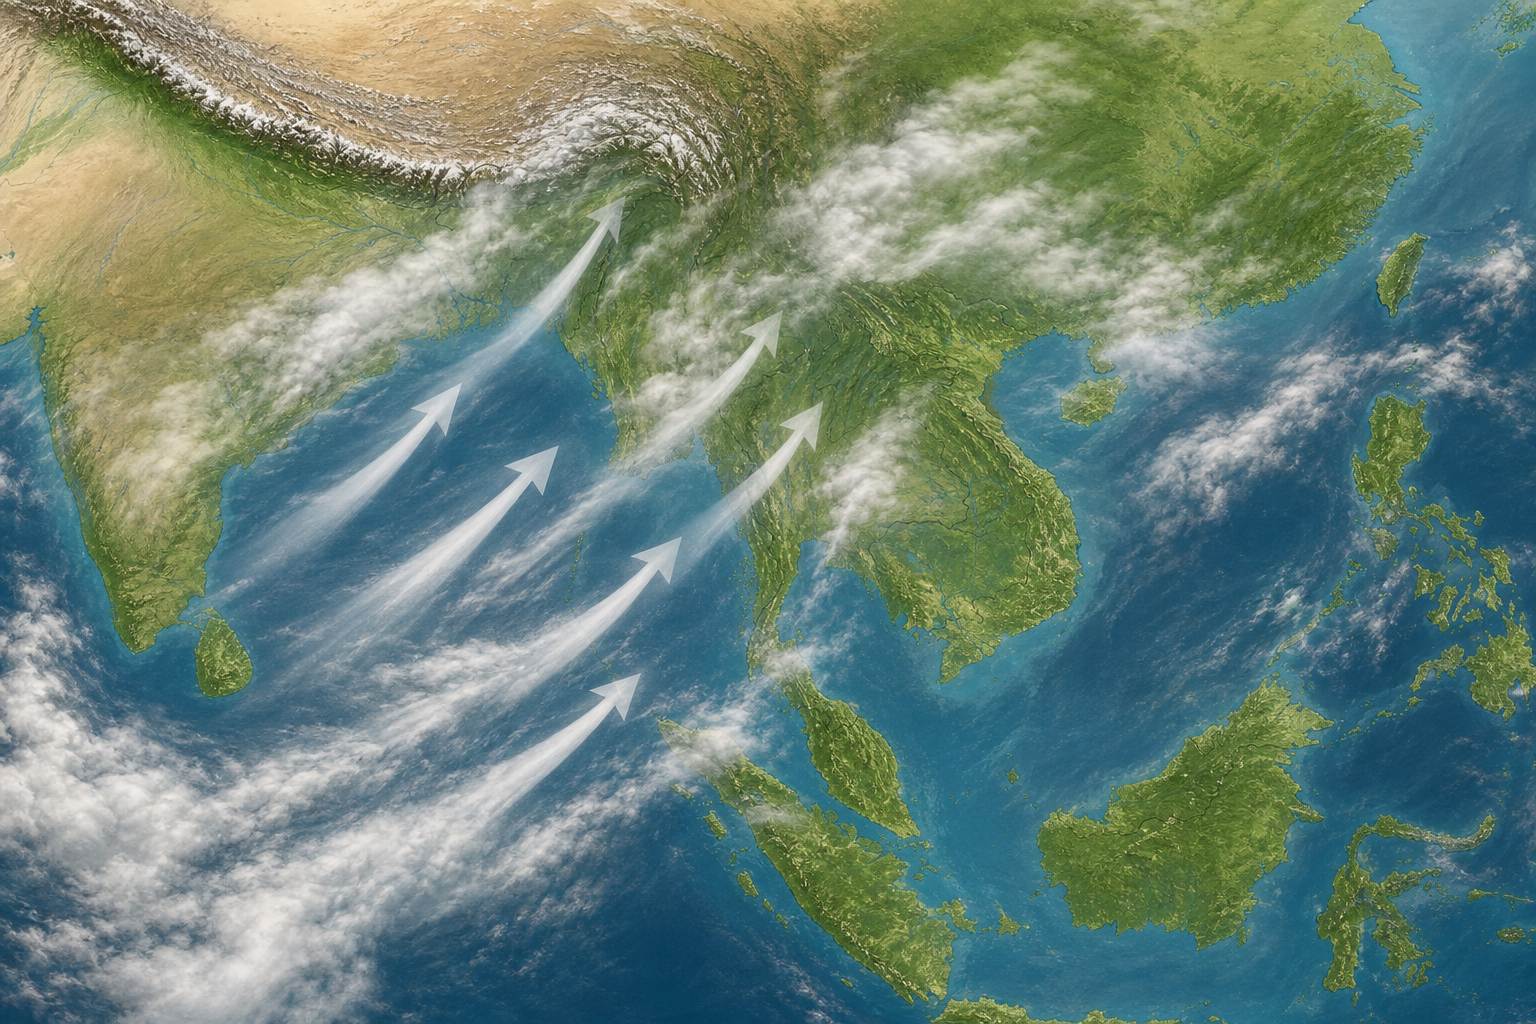
It starts over the Indian Ocean. Each year from about mid-May, the south-west monsoon carries warm, wet sea air over mainland Southeast Asia.
When that air rises over hills and heats over land, its water vapour condenses into cloud and falls as rain. Thailand's rainy season runs until about mid-October.
The rain peaks in August and September. By then, the land has been drinking for three months.
South-west monsoon Moist air from the Indian Ocean and the Bay of Bengal. Schematic illustration, AI-generated.
Thailand’s Land Development Department describes three seasons. The rainy season, driven by the south-west monsoon, runs from mid-May to mid-October and peaks in August and September.
The southern east coast follows a different calendar: rain stays high through the end of the year, with November the wettest month.
A raindrop that lands on soil has two roads. It can soak in, filling the gaps between grains, or it can run across the surface toward the nearest stream.
Soil can only take in water at a certain rate. In a drizzle, almost everything soaks in. In a downpour, rain arrives faster than the ground can swallow it, and the extra runs off.
Try it. Switch between drizzle and downpour and watch where the drops go.
runoff=r−f(if r>f)
r
rain intensity (mm per hour)
f
infiltration capacity of the soil
Infiltration-excess runoffThe first choice Water pools on the surface only when the soil below cannot take it fast enough. AI-generated still.
soil already wet from earlier rain
steep slopes with thin soil
bare or compacted ground
What lowers infiltration
Chapter II · The ground
Infiltration and runoff
Hydrologists call the first road infiltration. When rain falls faster than the soil’s infiltration capacity, the excess flows over the surface — “Hortonian” or infiltration-excess overland flow.
The numbers in the interactive model are illustrative, not measurements of Thai soils.
There is a second way to make runoff. Below every field lies the water table, the level under which the ground is already full of water. After weeks of rain it rises until the soil is saturated from below, and then even gentle rain has nowhere to go.
Press a week of rain and watch the blue layer climb. As it does, the share of water running straight to the river grows.
That is why the same storm is harmless in June and dangerous in September. And where the ground is paved over, almost nothing soaks in, wet season or dry.
water table: the top of the ground that is already full
happens first in hollows and at the foot of slopes
the wet area grows as the basin gets wetter
field studies find it more common than runoff from heavy rain alone
Saturation-excess runoff
June
dry soil: most of it soaks in
September
soaked soil: most of it runs off
One storm, two months
dry soil, drizzle
0 %
dry soil, downpour
58 %
soaked soil, downpour
93 %
pavement
98 %
Share of rain that runs off (model)
Chapter II · The ground
Saturation from below
In saturation-excess overland flow the soil is already full, so rain — and groundwater seeping back up — runs over the surface. The area that produces runoff grows as the whole watershed gets wetter, which hydrologists call the variable source area.
The bar chart comes from the simplified model on screen, not from field data.
Hydrologists draw a flood as a curve: how much water passes a point in the river, hour by hour, after a storm. Rain falls at the start; the river rises later.
In a forested valley, much of the rain soaks in and seeps out slowly, so the peak comes late and stays low. Now switch to a paved city.
Roofs, roads and drains send water to the river at once. In one US Geological Survey study around Washington, D.C., urban development raised flood peaks by about two to nearly eight times.
peak discharge: the most water at once
lag time: from the rain to the peak
recession: how fast it drains away
Reading a hydrograph
slow
water held in the soil seeps out to the river
low
a late, gentle peak
Forest
2 – 8×
higher flood peaks after urban development
down to ⅛
of the natural delay before the peak, with piped drainage
USGS, 81 sites
Chapter II · The ground
The storm hydrograph
Paving replaces ground that would soak up rain, and drains carry runoff straight to streams, so peaks are higher and arrive sooner. A USGS study of 81 sites, most around Washington, D.C., found development could raise peaks by a factor of about two to nearly eight, with drainage that could cut lag time to as little as one-eighth of natural channels.
The curves on screen are schematic: their shape, not their height, is the point.
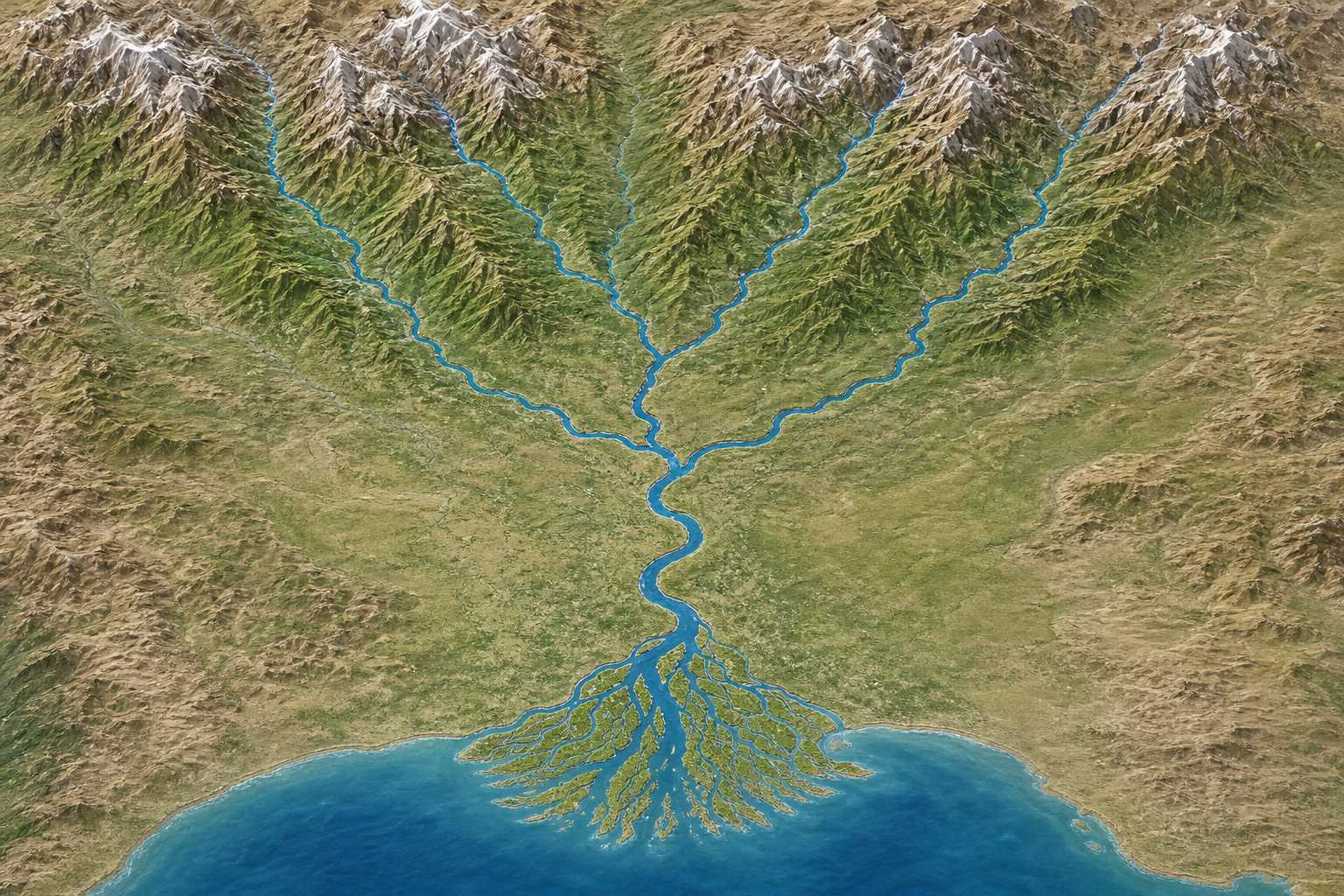
Now zoom out. In the northern mountains, four rivers collect the runoff: the Ping and the Wang, the Yom and the Nan.
The Wang joins the Ping, the Yom joins the Nan, and at Nakhon Sawan the two meet to become the Chao Phraya, which runs about three hundred and seventy kilometres to the sea.
Altogether the basin covers almost a hundred and sixty thousand square kilometres, about a third of Thailand. Press Send a storm: rain from four valleys pours into one river, and it swells far more than any of them alone.
A drainage basin Every slope tilts toward one outlet, like a funnel. Schematic relief, AI-generated.
372 km
Nakhon Sawan to the gulf
Chai Nat
where the Tha Chin branches off: a second, smaller way to the sea
The river
157,924 km²
drains to the Chao Phraya
35%
of Thailand’s land
The basin
the four valleys’ flows add up
below Nakhon Sawan the land is almost flat
on flat land, spilled water spreads wide
Why the river swells
Chapter III · The funnel
The Chao Phraya basin
The Chao Phraya begins at Nakhon Sawan (Pak Nam Pho), where the Ping — with its tributary the Wang — meets the Nan, which has already taken in the Yom. It runs 372 km to the Gulf of Thailand; at Chai Nat the Tha Chin branches off and reaches the sea separately, west of Bangkok.
The whole watershed draining into it and its tributaries covers 157,924 km², about 35% of Thailand. The 3D relief is schematic and its height is exaggerated.
Two giant dams sit high on the funnel's branches. Bhumibol, finished in 1964 on the Ping, can hold about thirteen and a half billion cubic metres. Sirikit, finished in 1972 on the Nan, holds about nine and a half billion.
Each has two jobs that pull against each other. Farmers need water stored for the dry season. Flood control needs empty space for the storms to come.
Try the rainy season both ways. Keep the dam full, and once it is full it must pass on everything that flows in, all at once. Release early, and the flood downstream stays small, but the dry season starts with less water.
Bhumibol (Ping, 1964)
13.46
Sirikit (Nan, 1972)
9.51
Total reservoir capacity
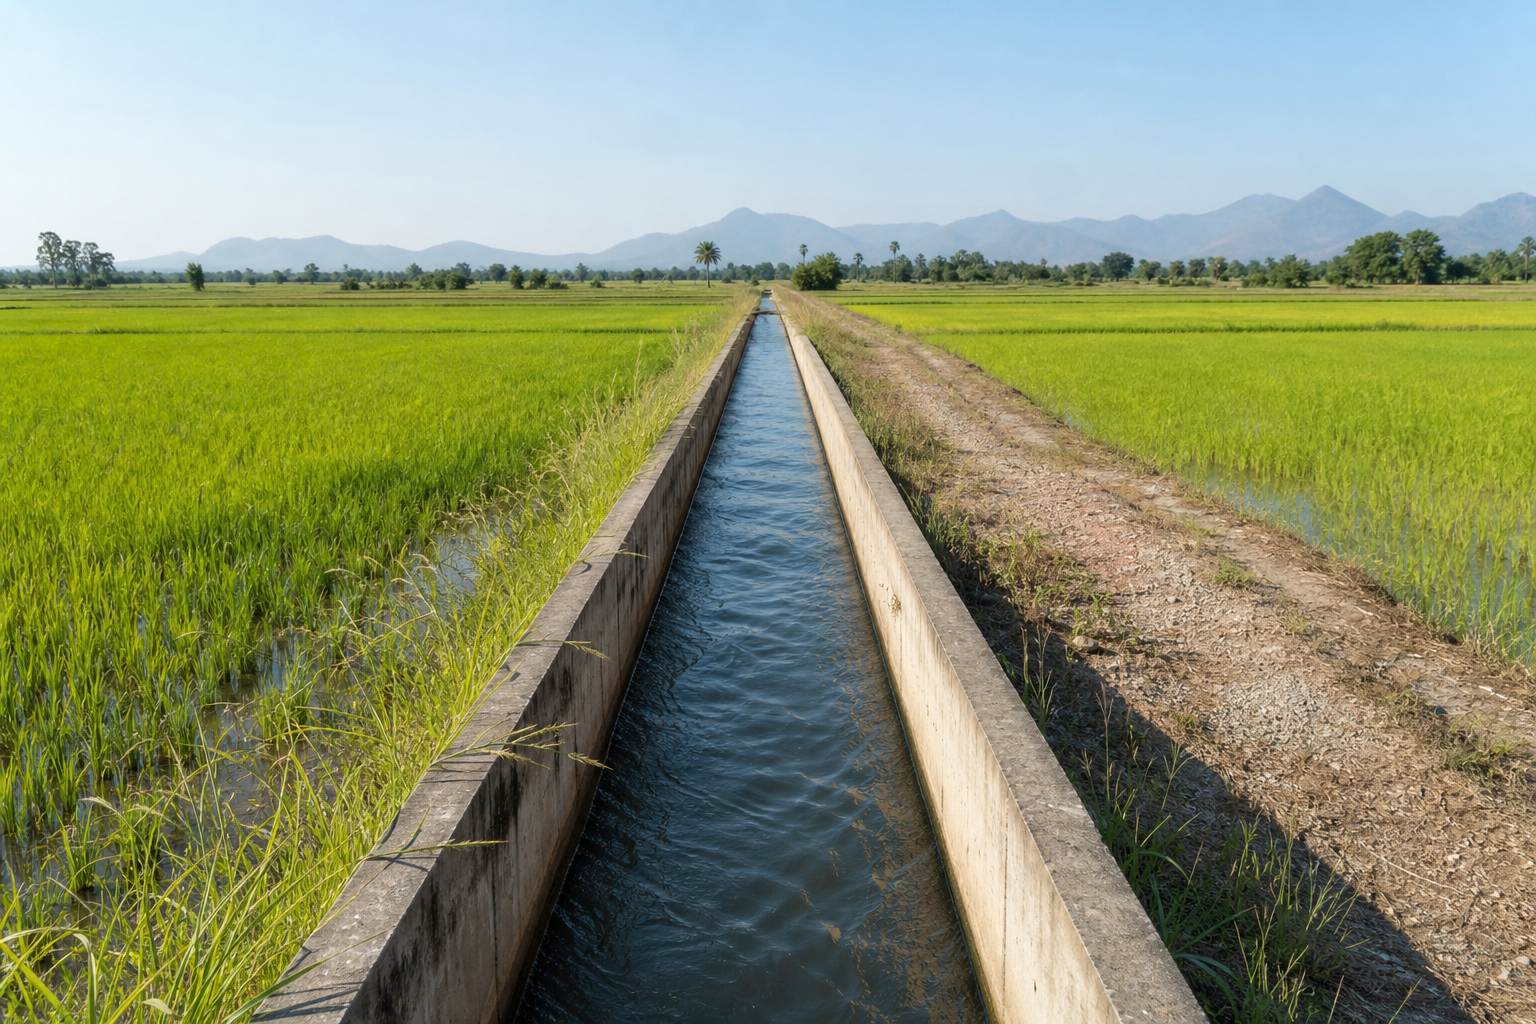
Water for the dry season Stored water feeds irrigation canals long after the rains stop. Bhumibol stands 154 m high, the tallest dam in Thailand. AI-generated still.
irrigation and power want it full
flood control wants room to spare
nobody knows the rain in advance
The dilemma
9.76 bn m³
usable storage out of 13.46 billion
Bhumibol
Chapter IV · The dams
Bhumibol and Sirikit
Bhumibol Dam on the Ping (built 1958–1964, 154 m) has a total capacity of about 13.46 billion m³, of which about 9.76 billion is usable storage; Sirikit Dam on the Nan (completed 1972, 113.6 m) about 9.51 billion m³. Both serve irrigation, hydropower and flood control.
The rainy-season game is schematic, with invented inflows for one very wet year. It shows the trade-off, not how either dam is actually operated.
In 2010 rain was scarce, and by June the reservoirs were at record lows. Keeping water became the priority.
Then 2011 turned. In March, rain over northern Thailand was more than four times the normal amount. In three months, Bhumibol collected over eight billion cubic metres and filled.
Storms kept coming. By early October most dams were near or over capacity and had to release more, adding water to a river that was already overflowing.
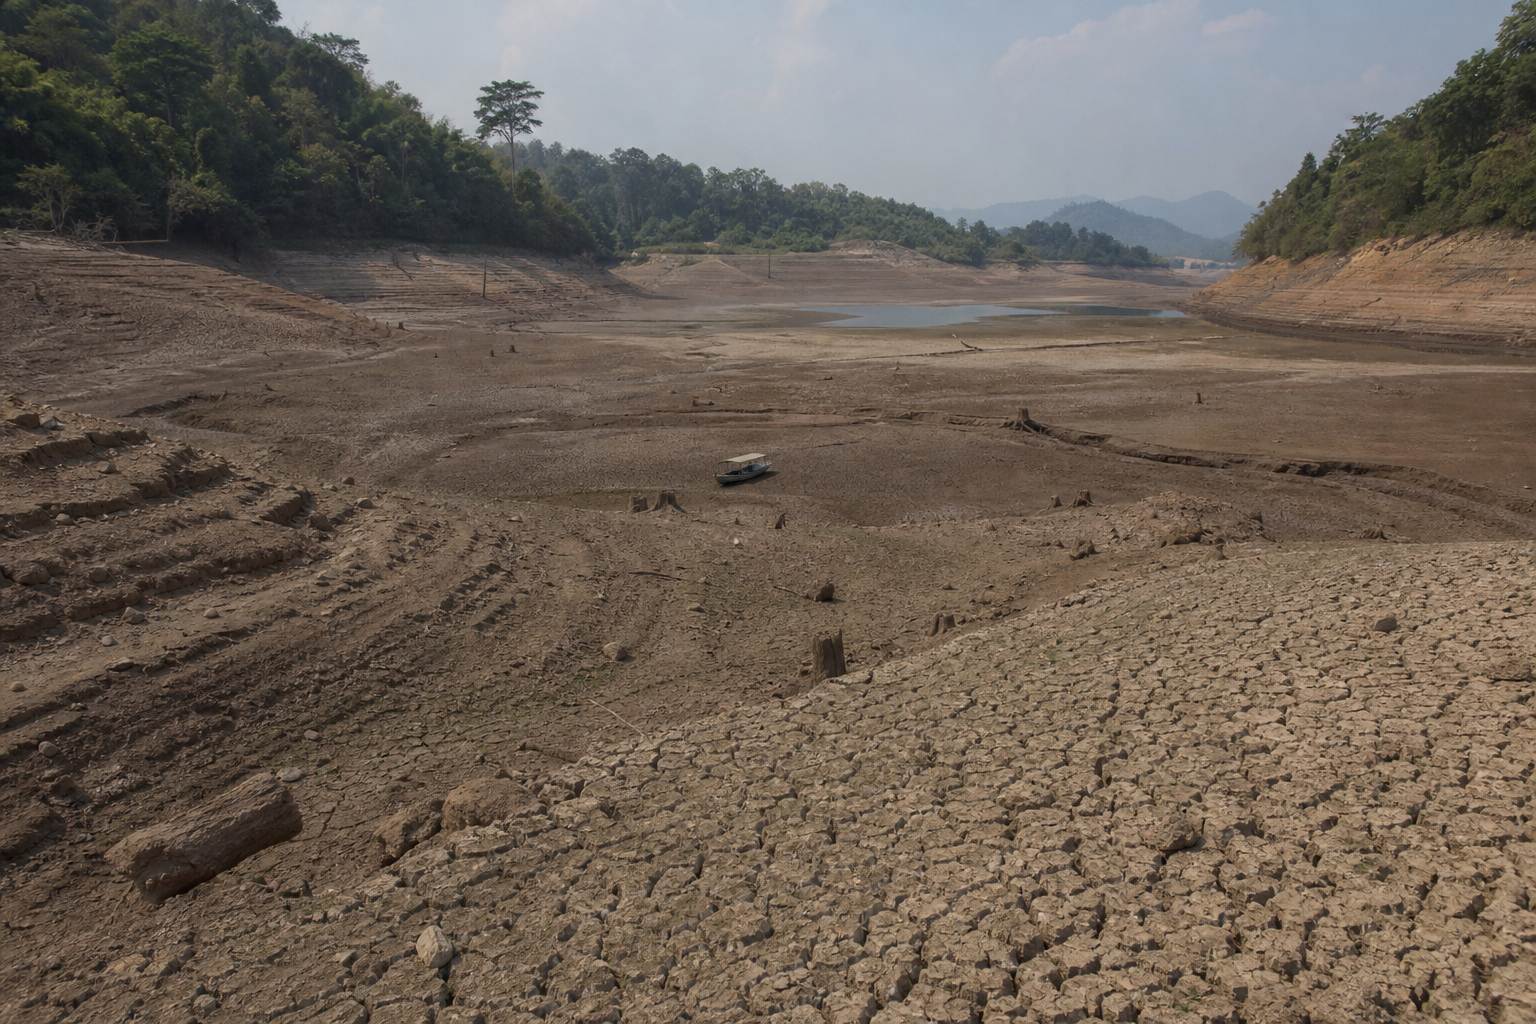
June 2010 Dam levels hit record lows after a dry 2010, so keeping water became the priority. AI-generated still.
+344%
above the March mean: about 4.4 times normal
242.8 mm
at Bhumibol Dam, against a normal 25.2 mm
March 2011, northern Thailand
Jun 2010 Dams at record lows
Mar 2011 Freak dry-season rain in the north
31 Jul 2011 Tropical Storm Nock-ten brings floods
Early Oct 2011 Dams near or over capacity, releases rise
From drought to flood
Chapter IV · The dams
The set-up for 2011
Low rainfall in 2010 left dam levels at record lows in June 2010. In March 2011 rainfall over northern Thailand was 344% above the mean; Bhumibol received 242.8 mm against a normal 25.2 mm. Bhumibol collected over 8 billion m³ in three months, and by early October most dams were near or over capacity and forced to increase discharge.
The larger releases drew accusations of mismanagement at the time; how much they added to the flood is debated, and this film does not try to settle it.
At the bottom of the funnel lies Bangkok, built on the flat mud of the Chao Phraya delta. Most of the city stands only half a metre to two metres above the sea.
Here the river is tidal. Once or twice a day the gulf rises and pushes back up the channel, so floodwater coming down can only drain when the tide goes out.
Studies of Bangkok's historic floods found that the highest monthly tides, and possibly storm surges, can make a river flood worse, just as the peak flow from the north arrives.
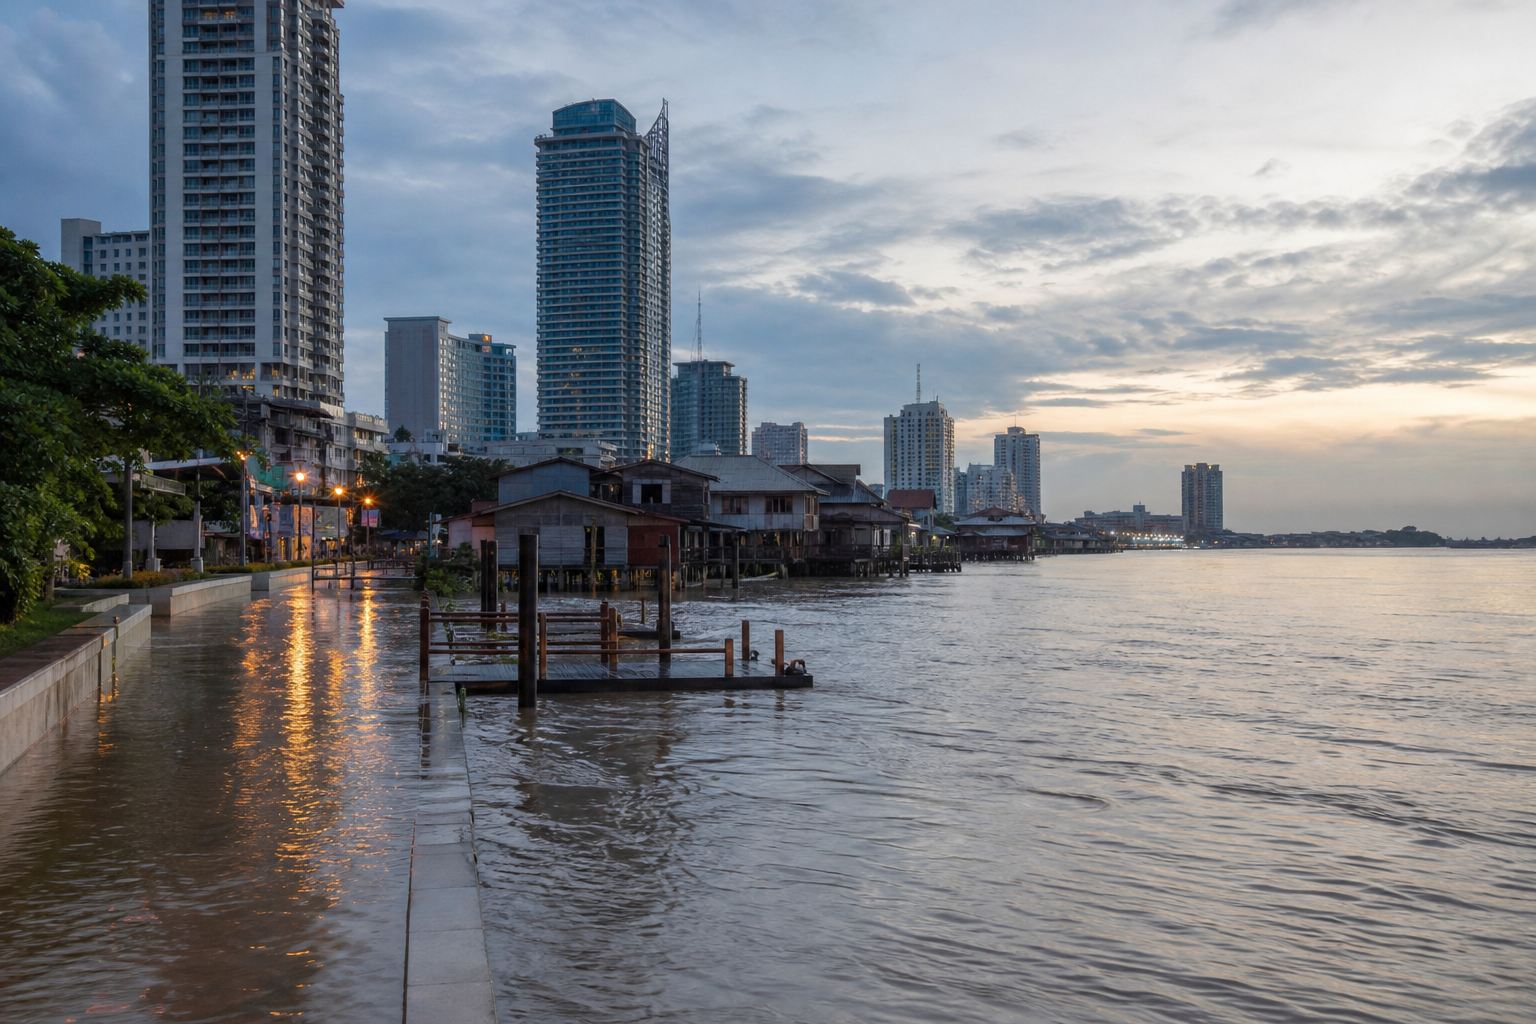
The delta city At high tide the river can rise to the edge of riverside walkways even without rain. AI-generated still.
0.5–2 m
above sea level
1–2 a day
high tides pushing up the river
Bangkok
spring tides, the highest of the month
wind-driven meteorological tides
storm waves, and possibly storm surge
Marine factors that worsen a river flood
Chapter V · The delta
River meets sea
Bangkok sits only about 50 cm to 2 m above sea level. A 2020 study of the Bangkok floods of 1785 and 1983 found that spring tides, wind-driven tides, storm waves and possibly surge can aggravate seasonal peak river flows in the tidal lower Chao Phraya.
The 3D model exaggerates heights so the tide can be seen.
The delta has another problem: it sinks. Its soft clay is squeezed when water is pumped out of the layers below, and the ground above settles.
In the 1980s, with factories and homes pumping groundwater freely, parts of Bangkok were sinking about ten centimetres a year. Press the pump and watch the street drop toward the tide.
Laws, groundwater charges and close monitoring slowed it. By 2020 most of the city was sinking about one centimetre a year or less, but the lost height does not come back.
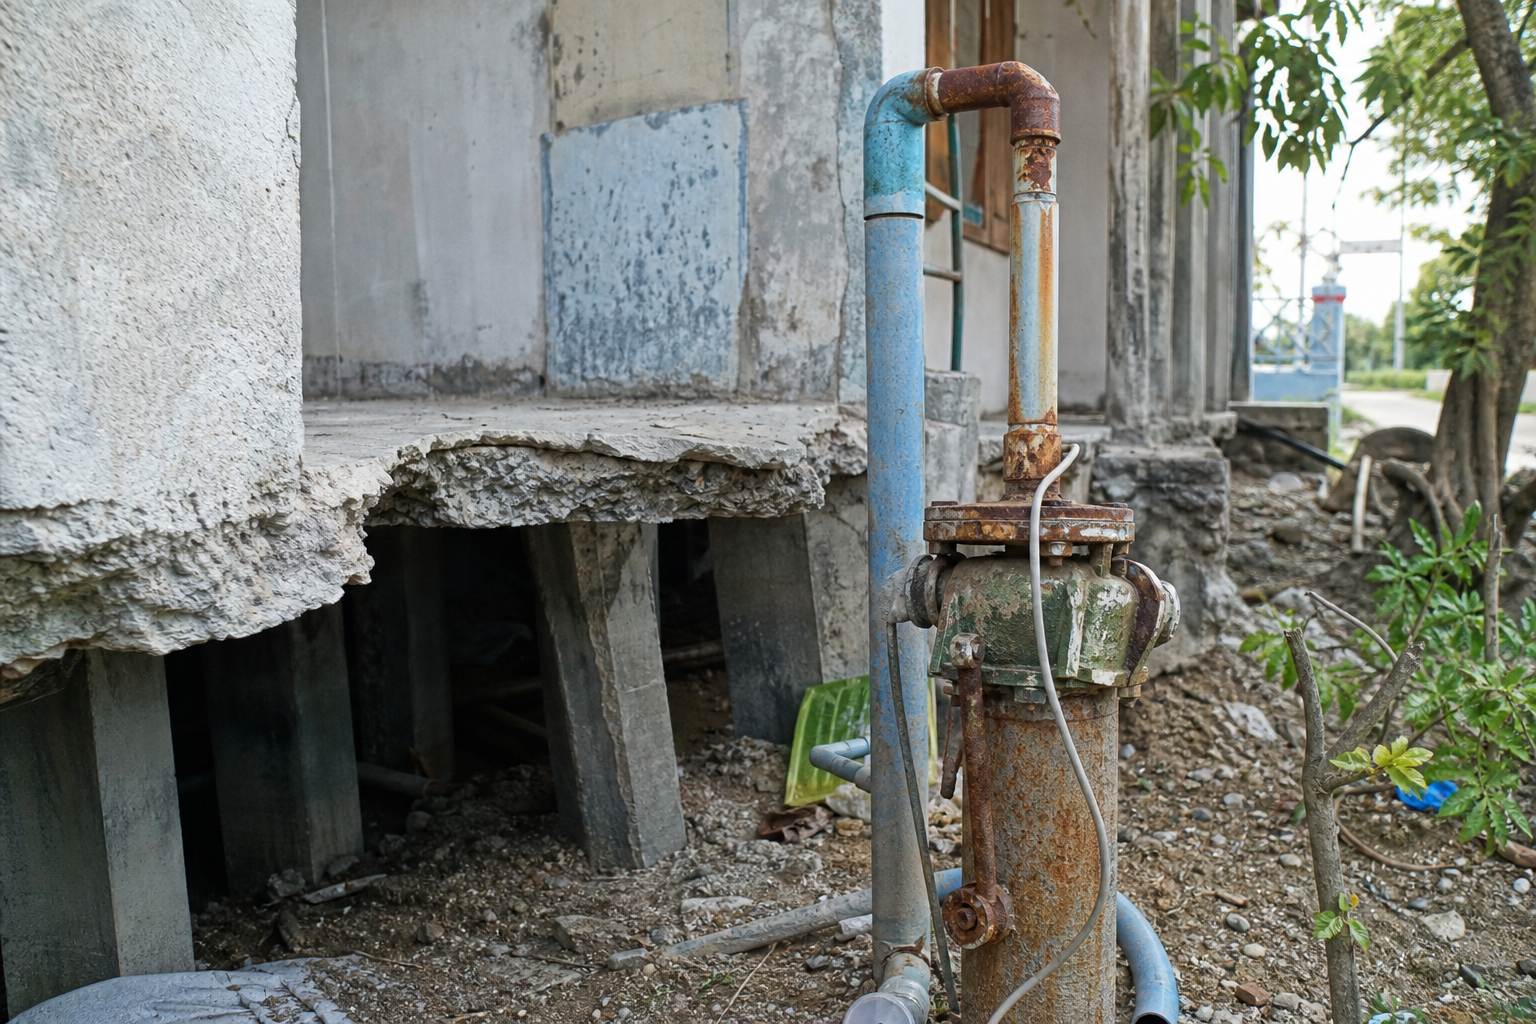
Groundwater well Pumping drains water from the clay layers, which compact and do not spring back. AI-generated still.
1980s
~10
most of the city, by 2020
0–1
How fast Bangkok sank
legislation on wells
a price on groundwater
monitoring wells and extraction
What slowed it
Chapter V · The delta
Land subsidence
Rapid development and uncontrolled groundwater pumping made Bangkok sink about 10 cm a year in the 1980s. A hydrogeologist at Thailand’s Ministry of Natural Resources and Environment credits legislation, groundwater pricing and close monitoring of wells for slowing it to about 1 cm a year or less in most of the city.
The pump button lowers the model city one metre per press, a deliberately exaggerated scale.
The flood that stopped factories around the world.
In 2011 every link gave way together. Soaked soil, a full funnel, brimming dams and a low delta. The water spread south for months, from late July until the middle of January.
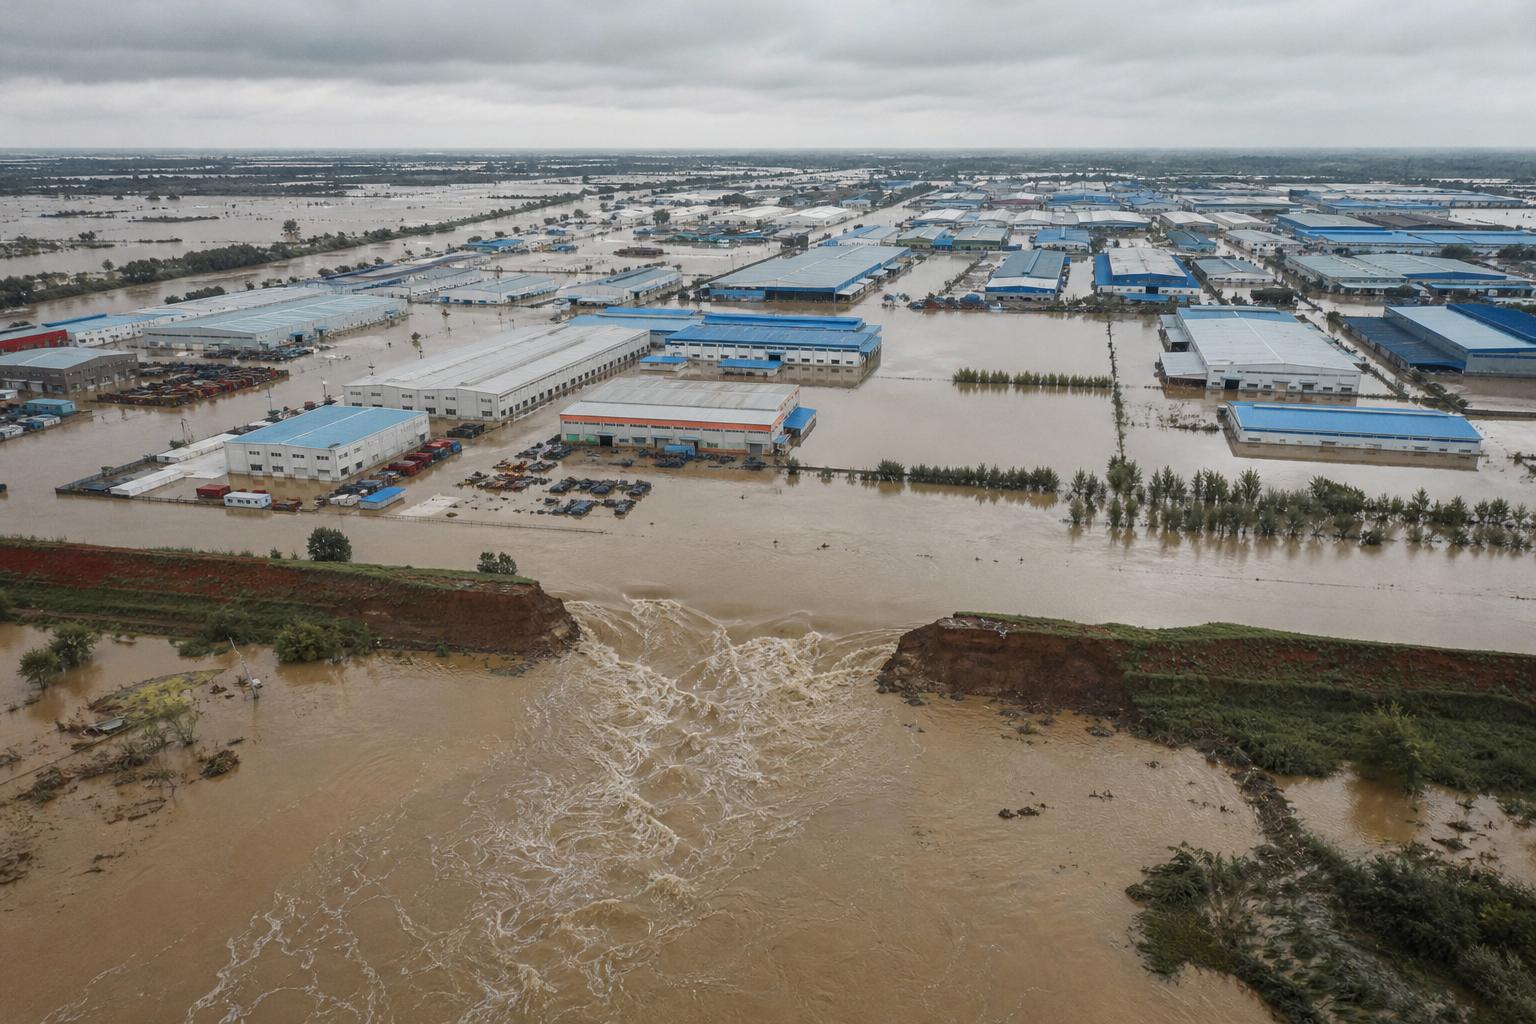
Eight hundred and fifteen people died, and thirteen point six million were affected. North of Bangkok, barriers around industrial estates in Ayutthaya and nearby provinces failed, and seven major estates went under, in places three metres deep.
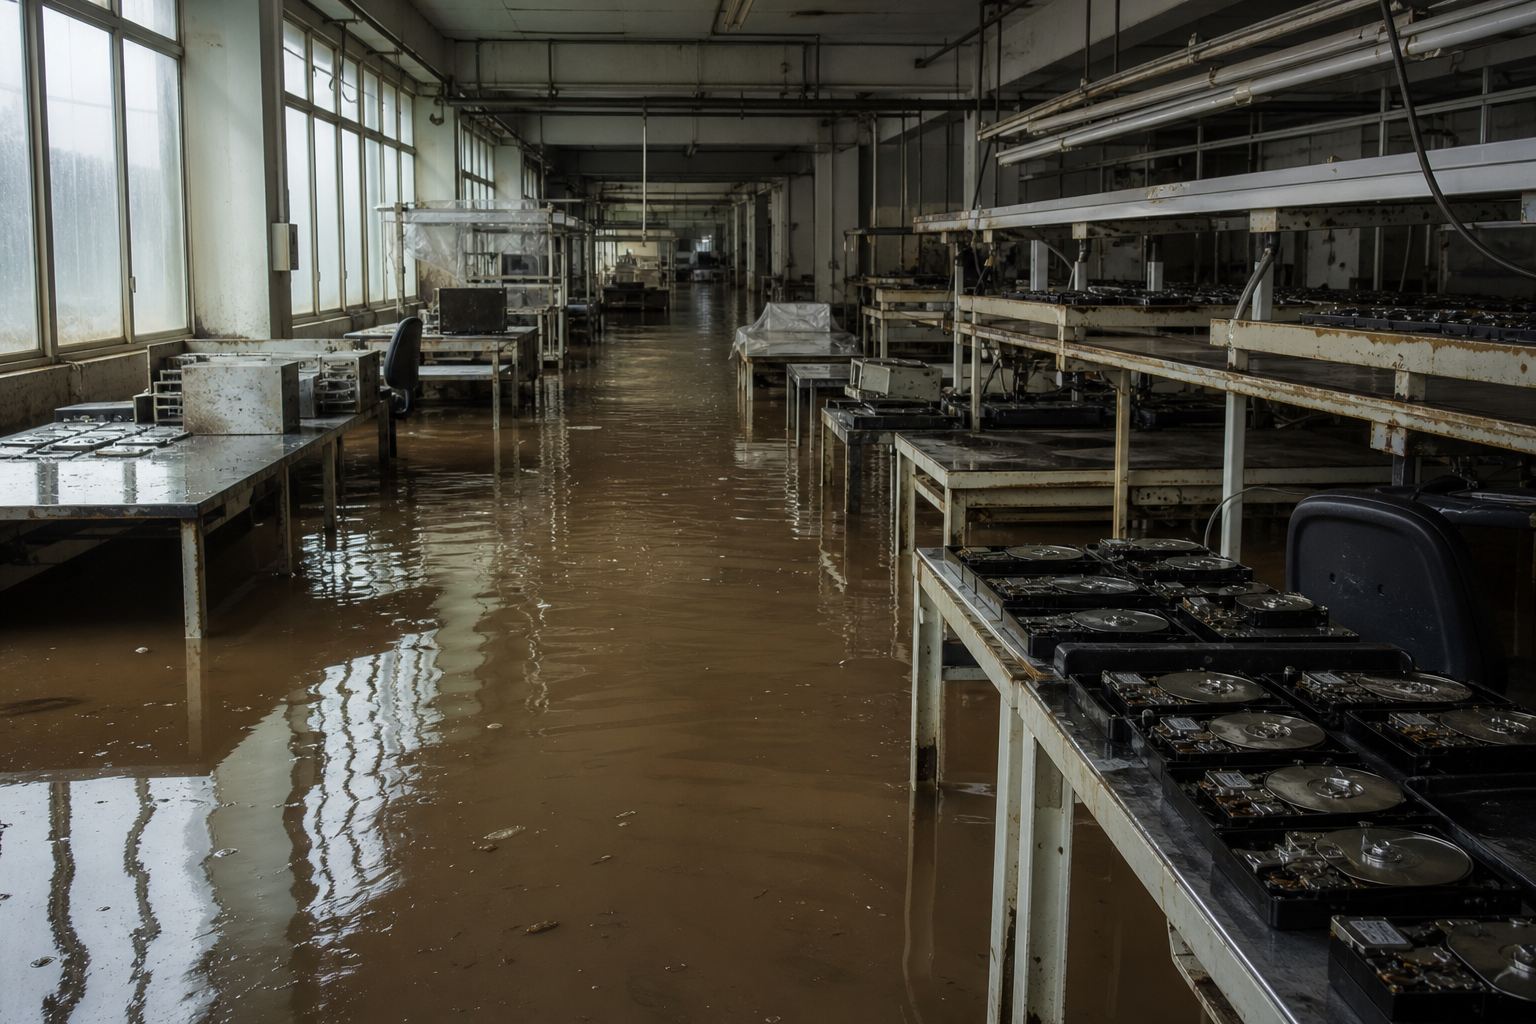
Thailand made about a quarter of the world's hard drives, so the shortage was felt worldwide. The World Bank put the damage at forty-six and a half billion dollars, then the fourth costliest disaster on record.
Months under water In 2011 floodwater stood in some towns for weeks before it could drain south. AI-generated still.Ayutthaya, October 2011 The 10-metre Nikom Rojna barrier collapsed on 8 October 2011. AI-generated still, not a photograph of the event.
815
deaths
13.6 million
people affected
65
provinces declared disaster zones
The 2011 floodsA global supply chain About 25% of the world’s hard disk drives came from Thailand. AI-generated still.
ahead Tōhoku earthquake and tsunami, 2011
ahead Great Hanshin (Kobe) earthquake, 1995
ahead Hurricane Katrina, 2005
No. 4 Thailand floods, 2011
Costliest disasters as of 2011
Chapter VI · 2011
The great flood of 2011
Floods lasted from late July 2011 to mid-January 2012, killed 815 people and affected 13.6 million; 65 provinces were declared disaster zones. Seven major industrial estates were inundated, up to 3 m deep. The World Bank estimated damage at 1.425 trillion baht (US$46.5 billion), the fourth-costliest disaster as of 2011.
Downtown Bangkok was largely defended by late November 2011.
Will a flood like 2011 come back? Engineers answer with odds. A “hundred-year flood” does not come once a century. It is a flood with a one per cent chance of happening in any given year.
Every year starts with the same odds, so two can come back to back. Over thirty years, the chance of at least one is about one in four.
Roll thirty years for twenty towns and count how many get hit. Then try a ten-year flood: almost every town meets one.
1%
chance in any single year
not
a schedule: two can come in a row
A “100-year” floodP=1−(1−p)n1−(0.99)30≈0.26
p
chance in one year (0.01 for a “100-year” flood)
n
number of years
At least one in n years
“100-year” flood
26%
“50-year” flood
45%
“10-year” flood
96%
Chance of at least one in 30 years
Chapter VII · Living with water
Return periods
The USGS explains that the recurrence interval is the average number of years between floods of a given size, and that agencies prefer the annual exceedance probability: a 100-year flood has a 1% chance in any year, and each year begins with the same chance.
The 30-year figures come from P = 1 − (1 − p)ⁿ, which assumes years are independent. A changing climate or a changing basin moves p itself.
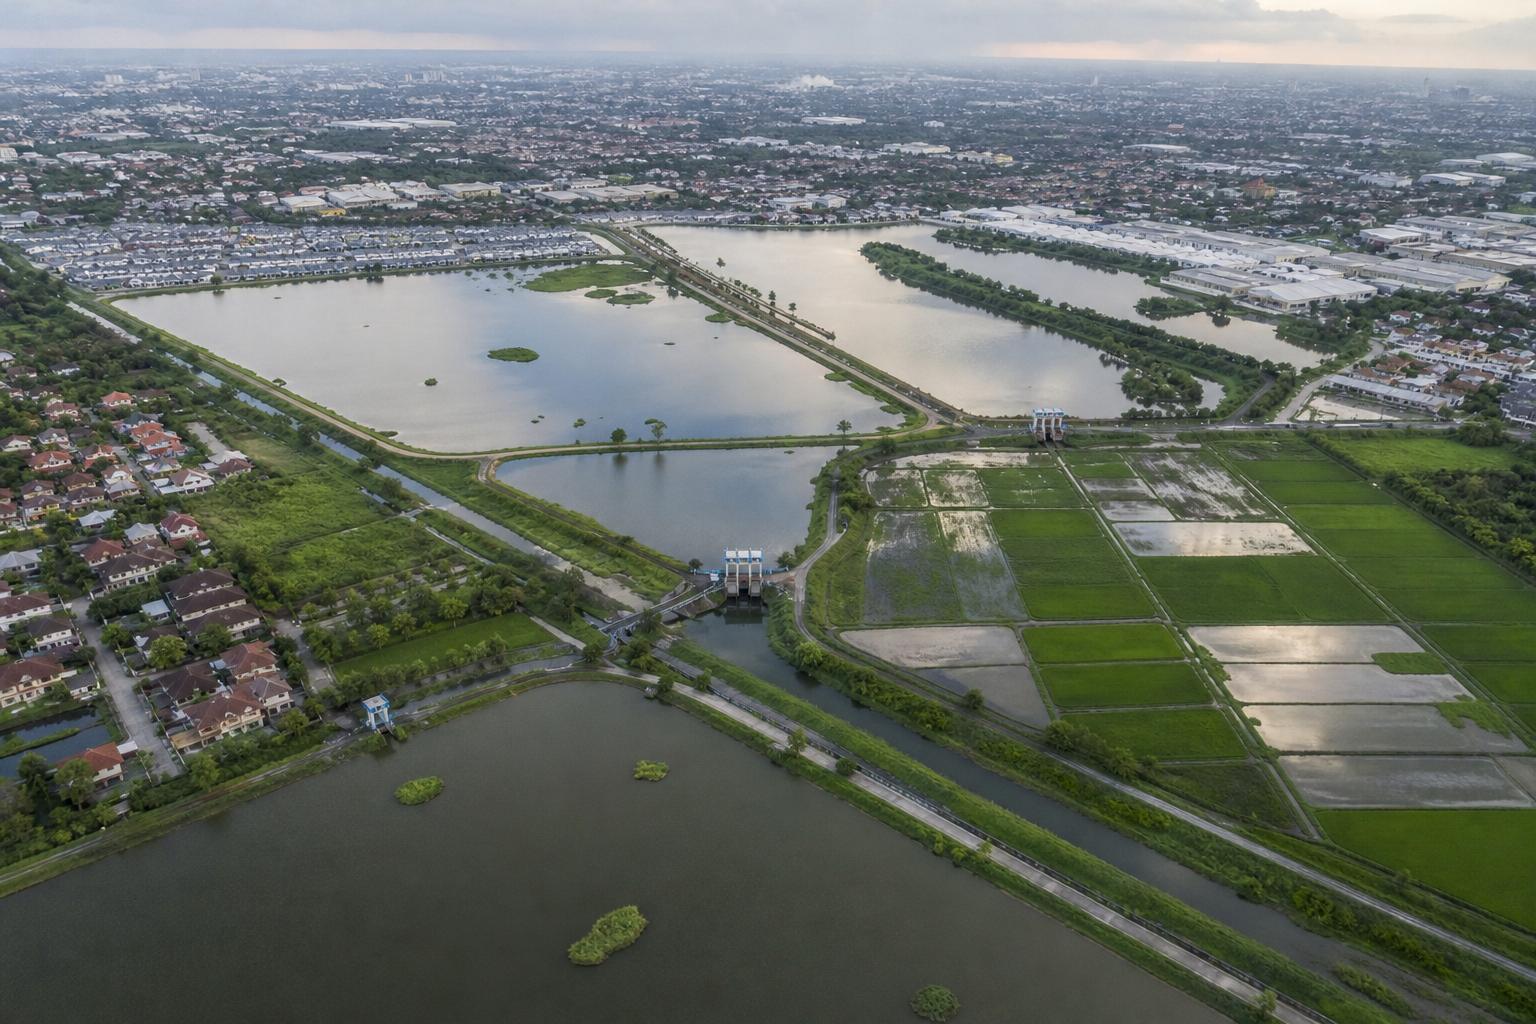
After Bangkok flooded in 1995, King Bhumibol proposed an idea named after a monkey storing bananas in its cheeks: kaem ling.
Ponds, lakes and canals take in floodwater when rain is heavy. Floodgates to the sea stay shut while the tide is high, and open when the sea drops below the water in the canals.
Watch the gate follow the tide, then add the monkey cheeks and see how much lower the river runs. The same idea now shapes parks built to hold rain.
Kaem ling Storage first, release later: the water is also kept for the dry season. AI-generated still.
heavy rain: canals and ponds fill
high tide: gates shut to keep the sea out
low tide: gates open, water drains
dry season: stored water is used
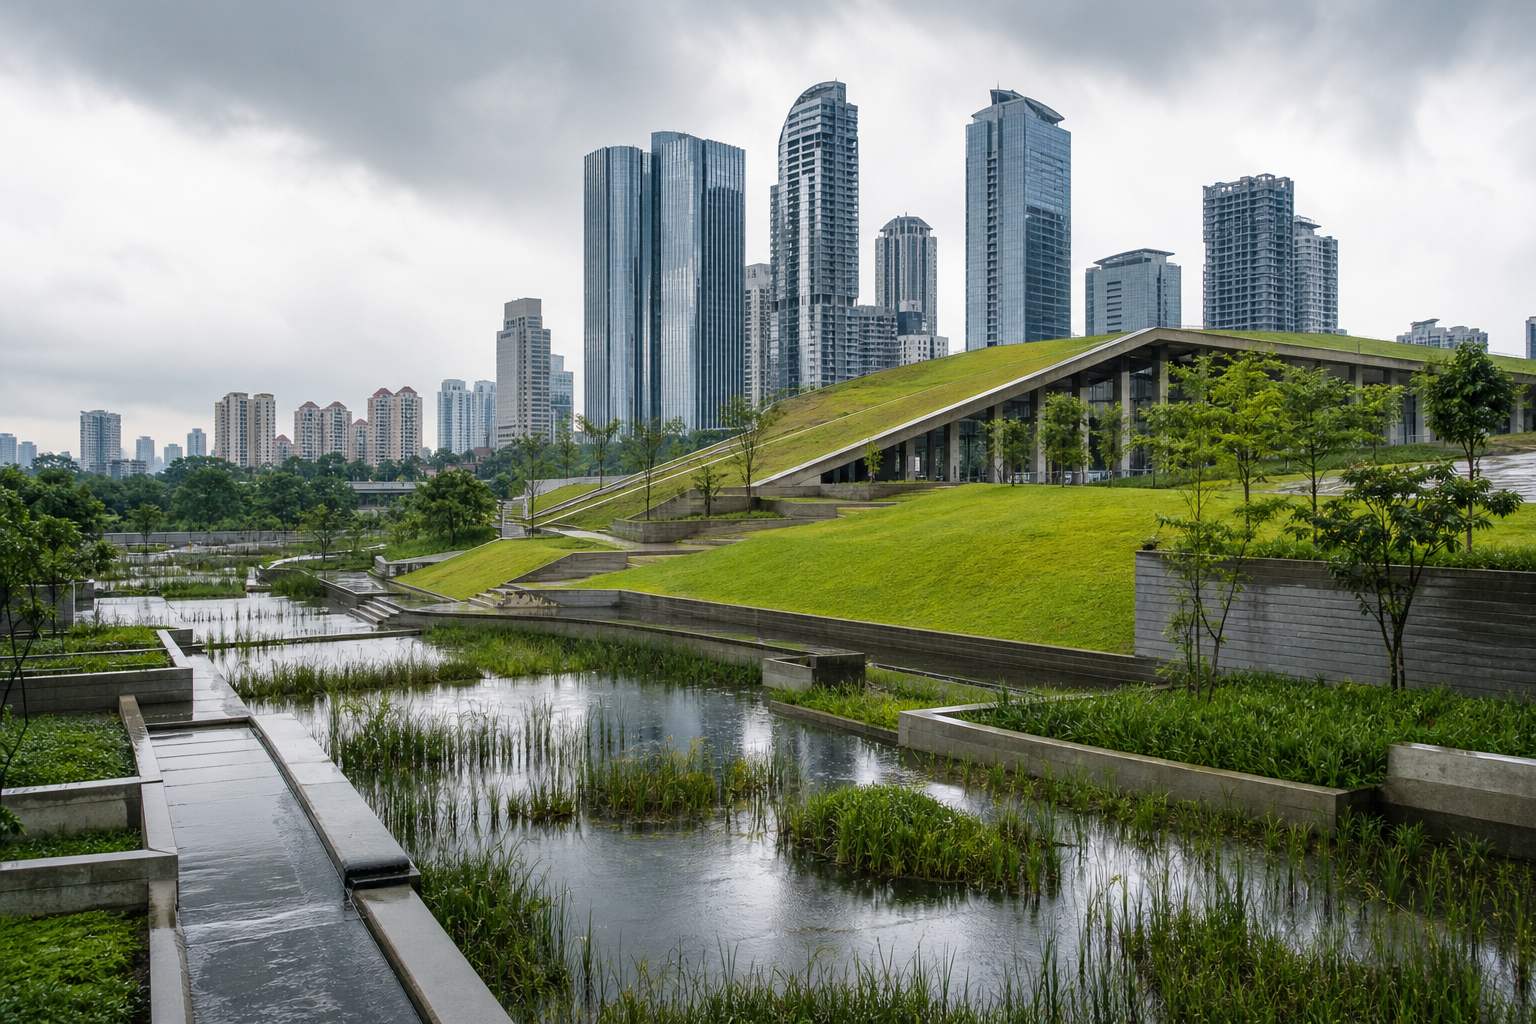
How a monkey cheek worksA park that holds rain Chulalongkorn University Centenary Park, by Kotchakorn Voraakhom, takes its idea from the monkey cheek. AI-generated illustration, not the real park.
Chapter VII · Living with water
Kaem ling
King Rama IX introduced the kaem ling (“monkey cheeks”) concept in 1995, when Bangkok faced a flooding crisis. Canals and ponds store excess water; floodgates open to release it to the sea when the sea is lower than the canals and close when the sea is higher. Stored water is used in the dry season.
In the model the ponds lower the river by a made-up amount; real benefits depend on how much storage there is.
Every link can be strengthened. None can be removed.
The floods of 2026 came at the peak of the rainy season, after Bangkok had a month of rain in a few days. Every link in this film decides how bad a year like that becomes.
None of these links can be removed. But each can be made stronger: by keeping room in reservoirs, leaving space for water, and building with the flood in mind.
The water that reaches the Gulf of Thailand tomorrow fell on the mountains weeks ago. Understanding the chain is how a country gets ready for it.
1964 Bhumibol Dam completed
1972 Sirikit Dam completed
1983 Floods in 42 provinces
1995 Bangkok floods; kaem ling proposed
2011 815 dead, US$46.5 bn damage
2026 71 dead in 51 provinces by 12 Oct
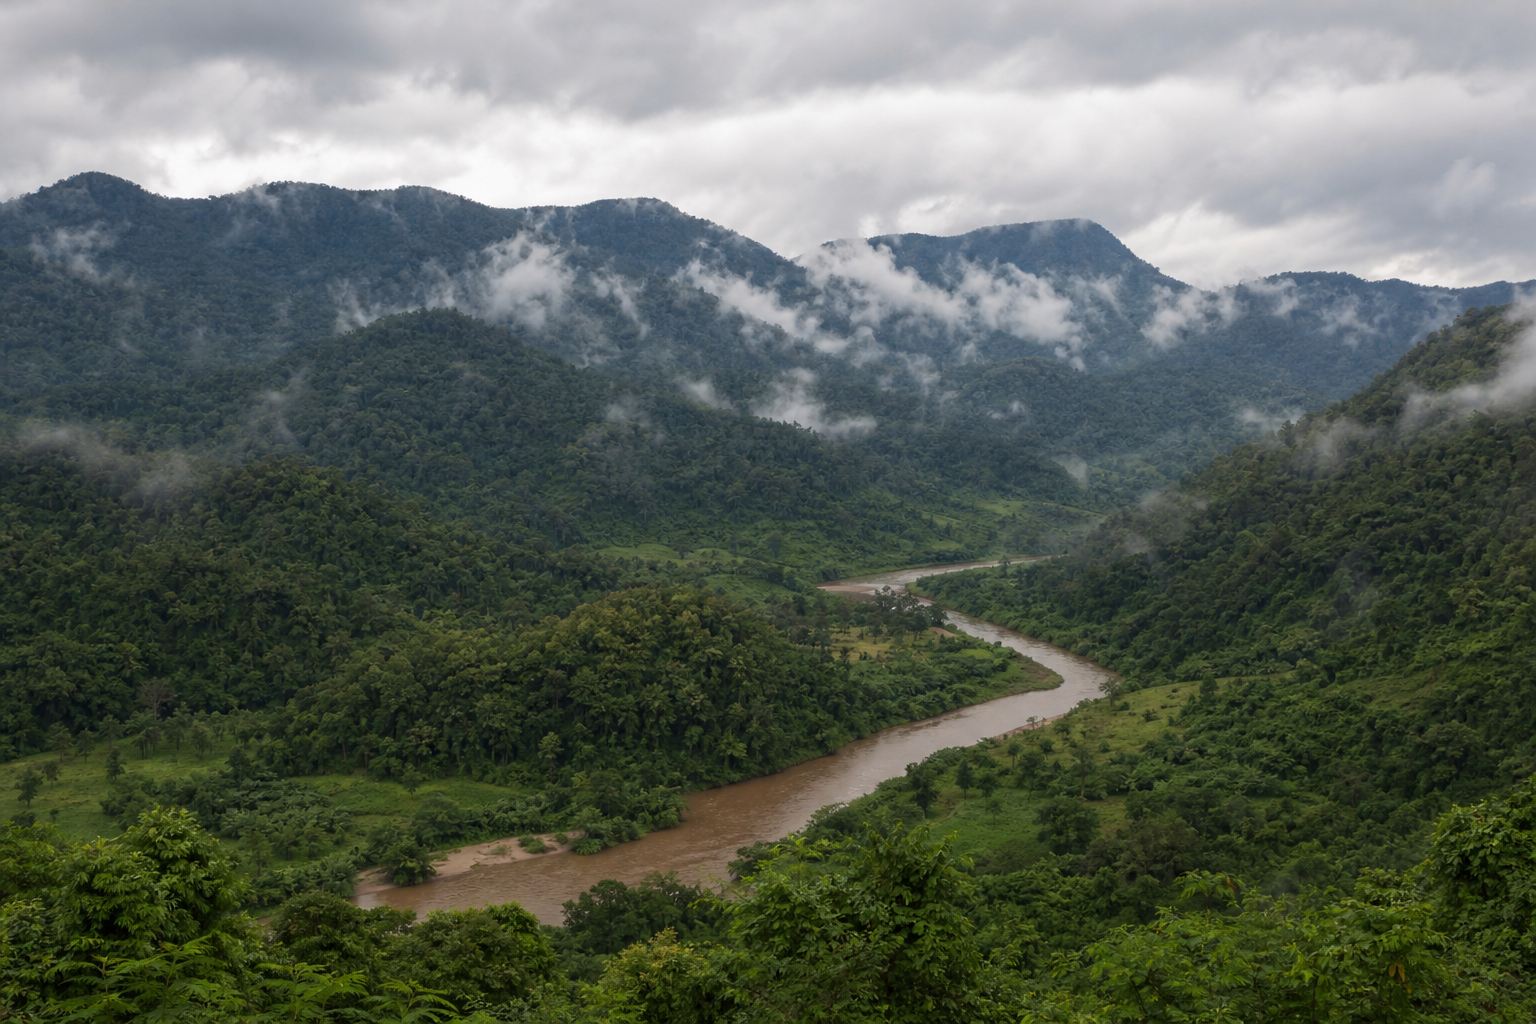
Floods and the basinWhere it begins Forests and soil in the headwaters hold back part of every storm. All stills in this film are AI-generated.
Rain in the north today is water in Bangkok in weeks.The lesson of the funnel
Epilogue · Sources
How river floods work
A river flood links weather, soil, the shape of a basin, human structures and the sea. This film used the Chao Phraya basin as its example; the same chain runs through every flood-prone river delta.
All interactive models are schematic, with illustrative numbers, and all stills are AI-generated. Figures for 2026 are provisional official counts as reported on 12 October 2026. This is general education, not flood-safety guidance: follow your local disaster agency.