In 2026 a British Antarctic Survey modelling study found that Thwaites Glacier would keep losing ice for at least 150 years even if ocean melting beneath it stopped, while neighbouring Pine Island Glacier would recover. To see why, this film explains ice on land: the two great ice sheets and how much sea level they hold, how snow becomes glacier ice, how ice flows by creeping and sliding, how floating ice shelves hold glaciers back like a cork, what happened when Larsen B collapsed, how warm deep water melts the shelves from below, why a bed that deepens inland can make a retreat feed itself, how satellites and tide gauges measure the rising sea, and what the IPCC projects for 2100 and beyond. Stack the ice sheets against a coastline, thaw a glacier's bed, pull out the cork, warm the ocean, tilt the bed and switch the ocean off.
Interactive 3D film10 min1901 to 2100Published 21 October 2026
Imagine you could switch off the warm sea water that is melting Thwaites, Antarctica's most feared glacier. Would it stop shrinking?
Thwaites is feared because, as glaciologists at the University of Washington put it, it acts as a linchpin for the rest of the West Antarctic Ice Sheet, which holds enough ice to raise the seas by over three metres.
Scientists at the British Antarctic Survey tried exactly that, in three computer models. Pine Island Glacier recovered. Thwaites Glacier kept losing ice for at least a hundred and fifty years.
It is one modelling study of an extreme case. But to see why a glacier could keep shrinking on its own, we need to understand ice on land.
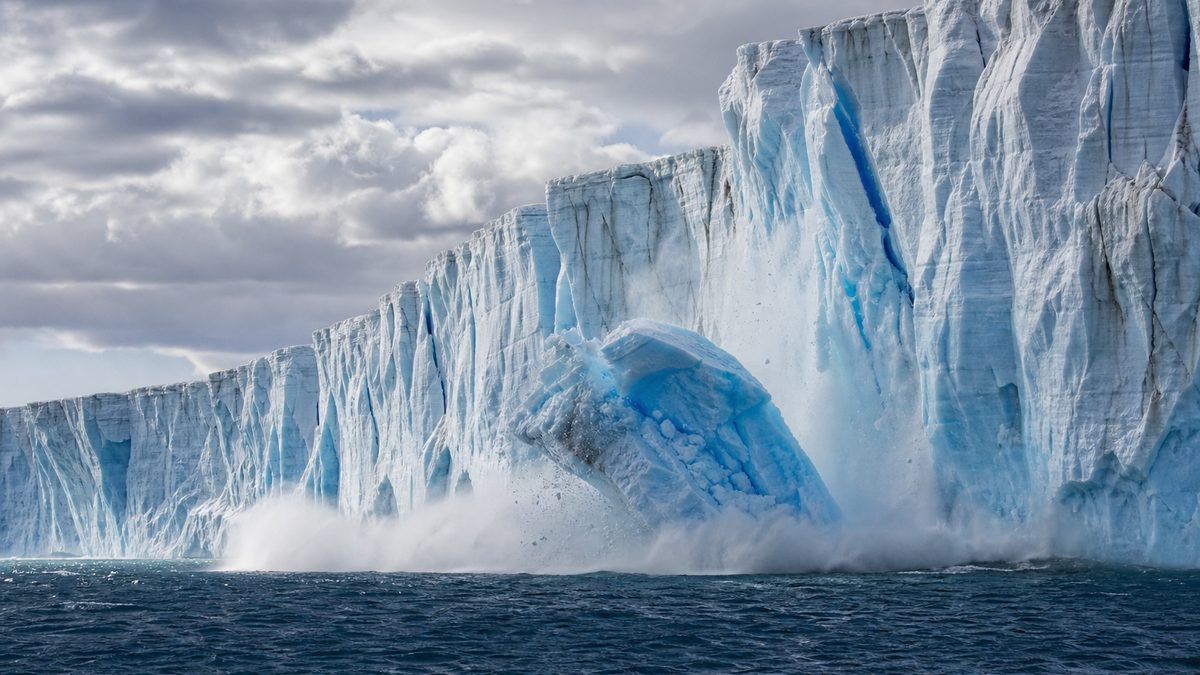
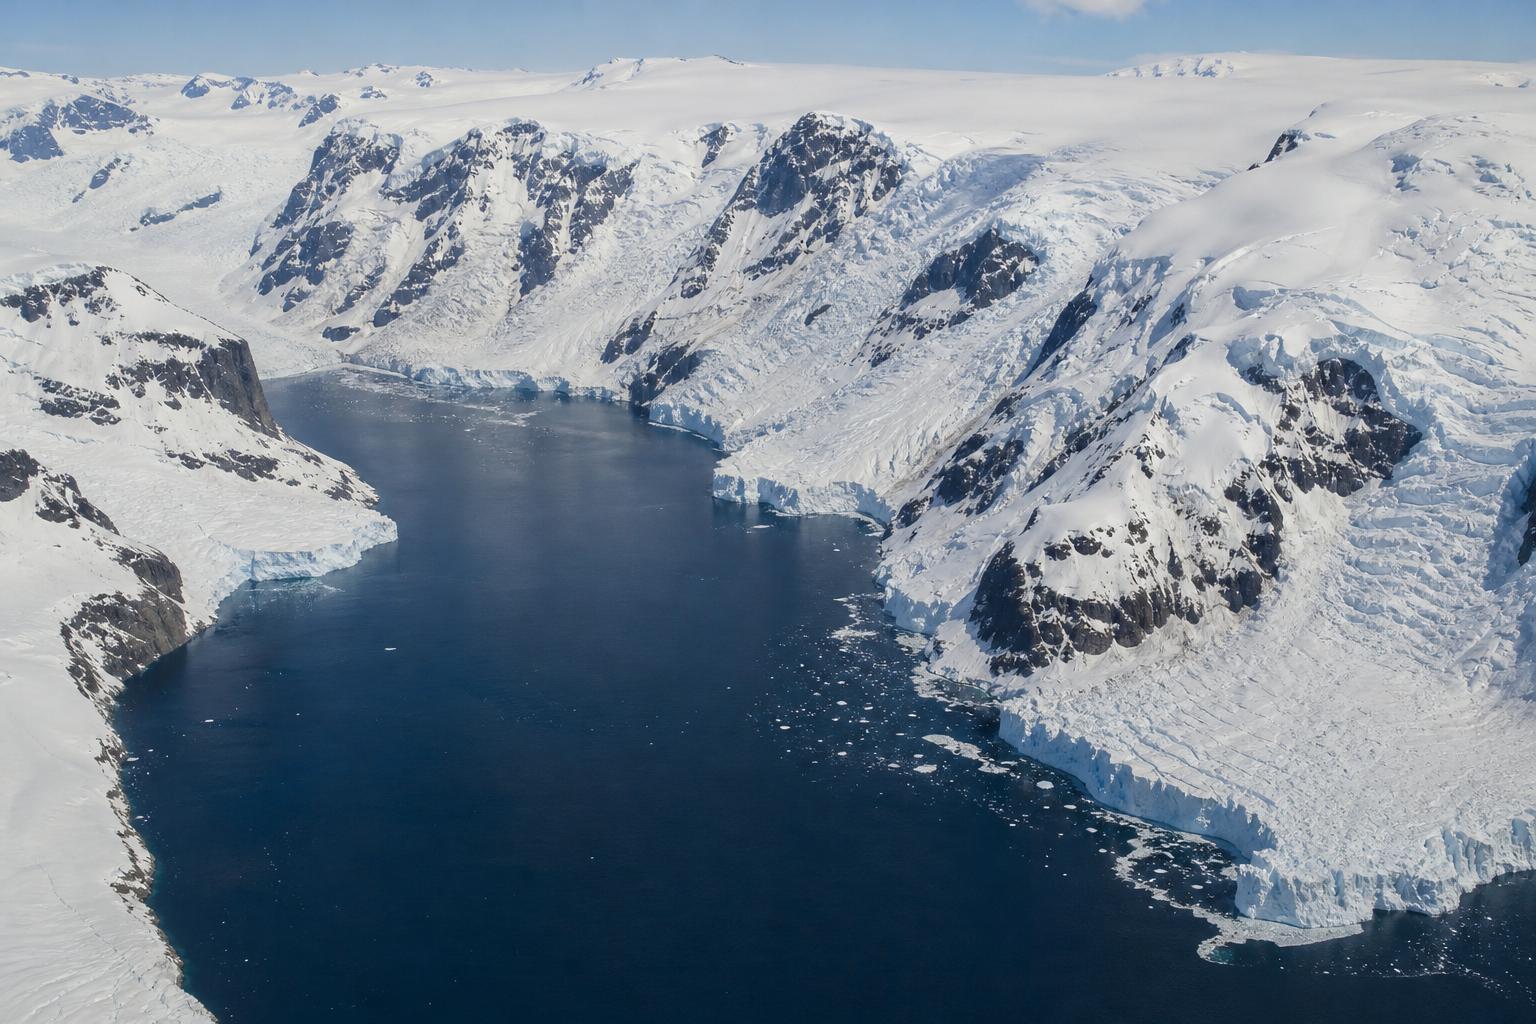
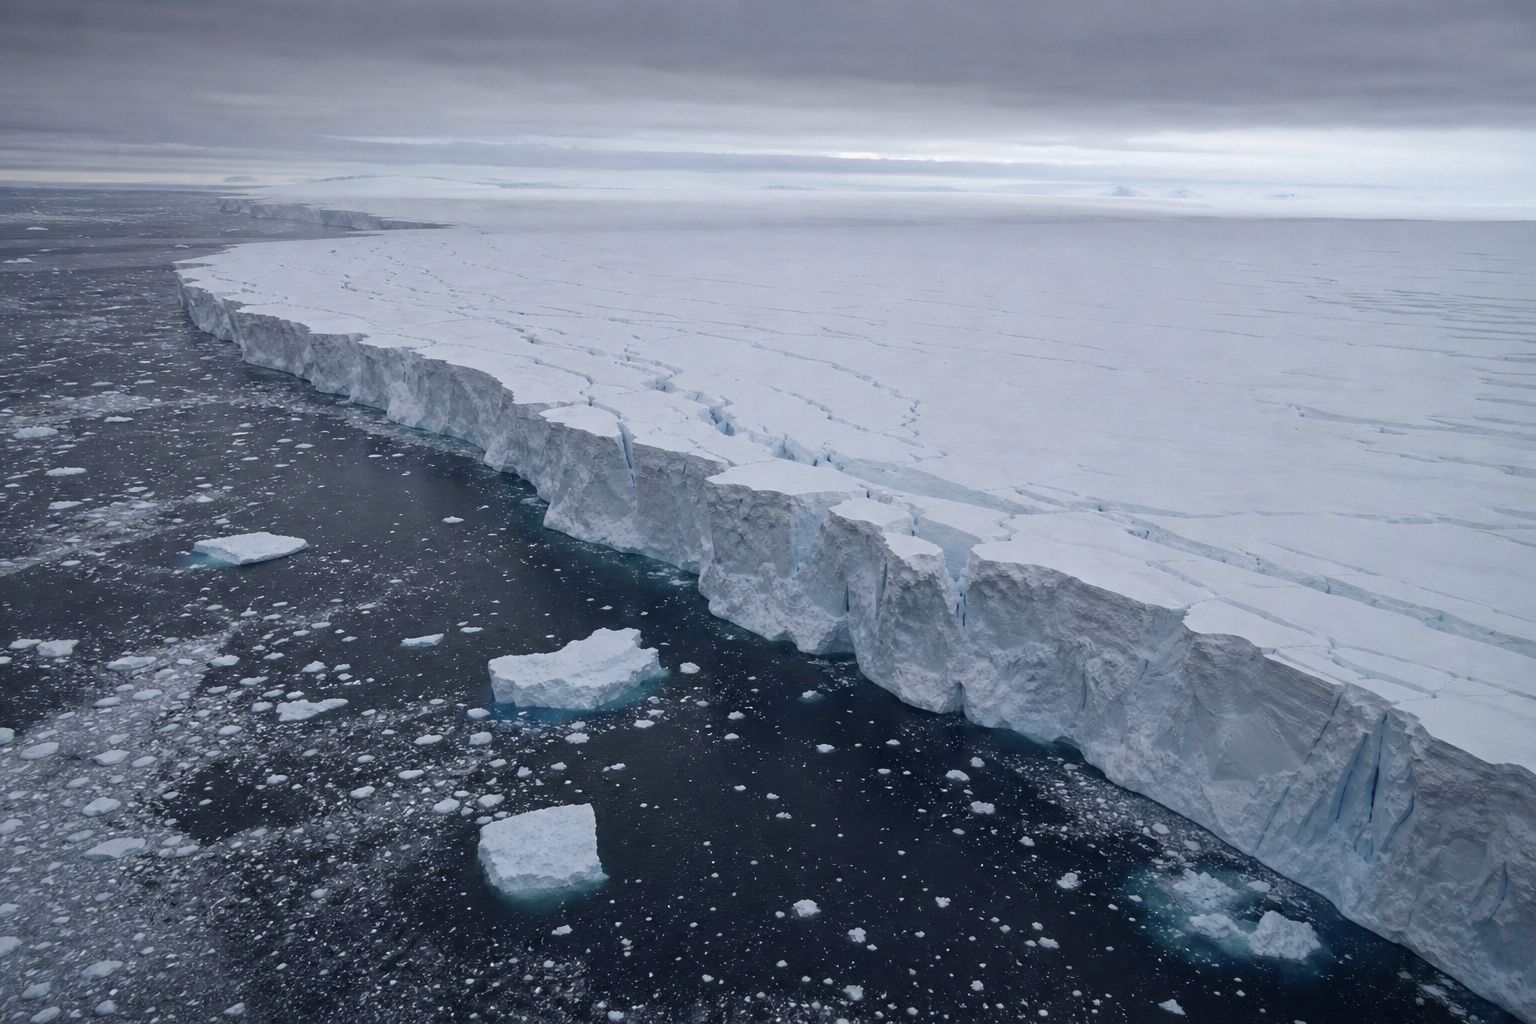
Where land ice meets the sea Thwaites ends in a floating front about 120 km wide, the widest of any glacier (ITGC). AI-generated image.
3.3 m
of sea level in its ice sheet (ITGC)
West Antarctica The smaller, western part of Antarctica’s ice, much of it resting on rock below sea level (AntarcticGlaciers.org).
3
independent ice-sheet models
150 yr
of continued loss at Thwaites, at a falling rate
Williams et al., Geophysical Research Letters, 2026
published online on 28 July 2026, reported widely in October
a test case: ocean melting set to zero
not a forecast of what will happen
What this result is, and is not
Prologue · The news
Thwaites without the ocean
In a paper in Geophysical Research Letters (published online 28 July 2026; reported by Euronews on 16 October), C. Rosie Williams of the British Antarctic Survey and colleagues switched off ocean-driven melting beneath Pine Island and Thwaites glaciers in three independent ice-sheet models, an extreme hypothetical case. Pine Island thickened and re-advanced to a prominent seabed ridge; Thwaites kept losing ice, at a decreasing rate, for 150 years. Euronews quotes Williams: past ocean-driven melting has “committed us to unavoidable future ice loss from Thwaites Glacier”. It is a single modelling study and is presented here as such.
Why Thwaites: a University of Washington news release (2014, on Joughin et al. in Science) says the glacier “acts as a linchpin on the rest of the ice sheet”, which could add 3 to 4 m of sea level; the International Thwaites Glacier Collaboration gives 3.3 m for the whole West Antarctic Ice Sheet, much of which rests on rock below sea level (AntarcticGlaciers.org).
How to use: pick a chapter or press ← →; drag to rotate. Several steps have buttons you can press.
The 3D slices, beds, water layers and moving dots are simplified teaching models: heights are exaggerated and nothing is to scale.
Floating ice barely matters to sea level. Ice on land does.
Sea ice already floats, so when it melts the sea barely changes. Ice on land is different. Earth has two ice sheets, vast domes of ice resting on land: Greenland and Antarctica.
Together they hold more than ninety-nine percent of the world's land ice, and over two-thirds of its fresh water.
If all of Greenland's ice melted, the US National Snow and Ice Data Center estimates, the oceans would rise by about seven point four metres; all of Antarctica's, about fifty-eight.
No projection sees anything like that this century. Press the buttons to stack them against a coast.
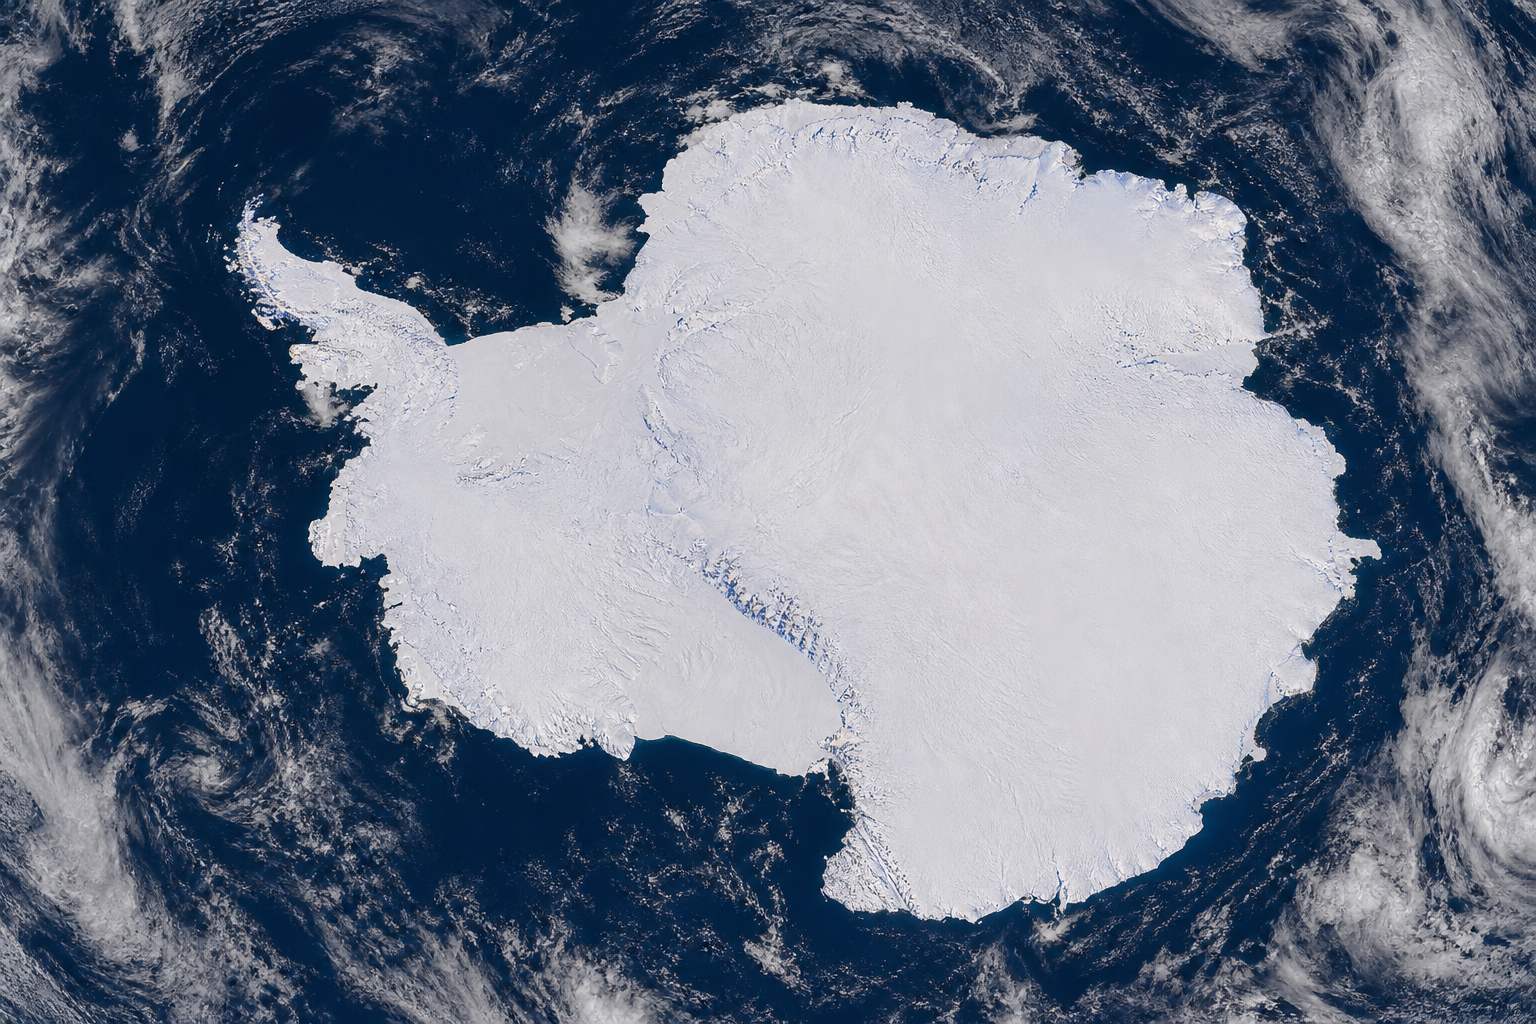
Antarctica Its ice sheet covers almost 14 million km² and is nearly 4.9 km thick at its thickest (NSIDC). AI-generated image.
>99%
of all land ice
>68%
of Earth’s fresh water
The two ice sheets (NSIDC) An ice sheet is land ice spread over more than 50,000 km².
Greenland
7.4 m
Antarctica
58 m
Sea level held in the ice, if all of it melted Greenland holds about 2.9 million km³ of ice, Antarctica about 30 million km³ (NSIDC).
3.3 m
the whole West Antarctic Ice Sheet
65 cm
Thwaites Glacier alone
Inside Antarctica’s 58 m (ITGC) Thwaites is one glacier of West Antarctica, and West Antarctica is one part of the continent’s ice.
Chapter I · Ice on land
Ice sheets
NSIDC defines an ice sheet as a mass of glacial land ice extending more than 50,000 km². The Antarctic ice sheet covers almost 14 million km², is nearly 4.9 km thick at its thickest and holds about 30 million km³ of ice: about 58 m of sea-level equivalent. The Greenland ice sheet covers 1.7 million km² (about 80% of Greenland), is over 3 km thick at its thickest and holds about 2.9 million km³: about 7.4 m. Together they contain more than 99% of the land ice and over 68% of Earth’s fresh water. The International Thwaites Glacier Collaboration gives 3.3 m for the whole West Antarctic Ice Sheet and 65 cm for Thwaites Glacier. Sea ice already floats, so its melting barely changes sea level (see our film on sea ice).
The coast, buildings and heights in the 3D scene are illustrative; full melting would take far longer than this century.
An ice sheet is built from snow. Where more falls each winter than melts each summer, the layers pile up, and each new year's weight presses on the years below.
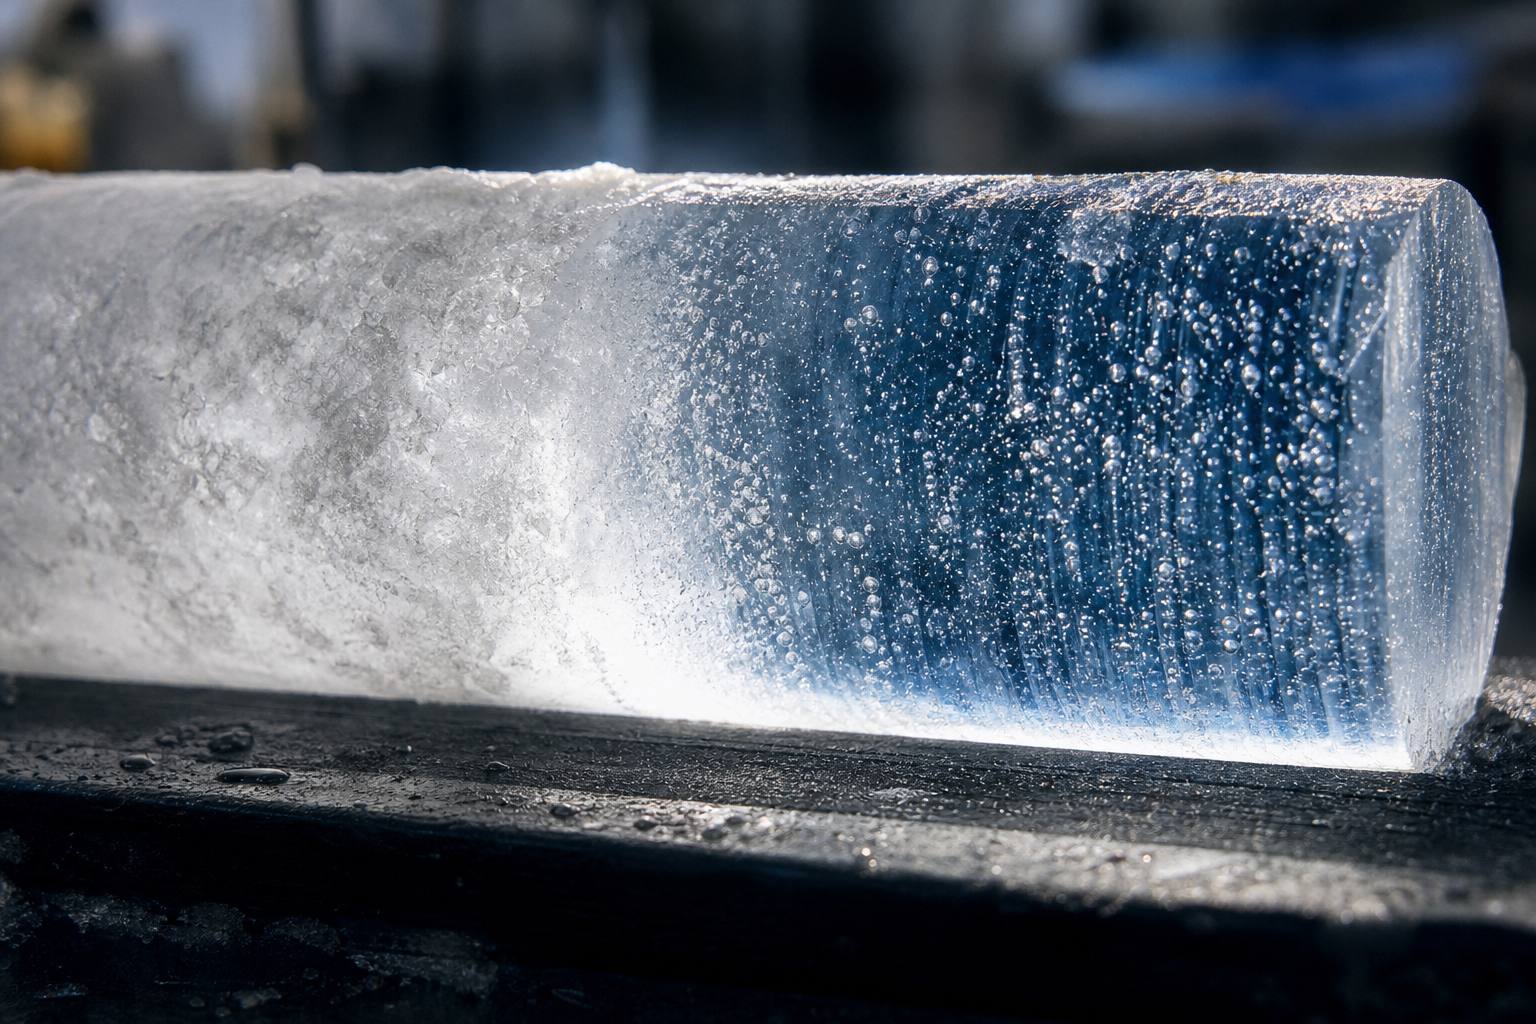
Fresh snow is mostly air. Squeezed, its grains grow and bond into firn, and deeper down into solid glacier ice, more than ten times denser than new snow.
In cold, dry East Antarctica this is slow: at Vostok station, firn turns to ice about ninety-five metres down, after some two and a half thousand years.
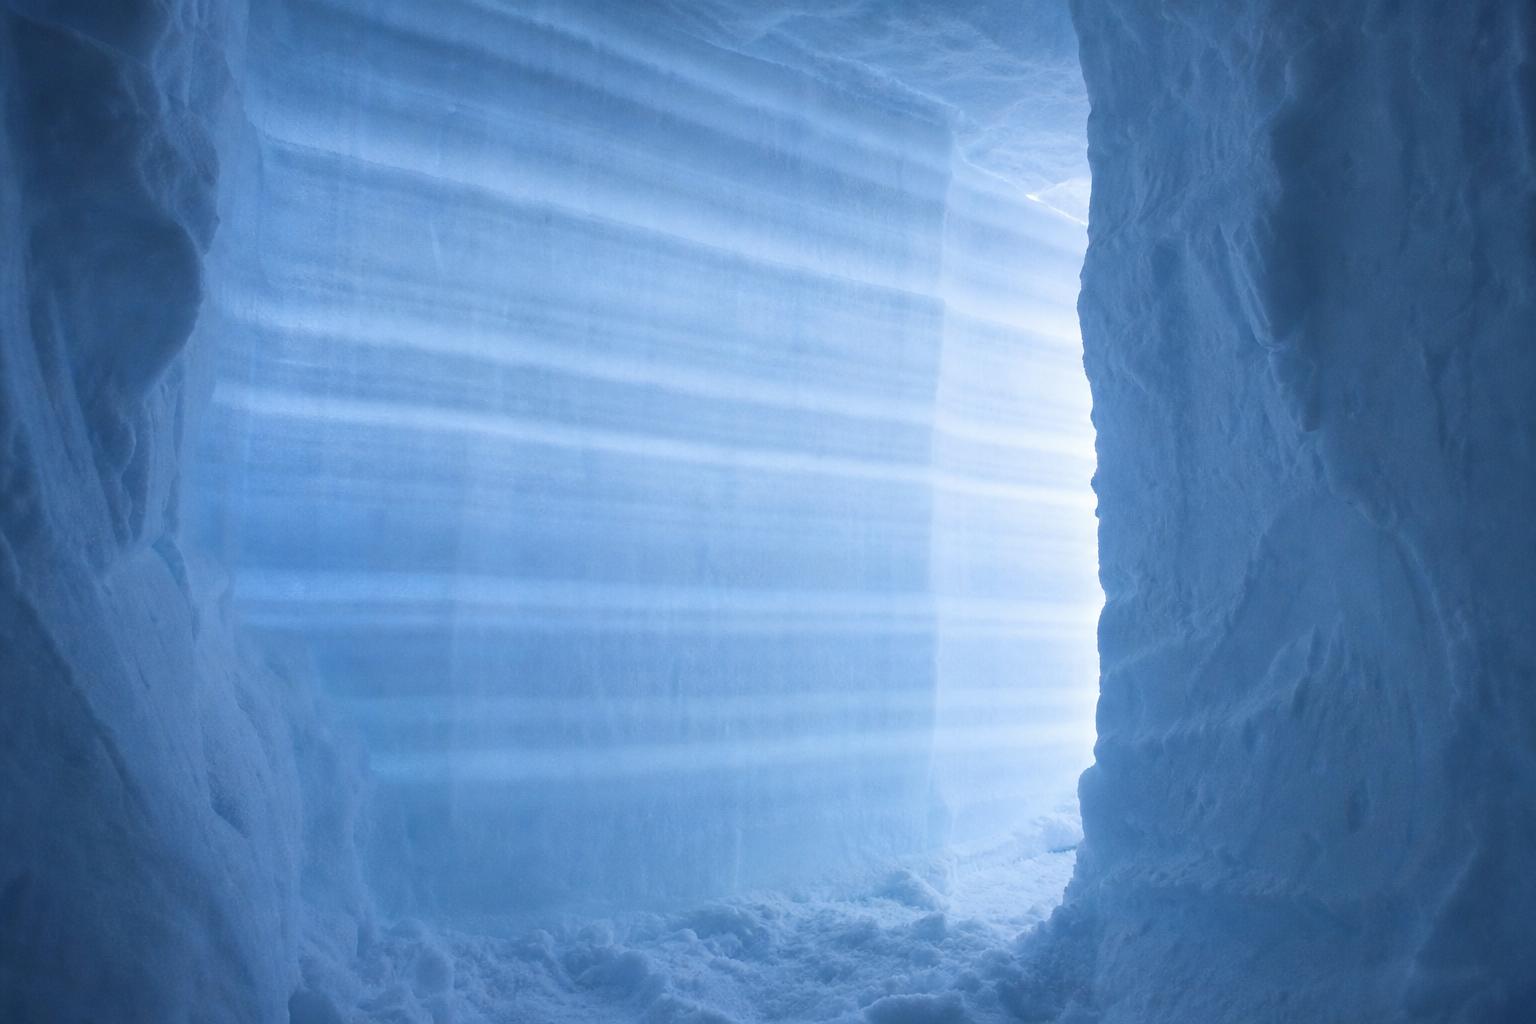
Layers in the snow Light shining through the wall of a snow pit picks out the layers left by past snowfalls. AI-generated image.
fresh snow
50–70
wind-packed snow
350–400
firn
400–830
glacier ice
830–923
Density (Cuffey & Paterson, via AntarcticGlaciers.org) Air passages close off at about 830 kg/m³: from there on it counts as glacier ice.
~2,500 yr
Vostok, East Antarctica · 95 m down
3–5 yr
Upper Seward Glacier, a milder site · 13 m down
How long firn takes to become ice A typical figure is 100–300 years and 50–80 m (AntarcticGlaciers.org).An ice core When the pores close, the last air is trapped as bubbles: ice cores keep them as samples of old atmosphere (AntarcticGlaciers.org). AI-generated image.
Chapter I · Ice on land
From snow to firn to glacier ice
NSIDC: snow that survives a melt season becomes firn, a denser, more compressed layer; later snowfall keeps compressing it, the grains grow into ice crystals, and air spaces shrink and become isolated bubbles. AntarcticGlaciers.org (after Cuffey and Paterson, 2010) gives densities of 50–70 kg/m³ for fresh snow in calm conditions, 400–830 kg/m³ for firn and 830–923 kg/m³ for glacier ice, usually taken as 917; pores close off at about 830 kg/m³. Firn becomes ice at about 95 m after about 2,500 years at Vostok, at 64 m after about 280 years at Byrd, and in 3–5 years at about 13 m on the Upper Seward Glacier in the St Elias Mountains; typically 100–300 years and 50–80 m. The air in the bubbles largely reflects the atmosphere when the ice formed, which is why ice cores are used to study past climate.
The column in the 3D scene is a schematic, not to scale.
Then the ice starts to move. Under its own weight, an ice sheet spreads outward, slowly but without stopping.
It moves in two ways. Deep inside, the ice crystals deform, which glaciologists call creep. And where the bed is wet, with meltwater or soft, soaked sediment, the whole glacier can also slide. Try a frozen and a wet bed.
At the edges, most ice leaves through fast outlets: glaciers, and ice streams, rivers of ice inside the sheet bordered by slower ice. Thwaites, near the sea, moves more than two kilometres a year.
creep: the weight above deforms the ice crystals
basal sliding: over a film of water or wet, soft sediment
Two ways ice moves (NSIDC)
10–20%
of the motion of thick, warm glaciers on gentle slopes
How much is sliding? (NSIDC)Crevasses Cracks open where fast-moving ice tears past slower ice at the edge of an ice stream. AI-generated image.
>2 km/yr
surface speed near where it meets the sea
Thwaites Glacier (ITGC) Ice streams are bordered by slower ice, not by rock (NSIDC).
Chapter I · Ice on land
How ice flows
NSIDC: ice sheets spread outward in broad domes under their own weight; near the coast most ice moves through faster outlets such as ice streams, glaciers and ice shelves. Glaciers move by creep, in which the weight of overlying ice deforms the ice, and by basal sliding on a thin layer of water (from pressure melting or meltwater reaching the base) or over water-saturated soft sediment. Sliding may account for most of the movement of thin, cold glaciers on steep slopes, but only 10–20% for warm, thick glaciers on gentle slopes; friction makes ice slower at the base than at the surface. Ice streams are large ribbon-like glaciers set within an ice sheet, bordered by slower ice rather than rock, and are highly sensitive to losing the ice shelves at their ends. ITGC: ice surface speeds on Thwaites exceed 2 km a year near where it reaches the sea.
The 3D slices, beds, water layers and moving dots are simplified teaching models: heights are exaggerated and nothing is to scale.
Around Antarctica, much of this ice does not stop at the shore. It flows out over the sea and floats, forming ice shelves that fringe about three-quarters of the coastline.
The place where the ice lifts off the seabed and starts to float is called the grounding line. The shelf beyond it is already afloat, so its melting adds almost nothing to the sea.
But shelves matter. Wedged into bays and snagged on bumps in the seabed, they push back on the ice behind them. This is called buttressing: the shelf works like a cork.
~75%
of the coastline fringed by shelves
up to ~2 km
thickness of the thickest
Antarctic ice shelves (AntarcticGlaciers.org) The Ross, Filchner and Ronne shelves make up two-thirds of the total shelf area (NASA JPL).
grounded ice: adds water as it flows past the grounding line
floating shelf: already displaces its own weight of water, like an ice cube melting in a glass that does not overflow
“An ice shelf itself does not contribute to sea-level rise” (NASA Earthdata)
Which ice counts for sea level?
Ice shelves buttress the glaciers behind them, modulating the speed at which these rivers of ice flow into the ocean.NASA Jet Propulsion Laboratory, 2013
Chapter II · The cork
Ice shelves and the grounding line
NSIDC: ice shelves are extensions of thick land ice that flow out over a cold coastal ocean; Antarctica has 15 major ice-shelf areas. AntarcticGlaciers.org: shelves fringe 75% of Antarctica’s coastline and can be up to 2,000 m thick. The EGU Cryospheric Sciences blog defines the grounding line as the boundary between the ice sheet sitting on land and the floating ice shelves. NASA Earthdata: “An ice shelf itself does not contribute to sea-level rise,” because it already floats; the concern is the glaciers behind it. NASA JPL (2013): “Ice shelves buttress the glaciers behind them”. Shelves confined in bays or pinned on bedrock highs push back on the ice sheet, which stabilises the grounding line.
The 3D slices, beds, water layers and moving dots are simplified teaching models: heights are exaggerated and nothing is to scale.
In 2002 the world saw what happens when the cork comes out. On the Antarctic Peninsula, the Larsen B ice shelf, some three thousand two hundred and fifty square kilometres, broke apart in just over a month.
That collapse by itself barely raised the sea. But the glaciers behind it sped up abruptly, by about three hundred percent on average, NASA reports, and thinned.
Their ice loss rose from two to four billion tonnes a year to as much as forty by 2006. Restore the shelf, then pull it out yourself, and watch the glacier respond.
3,250 km²
of ice shelf gone
~1 month
to break apart
Larsen B, 2002 (NASA Earth Observatory) Before it broke, the shelf pushed back against the glaciers feeding it and slowed them (NASA).
31 Jan first image of the sequence
17 Feb front has retreated about 10 km
7 Mar a mélange of slush and icebergs
Seen from orbit, 2002 (NASA)An empty bay In many summers since the collapse, the bay has been completely free of ice (NASA). AI-generated image.
1996–2000
2–4
2006
22–40
Ice lost by the glaciers behind Larsen A and B (NASA) Ranges, in billions of tonnes a year: 1996 and 2000 against 2006.
Chapter II · The cork
The collapse of Larsen B
NASA Earth Observatory: in the southern summer of 2002, satellite images from 31 January to 13 April show the Larsen B ice shelf retreating about 10 km by 17 February and breaking into a mélange of slush and icebergs by 7 March: about 3,250 km² lost in just over a month. The grounded part of the shelf had pushed back against the glaciers and slowed them; without it, the Larsen A and B glaciers “experienced an abrupt acceleration, about 300% on average”, and their mass loss rose from 2–4 billion tonnes a year (1996 and 2000) to 22–40 billion tonnes a year in 2006. NASA Earthdata (2007): the shelf’s collapse itself added no water to the ocean, because it was already floating; glaciers behind it thinned and retreated by kilometres.
The speed-up in the model is set to about four times, matching “about 300%”; real glaciers differed from one another.
The 3D slices, beds, water layers and moving dots are simplified teaching models: heights are exaggerated and nothing is to scale.
What is thinning the shelves today? Mostly the ocean. Around Antarctica flows Circumpolar Deep Water. It is warmer than the water above it, but saltier and so heavier, which keeps it down, hundreds of metres deep.
It is barely above zero, often only one or one and a half degrees, yet warm enough to melt ice. Along deep troughs in the seabed it reaches under the ice shelves of West Antarctica and melts them from below.
A 2013 study led by Eric Rignot found that melting from below caused fifty-five percent of Antarctic ice-shelf loss from 2003 to 2008. Try warming the deep water.
350–650 m
the warm, salty layer lies below this depth
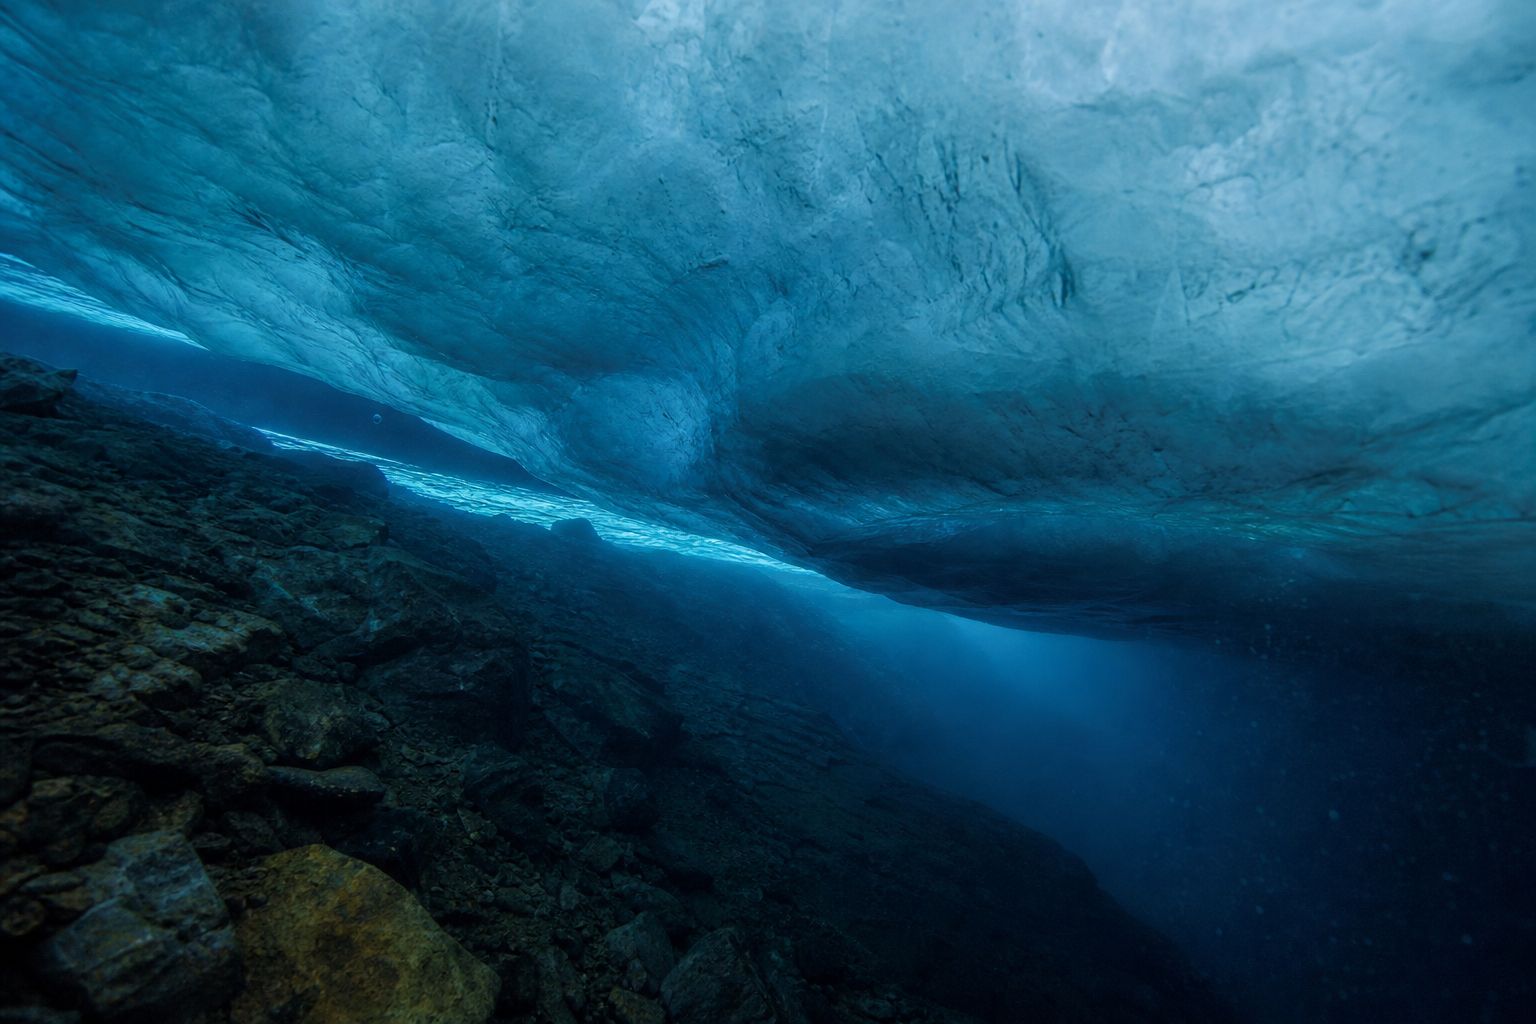
Off Pine Island Glacier (Mallett et al., 2018) Its warm core is typically above 0 °C, beneath a colder, fresher layer.Under a shelf The underside of a floating shelf, where the ocean melts it from below. AI-generated image.
up to 1.5 °C
deep water at the Getz Ice Shelf front
+0.1 °C
per decade since 1975, around most of Antarctica
How warm, and warming Assmann et al. 2019 (Eos); Schmidtko et al. 2014 (National Geographic).
…mainly induced by ice-shelf basal melt (high confidence)IPCC AR6, Chapter 9, on West Antarctica’s outlet glaciers
Chapter III · Melting from below
Circumpolar Deep Water
Mallett et al. (Geophysical Research Letters, 2018) describe warm, saline Circumpolar Deep Water crossing the continental shelf toward West Antarctic ice shelves, with a subsurface temperature maximum typically above 0 °C, flowing beneath the thermocline at 350–650 m and entering the Pine Island ice-shelf cavity. Eos (2019), reporting Assmann et al., describes undiluted deep water up to 1.5 °C reaching the Getz Ice Shelf front through the Siple Trough. National Geographic (2014), reporting Schmidtko et al. in Science: this deep water has warmed by roughly 0.1 °C per decade since 1975 around most of Antarctica and has risen toward the surface in places. NASA JPL (2013): basal melt accounted for 55% of all Antarctic ice-shelf mass loss from 2003 to 2008 (Rignot et al., Science). IPCC AR6: the mass losses from West Antarctica’s outlet glaciers “were mainly induced by ice-shelf basal melt (high confidence)”.
The orange layer and its buttons are a toy model: they show the direction of the effect, not real melt rates.
The 3D slices, beds, water layers and moving dots are simplified teaching models: heights are exaggerated and nothing is to scale.
Now the most important shape in this story: the ground under the ice. The West Antarctic Ice Sheet rests on rock below sea level, and in many places that bed gets deeper inland.
At the grounding line, the thicker the ice, the more of it flows out. And ice resting on a deeper bed must be thicker, or it would float. So if the line is pushed back into deeper water, the ice there is thicker, more of it flows out, and the line retreats further still.
This feedback is called marine ice-sheet instability, worked out in theory from Weertman's work in 1974 onward. The retreat stops only where the bed rises again, or a shelf holds it back.
Tilt the bed and nudge the ice.
The grounding zone Where the base of the ice meets a seabed that slopes down into deeper water. AI-generated image.
1 · the line steps back into deeper water
2 · the ice there is thicker
3 · more ice crosses the line each year
4 · back to 1, until the bed rises again
A loop that feeds itself (schematic)
1974 Weertman: outflow at the line depends on ice thickness
2007 Schoof refines the grounding-line theory
Theory, then Thwaites
200–1,000+ yr
fastest to slowest scenario
200–500 yr
most likely
One 2014 model study of Thwaites (Joughin et al.) It found the collapse “appears to have already begun”; the timescales are model results.
Chapter III · Melting from below
Marine ice-sheet instability
AntarcticGlaciers.org: the West Antarctic Ice Sheet is grounded below sea level, and the grounding lines of its main ice streams sit on a reverse slope, with the bed becoming deeper inland. The EGU Cryospheric Sciences blog (2016), citing Weertman (1974) and Schoof (2007): ice flux at the grounding line depends strongly on the ice thickness there, so on a bed that deepens inland a retreating grounding line meets thicker ice, more ice flows out, and the line retreats again; “the retreat only stops once a new stable position is reached”. Ice shelves that are laterally confined or pinned on bedrock highs transmit a back force, the buttressing effect, which can stabilise the grounding line even on such a slope. University of Washington (2014), on Joughin et al. in Science: modelling suggested collapse of Thwaites “appears to have already begun”, with the fastest scenario taking about 200 years, the slowest more than 1,000, most likely 200–500. That timescale is one study’s model result.
In the toy model, outflow rises with the cube of the ice thickness at the line; real theory uses a similar steep dependence, and real beds are far more complex.
The 3D slices, beds, water layers and moving dots are simplified teaching models: heights are exaggerated and nothing is to scale.
Thwaites sits on just such a bed. About a hundred and twenty kilometres wide, it is the widest glacier on Earth, and it drains a basin of a hundred and ninety-two thousand square kilometres.
Its own ice could raise sea level by about sixty-five centimetres, before counting the ice it holds back. Today it supplies about four percent of global sea-level rise.
The retreat is not new. In the 1940s, the shelves of Thwaites and Pine Island came loose from the seabed ridges that pinned them, and the modern retreat began.
The Thwaites research collaboration links the timing to a strong El Niño event. Warmer deep water has been the main driver since. Pin and unpin the shelf yourself.
~120 km
wide
192,000 km²
drainage basin
Thwaites Glacier (ITGC) At its grounding line the glacier is 800–1,200 m deep.
65 cm
of sea level if it all collapsed
~4%
of today’s global rise
What is at stake (ITGC) Ice loss from Thwaites and its neighbours has doubled over the last 30 years.
1940s shelves come off their seabed ridges
1947 its ice tongue first mapped
1990s–2010s outflow from Thwaites and neighbours more than doubles
2018 UK and US launch the International Thwaites Glacier Collaboration
2020s eastern ice shelf likely to break up within a decade
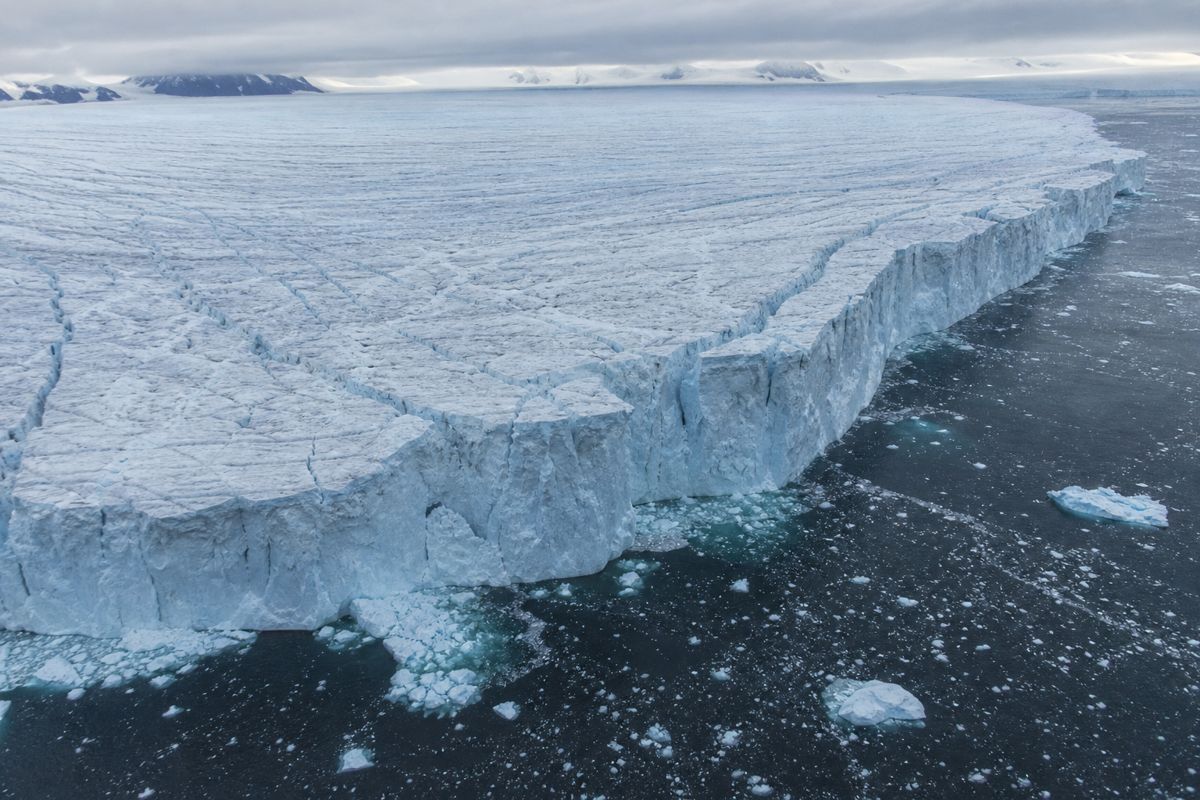
Thwaites through timeA broken front Rifts cut across the floating front of a West Antarctic glacier. AI-generated image.
Chapter IV · The widest glacier
Thwaites Glacier
International Thwaites Glacier Collaboration (ITGC): Thwaites is the widest glacier on Earth at about 120 km, drains a basin of 192,000 km², is 800–1,200 m deep at its grounding line, flows at more than 2 km a year near it, would raise sea level by 65 cm if it collapsed entirely, currently contributes about 4% of global sea-level rise, and its ice loss (with its neighbours) has doubled over the last 30 years. It is named after the glacial geologist Fredrik T. Thwaites (1883–1961). ITGC findings (Sept 2025): the ice shelves of Thwaites and Pine Island detached from seabed ridges (“pinning points”) in the 1940s, initiating the modern retreat; a strong El Niño event probably influenced the timing; and increases in warm water at depth since the mid-20th century have been the main driver; warm water continues to melt the glacier’s front and underside; the Thwaites Eastern Ice Shelf, about half of the 120 km front, is likely to break up within a decade, though that is not expected to cause a sudden large acceleration. The ITGC began in 2018 as a UK–US partnership. The University of Washington (2014) called Thwaites a linchpin on the rest of the ice sheet. PA Media (2024) reported that flow from Thwaites and its neighbours more than doubled between the 1990s and 2010s.
The 3D slices, beds, water layers and moving dots are simplified teaching models: heights are exaggerated and nothing is to scale.
Two glaciers, the same experiment, different answers.
Back to this year's study. Rosie Williams, Paul Holland and colleagues switched off ocean melting beneath Pine Island and Thwaites, an extreme test, since real seawater always melts some ice.
Pine Island thickened and crept forward again, back onto the seabed ridge it rested on before 1940: a high point close by to settle on. Its retreat, the models suggest, was largely the ocean's doing.
Thwaites, whose bed deepens inland like the slope in our toy model, did not recover. It kept losing ice for a hundred and fifty years, more and more slowly. The authors call this committed loss: past melting set off a retreat that cooling the ocean alone cannot undo.
Compare them yourself.
Running the experiment Ice-sheet models solve the physics of flowing ice on supercomputers; this study used three of them. AI-generated image.
Pine Island: thickens and re-advances to the seabed ridge
Thwaites: keeps losing ice for 150 years, at a falling rate
Ocean melting set to zero (Williams et al., 2026)
This ice loss cannot be undone or prevented by simply cooling the ocean.Rosie Williams, British Antarctic Survey, to Euronews
not a forecast, and not a date for collapse
not that emissions do not matter: more warming would add to the loss (Euronews)
only two glaciers were tested
What the study does not say
Chapter V · Committed
Committed ice loss
Williams et al. (Geophysical Research Letters, 2026) ran three ice-sheet models with ocean-driven melting switched off beneath Pine Island and Thwaites. Pine Island responded by thickening and re-advancing to the prominent seabed ridge it rested on before 1940, suggesting its retreat is largely tied to ocean warming. The study’s abstract does not name a single mechanism for Thwaites; ITGC notes that Thwaites rests on a bed far below sea level that deepens towards the interior. Thwaites continued to lose ice, at a decreasing rate, for 150 years despite the absence of ocean melting, meaning part of its current loss is a lasting response to a past disturbance; cooling the ocean alone would not stop it losing mass over the next century or so. Euronews notes that zero melting could never happen in reality and quotes Paul Holland: “We don’t yet know if Antarctica’s other major glaciers are moving into a state of committed change,” adding that ice loss would worsen if greenhouse-gas emissions are not cut. A separate study reported by CNN on 15 October 2026 (Poinelli, Rignot and colleagues, Nature Communications) suggests Thwaites may be melting faster than previously projected; scientists not involved said more research is needed. Both are recent single studies.
The 3D scene is a cartoon of the result, not the study’s models: Pine Island advances to its ridge, Thwaites keeps retreating more and more slowly.
How do we know the sea is rising? For about two centuries, tide gauges in harbours have recorded local water levels. Since the early 1990s, satellites have timed radar pulses bounced off the sea to map the height of most of the ocean.
The IPCC, the UN's climate science panel, puts the global rise at about twenty centimetres between 1901 and 2018. NASA's satellites show about ten centimetres since 1993 alone, and the yearly rate has more than doubled.
Over the last century, two things did most of it: seawater expanding as it warms, called thermal expansion, and melting glaciers outside the ice sheets. Since about 2006, melting land ice has been the biggest source.
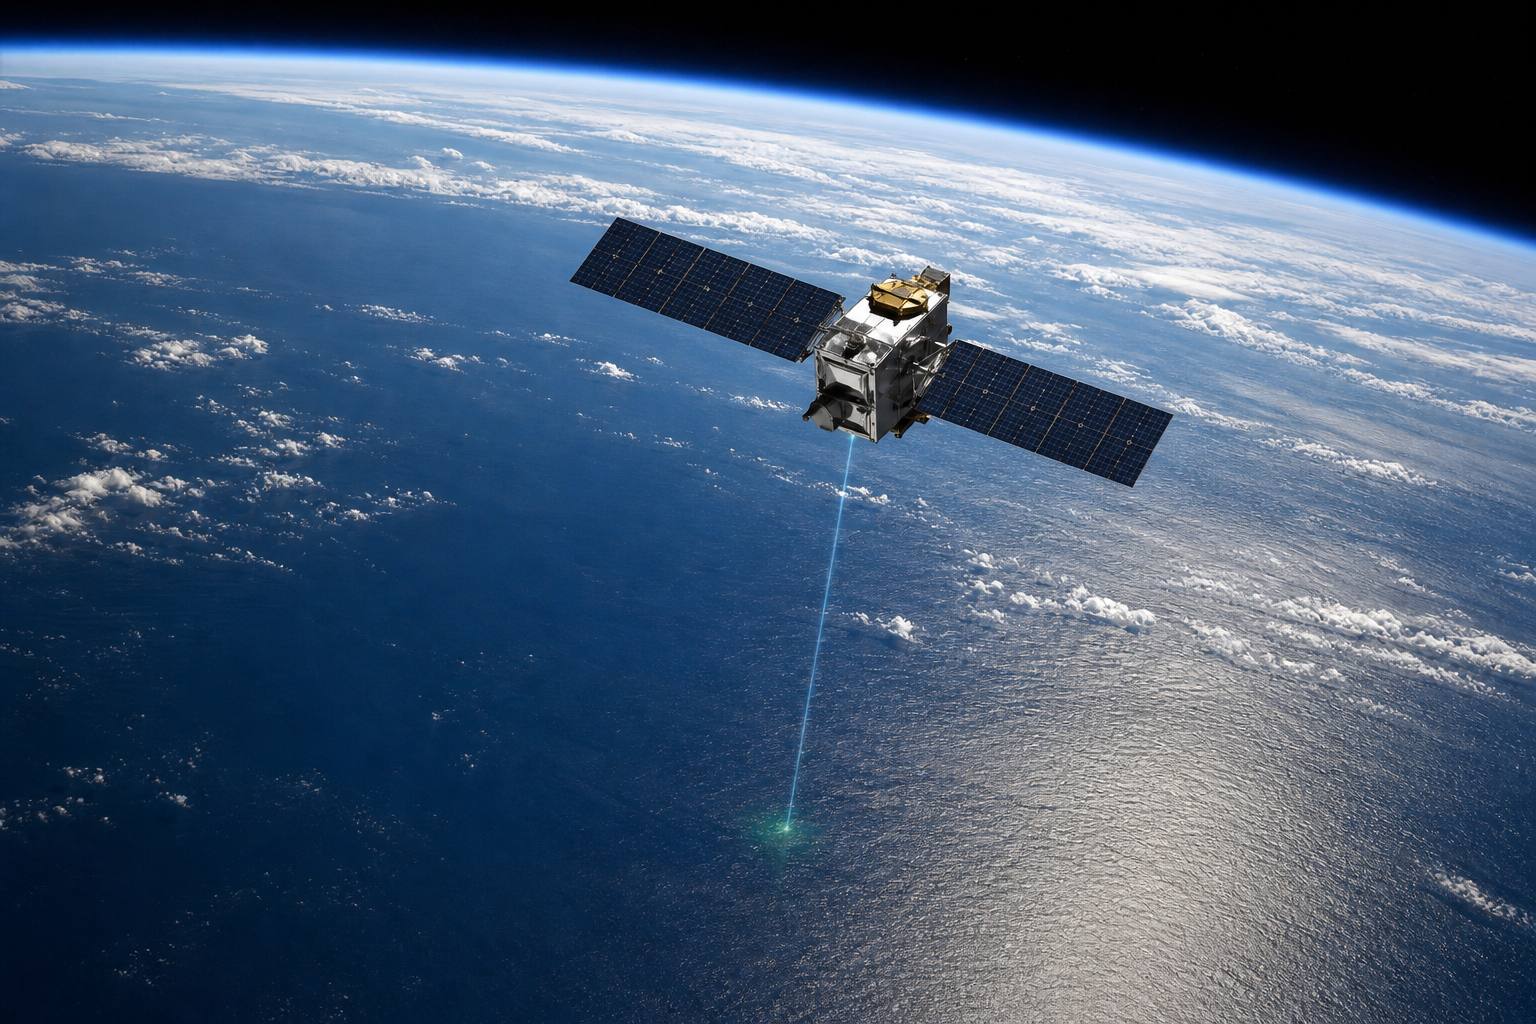
A radar altimeter TOPEX/Poseidon, launched in 1992, began the record; the corrected height is good to about 2 cm (Penn State). AI-generated image.
97.8 mm
global rise, 1993 to the latest data
2 → 4.4 mm/yr
rate in 1993, and now
The satellite era (NASA)
1901–1971
1.3
1971–2018
2.3
2006–2018
3.7
Average rate of global rise (IPCC AR6) Likely ranges: 1.6–3.1 mm a year for 1971–2018 and 3.2–4.2 for 2006–2018.
glaciers
41%
warming water expanding
38%
the rest, incl. ice sheets
~21%
Share of the rise, 1901–2018 (IPCC AR6) In 2024, unusually, two-thirds of the year’s rise came from warming water (NASA).
Chapter VI · A rising sea
How sea level is measured, and what raises it
Penn State (EARTH 107): tide gauges have about a 200-year history and record local water levels averaged over the tides; satellite altimetry began in earnest with TOPEX/Poseidon in 1992, sending rapid microwave pulses (about 1,700 a second) to the sea and timing their return, with GPS tracking the satellite; the corrected range is accurate to about 2 cm. NASA: global mean sea level has risen 97.8 mm since 1993 (about 10 cm), and the rate rose from about 0.20 cm a year in 1993 to about 0.44 cm a year. IPCC AR6, Chapter 9: global mean sea level rose 0.20 [0.15–0.25] m over 1901–2018; the rate was 1.3 mm a year over 1901–1971, 2.3 [1.6–3.1] over 1971–2018 and 3.7 [3.2–4.2] over 2006–2018; ocean thermal expansion (38%) and glacier mass loss (41%) dominate the change from 1901 to 2018; over 2006–2018 the loss of land ice (glaciers and ice sheets) was the largest contributor (high confidence), and Greenland and Antarctica together contributed four times more in 2010–2019 than in 1992–1999. NASA (2025): in 2024 about two-thirds of the rise came from thermal expansion, the reverse of recent years. Since 2002 the GRACE satellites have weighed the ice sheets through gravity: about 118 billion tonnes a year lost from Antarctica and about 281 from Greenland (NASA JPL).
In the 3D scene the water rises by the IPCC’s average rates; the ruler is in centimetres. Glaciers here means all glaciers outside the two ice sheets.
What the IPCC projects, and what it cannot rule out.
So what comes next? By 2100, the IPCC projects the global sea about thirty-eight centimetres higher than around the turn of this century if emissions fall very fast, and about seventy-seven if they stay very high.
Those ranges leave out ice-sheet processes that are still poorly understood. With very high emissions, a rise approaching two metres by 2100 cannot be ruled out, though it is judged unlikely. One idea behind it, collapsing ice cliffs, is still debated.
And the sea will not stop in 2100. It will keep rising for centuries and stay high for thousands of years.
The IPCC estimates that if warming peaks at two degrees above pre-industrial levels, the sea is committed to rise about two to six metres over two thousand years.
very low emissions (SSP1-1.9)
0.38 m (0.28–0.55)
very high emissions (SSP5-8.5)
0.77 m (0.63–1.01)
Projected rise by 2100, vs 1995–2014 (IPCC AR6) Likely ranges in brackets. A low-emissions path (SSP1-2.6) gives 0.44 m (0.32–0.62).
approaching 2 m by 2100 and 5 m by 2150 under very high emissions: “cannot be ruled out”
a low-likelihood, high-impact storyline, set by deep uncertainty about ice sheets
Outside the likely range (IPCC AR6)
low
confidence in marine ice-cliff instability
Collapsing ice cliffs (IPCC AR6) Including it, the IPCC gives up to 16 m by 2300 under very high emissions.
2–6 m
with 2 °C of peak warming
4–10 m
with 3 °C
Committed rise over 2,000 years (IPCC AR6) Medium agreement, limited evidence. Sea level stays high for thousands of years (high confidence).
Chapter VI · A rising sea
Projections, and the long tail
IPCC AR6, Chapter 9: global mean sea level will continue to rise until at least 2100 (virtually certain); by 2100, relative to 1995–2014, it is projected to rise 0.38 [0.28–0.55] m under SSP1-1.9 and 0.77 [0.63–1.01] m under SSP5-8.5 (UNDRR adds 0.44 [0.32–0.62] m under SSP1-2.6). These likely ranges do not include ice-sheet processes characterised by deep uncertainty; in a low-likelihood, high-impact storyline under high emissions, marine ice-sheet and ice-cliff instability could add more than one metre by 2100, and a rise approaching 2 m by 2100 and 5 m by 2150 “cannot be ruled out” (as summarised by RealClimate). Considering marine ice-cliff instability, the IPCC gives up to 16 m by 2300 under SSP5-8.5, with low confidence. Sea level will remain elevated for thousands of years (high confidence); committed rise over 2,000 years is about 2–6 m with 2 °C of peak warming and 4–10 m with 3 °C (medium agreement, limited evidence). ITGC (2025): fast-retreating ice cliffs at Thwaites are a real process but modelling indicates it will not always be sustained.
All figures on this step are projections, not measurements. The ruler shows metres above the 1995–2014 average; local sea level differs from the global mean.
So the sea rises from ice on land: snow pressed into ice, ice flowing to the coast, shelves holding it back like corks, and warm water eating them from below.
Pine Island answered to the ocean. Thwaites, on a bed that deepens inland, kept retreating in the models even with the ocean switched off: part of its loss was already set in motion.
Whether Antarctica's other great glaciers have crossed the same line, no one yet knows. How high the sea finally climbs still depends on how much warmer the world becomes.
1901 start of the IPCC’s 20 cm of global rise
1940s Thwaites and Pine Island shelves come unpinned
1974 Weertman: grounding-line theory
1993 satellite sea-level record begins
2002 Larsen B breaks apart
2026 models: Thwaites loss is committed
MilestonesAn ice shelf edge All stills and illustrations in this film are AI-generated.
We don’t yet know if Antarctica’s other major glaciers are moving into a state of committed change.Paul Holland, British Antarctic Survey, to Euronews (2026)
Epilogue · Sources
How ice sheets raise sea level
How snow becomes glacier ice, how ice flows by creep and sliding, the role of ice shelves and buttressing, ocean melting from below, marine ice-sheet instability on beds that deepen inland, and how sea level is measured are established glaciology and oceanography, found in the agency and university sources below. The sea-level figures and projections are from the IPCC’s Sixth Assessment Report and NASA, with their dates. The 2026 Thwaites result is a single modelling study of an extreme, hypothetical case; the Joughin et al. (2014) timescales are one study’s model results; marine ice-cliff instability is held with low confidence.
The 3D slices, beds, water layers and moving dots are simplified teaching models: heights are exaggerated and nothing is to scale. All stills are AI-generated.