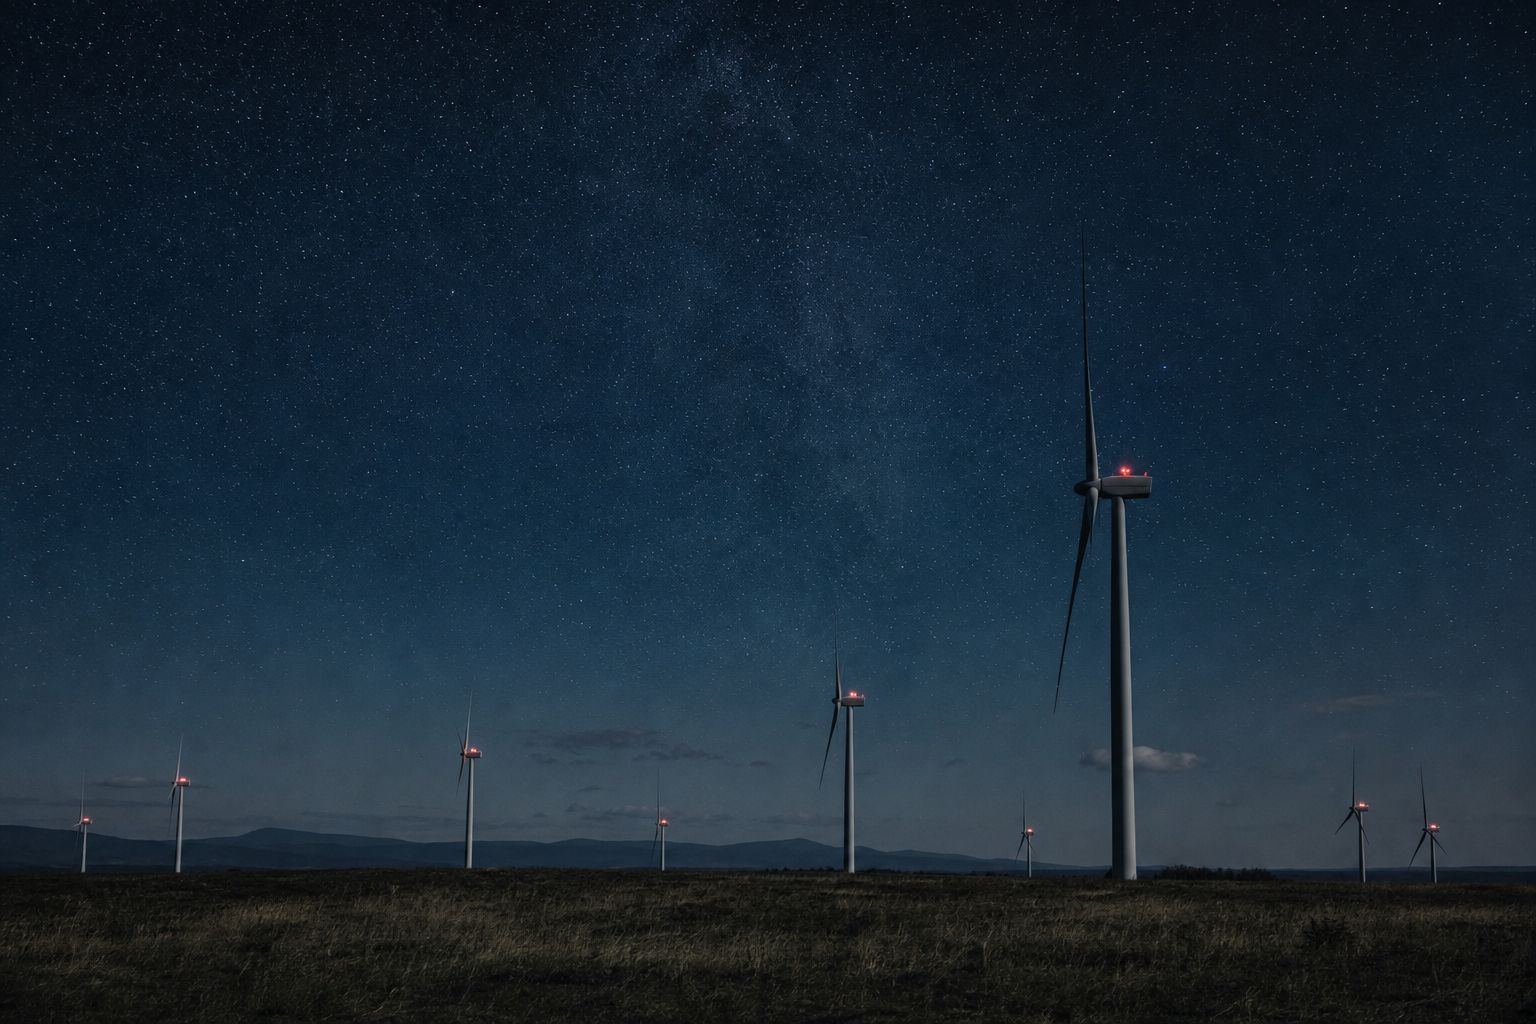
A study in PNAS in October 2026, led by the US Geological Survey, estimated that about 18.7 million bats were killed at US onshore wind farms from 1981 to 2024. This film explains the fundamentals behind that number: where wind comes from, why the power in the wind grows with the cube of its speed, the Betz limit of 59.3%, how airfoil blades make lift and why they twist, what is inside the nacelle, the power curve and capacity factor, wind shear and offshore wind, the history from Persian windmills to today's giants, and how pausing turbines on calm nights protects bats.
Interactive 3D film9 min9th century to 2026Published 1 November 2026
How turbines turn wind into electricity, and what it costs the bats.
An estimated eighteen point seven million bats were killed at American onshore wind farms between 1981 and 2024.
That figure comes from a study led by the US Geological Survey, published in the journal PNAS in October 2026.
From 2021, it puts the toll above one and a half million a year. It is a modelled nationwide estimate, built from about five hundred monitoring reports, not a count of bodies.
To weigh the problem and its fixes, start with how a turbine works.
~18.7 million
bats killed, estimated
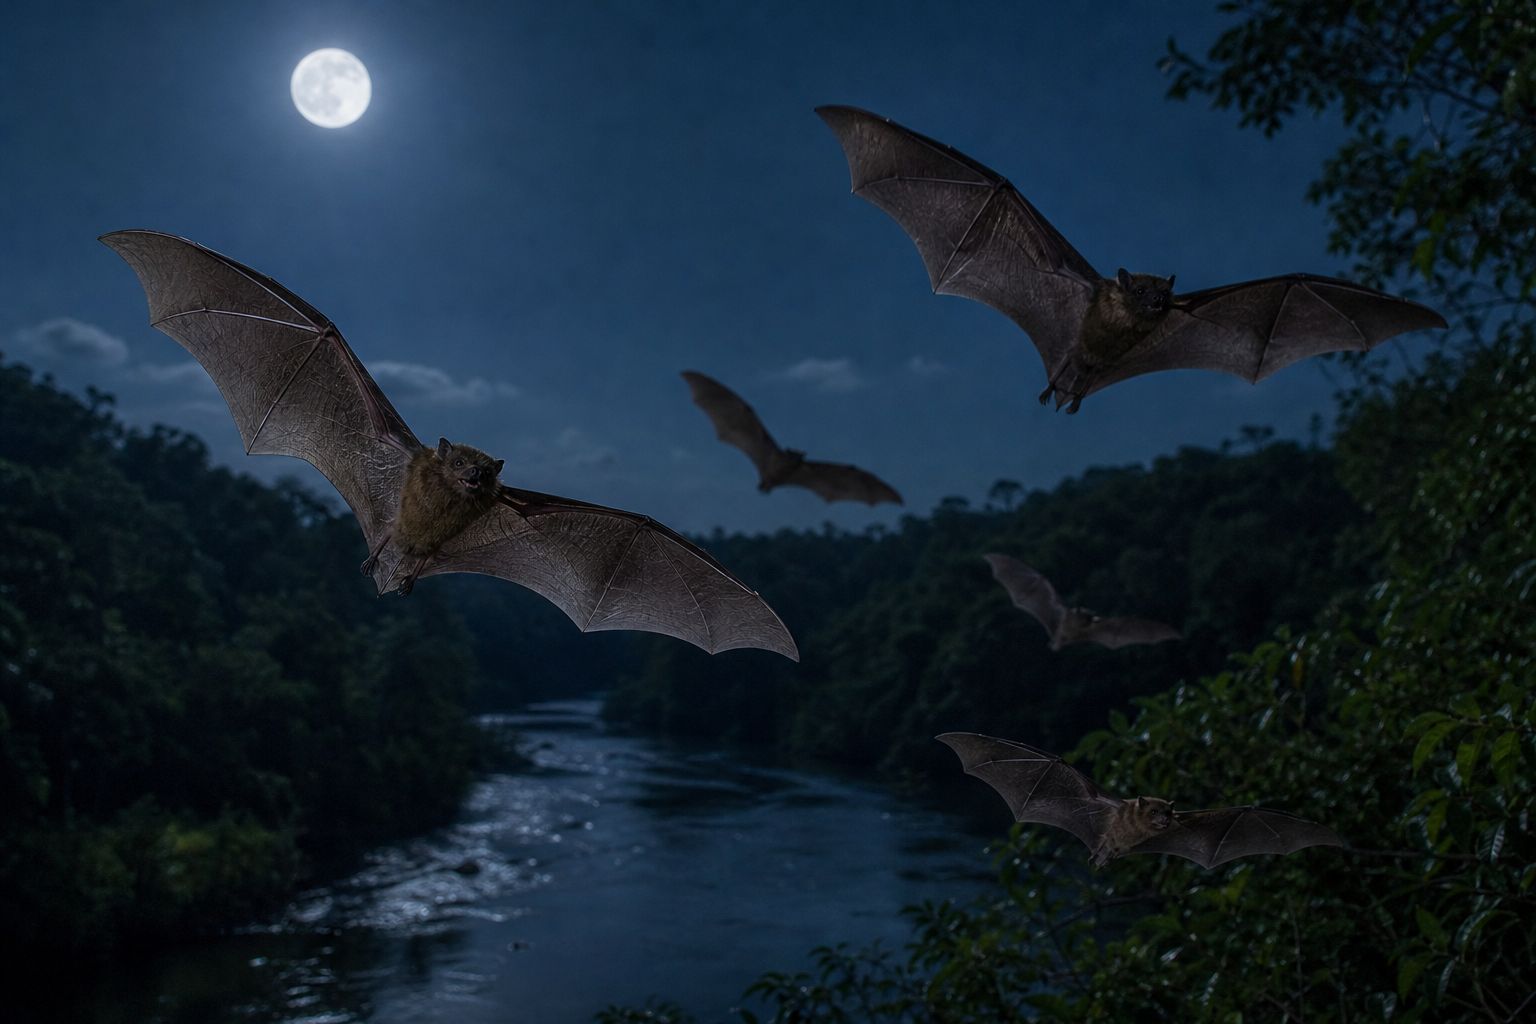
US onshore wind, 1981–2024 (PNAS, 2026)On the wing Bats feeding over a river at night. AI-generated still.
Mid-2000s (as reported by Euronews)
~100k
From 2021 (USGS)
>1.5M
Estimated bat deaths a year Modelled estimates, not carcass counts.
~500
monitoring reports pooled
277
wind facilities
The data behind it (USGS)
Prologue
One study’s estimate
USGS (27 October 2026), on a study in PNAS by USGS scientists and partners: an estimated 18.7 million bats were killed at US onshore wind energy facilities from 1981 to 2024; nationwide predictions exceeded 1.5 million fatalities a year from 2021. The analysis pooled close to 500 post-construction monitoring reports from 277 facilities and used statistical models to make nationwide predictions by species; the figures are modelled estimates, not carcass counts. Euronews (31 October 2026) reports that the annual toll was about 100,000 two decades ago.
This is the hook. The rest of the film is the established physics and engineering of wind turbines.
The 3D scenes are simplified teaching models, not to scale.
Wind is sunlight, moved. The Sun heats the Earth unevenly: its rays strike at different angles, and land, sea and mountains warm differently.
Warm air expands and rises, leaving lower pressure behind. Cool air sinks, making higher pressure. Air flows from high to low, and the bigger the difference, the faster the wind.
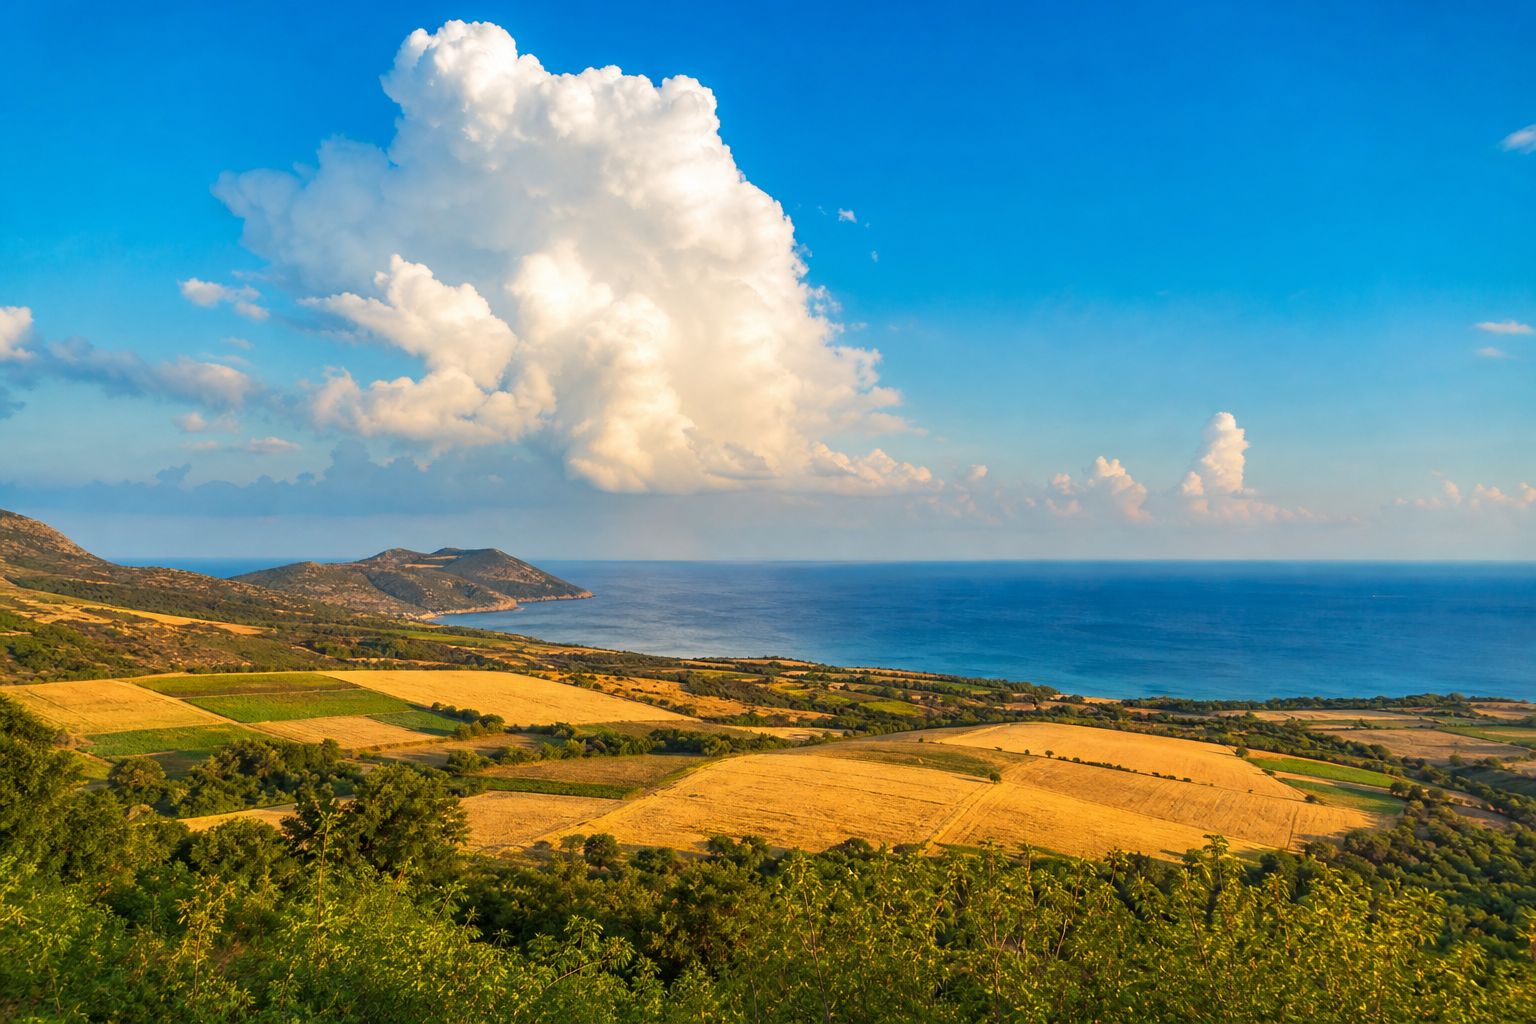
Rising air Cumulus clouds build where sunlit ground heats the air. AI-generated still.
Uneven heating
Warm air rises: low pressure
Cool air sinks: high pressure
Air flows high → low
From sunlight to wind
steeper
difference between high and low: stronger wind
Pressure difference → wind
Chapter I · Power in the wind
Why the wind blows
NOAA SciJinks: the Sun heats Earth unevenly because it strikes different regions at different angles, and oceans and mountains affect how much each area warms. Warm air expands and rises, leaving low pressure; cold air sinks, creating high pressure. Air moves from high to low pressure, and the larger the difference, the faster the wind.
The warm land and cool sea here are a schematic, not a weather model.
Moving air carries kinetic energy. The power flowing through a rotor depends on the air's density, the area the blades sweep, and the wind speed.
Speed counts most: faster wind brings more air each second, and each kilogram of it carries more energy. So the power grows with the cube of the speed.
Double the wind, and there is eight times the power.
Area matters too: double the blade length, and the power grows four times. Try the wind yourself.
P=21ρAv3
ρ
air density, about 1.225 kg per m³ at sea level (standard atmosphere)
A
area swept by the blades
v
wind speed
Power in the wind
More air arrives each second: × v
Each kilogram carries more energy: × v²
Together: × v³
Why the cube?
4 m/s
1×
8 m/s
8×
12 m/s
27×
Same rotor, different winds
2×
blade length
4×
swept area and power
Area grows with the square of blade length
Chapter I · Power in the wind
The cube law
Leipzig University, Energy fundamentals: the power of the wind follows from its kinetic energy and is proportional to the air density, the rotor area and the cube of the wind speed, so doubling the wind speed gives eight times the wind power. University of British Columbia, ATSC 113: the standard atmosphere’s sea-level air density is about 1.225 kg/m³. The swept area of a rotor is πr², so doubling the blade length quadruples it.
Try it: change the wind speed and the blade length. The power shown is what the wind carries through the rotor, before any limit; a real turbine catches less.
The 3D scenes are simplified teaching models, not to scale.
Could a turbine catch all of that power? No. To take all the energy, it would have to stop the air dead, and stopped air would block the wind behind it.
Slow it too little, and little is taken. The best compromise slows the wind behind the rotor to one third of its speed.
Then, at most, sixteen twenty-sevenths of the wind's power, about fifty-nine percent, can be caught. Albert Betz published this limit in 1919; Lanchester and Zhukovsky found it too.
That share is called the power coefficient. The best large turbines reach about forty-five to fifty percent of the wind's power.
Stop the air: nothing flows through
Leave it alone: nothing is taken
The best lies in between
Two extremes
1/3
wind speed left behind the rotor
2/3
speed through the rotor itself
The best slowingCP,max=2716≈0.593
CP
power coefficient: share of the wind’s power caught
The Betz limit Found independently by Lanchester (1915), Betz (1919) and Zhukovsky (1920).
59.3%
ideal limit
45–50%
large modern turbines, of the wind’s total
Peak power coefficient
Chapter I · Power in the wind
The Betz limit
Wikipedia, Betz’s law: no turbine of any mechanism can capture more than 16/27 (59.3%) of the kinetic energy in the wind passing through its area. Albert Betz published it in 1919; Frederick Lanchester derived the same maximum in 1915 and Nikolay Zhukovsky in 1920. It assumes an ideal disc with no drag. Leipzig University: the optimum is reached when the wind behind the rotor is slowed to one third of its upstream speed. Large modern turbines reach peak power coefficients of about 0.45 to 0.50.
Try it: choose how much the rotor slows the wind. The share caught is calculated from the ideal disc model.
The 3D scenes are simplified teaching models, not to scale.
The blades are not paddles. Sliced across, each has the shape of an aircraft wing: an airfoil.
Air flowing round it leaves lower pressure on one side. That makes lift, a force at right angles to the oncoming air, and on a turning blade lift pulls it round, far harder than drag holds it back.
Lift depends on the angle of attack, the angle at which the air meets the blade. Tilt it more, and lift grows.
Lift stops rising at about ten to twelve degrees. By thirteen to fifteen, the air tears away from the surface, lift collapses and drag soars. That is a stall.
Lift: across the airflow
Drag: along the airflow
Lift far larger: the rotor turns
Two forces on a blade
5–8°
angle of attack kept along the blade
Best working angle
Flow separates from the upper surface
Lift falls
Drag rises sharply
In a stall
10–12°
lift stops rising
13–15°
where turbine airfoils typically stall
Where it happens
Chapter II · The blade
Lift and the angle of attack
US Department of Energy: turbine blades work like aircraft wings; air flowing across a blade lowers the pressure on one side, creating lift and drag, and lift is stronger than drag, which makes the rotor spin. Princeton’s Andlinger Center: lift rises roughly linearly with the angle of attack, the angle between the chord line and the incoming air, until stall, when flow separates from the surface. Windfarm BOP: lift stops increasing beyond about 10–12°, turbine profiles typically stall around 13–15°, and blades are run at about 5–8°.
Try it: change the angle of attack. The arrows are illustrative, not measured forces.
The 3D scenes are simplified teaching models, not to scale.
A blade's tip travels far faster than its root: on a modern rotor, about seven to eight times faster than the wind. Lift pulls it along, the way some sailboats outrun the breeze. That is the tip-speed ratio.
So each part of the blade meets the air at a different angle. The blade is twisted, about fifteen to twenty degrees from root to tip, to keep every section near its best angle.
It tapers too: wide near the hub, slender at the fast-moving tip.
Why three blades? More add weight and cost; fewer must spin faster, with more noise and vibration. Three is the compromise.
λ=vωR≈7–8
ωR
speed of the blade tip
v
wind speed
Tip-speed ratio
15–20°
total twist, root to tip
60–80 m/s
typical tip speed; noise limits it near 80
Along one blade
Root: slow, wide, set at a steep angle
Tip: fast, slender, almost flat
Root and tip
More: heavier, costlier
Two: faster spin, more noise and vibration
Three: the compromise
How many blades?
Chapter II · The blade
Twist, taper and three blades
Windfarm BOP: the blade sees the real wind combined with its own motion, and that angle changes along the span, so blades carry about 15–20° of twist from root to tip to hold the angle of attack near 5–8°; the chord is widest at the root and narrows toward the fast tip; modern three-bladed rotors run at an optimal tip-speed ratio of about 7–9, with tip speeds of 60–80 m/s. Leipzig University gives 7–8. Princeton’s Andlinger Center: more blades add weight, complexity and cost; two blades would need faster rotation, raising noise, vibration and structural problems, so three became the industry compromise.
The three cross-sections on the blade show the twist, exaggerated for clarity.
The 3D scenes are simplified teaching models, not to scale.
On top of the tower sits the nacelle. The blades join a hub that turns a main shaft slowly, about eight to twenty turns a minute.
Often a gearbox speeds this up for the generator, where copper coils spin through a magnetic field. Direct-drive turbines skip the gearbox: their generator turns as slowly as the blades.
A wind vane and an anemometer measure the wind for a controller.
Yaw motors swing the nacelle to face the wind, and the pitch system turns each blade on its own axis.
8–20 rpm
turned by the hub (US DOE)
The main shaft
Geared: slow shaft → gearbox → fast generator
Direct drive: rotor → slow generator, no gearbox
Two drive trains
Wind vane: direction
Anemometer: speed
Measuring the wind
Yaw drive: turns the nacelle
Pitch: turns each blade
Moving to match it
Chapter III · The machine
What is up there
US Department of Energy: the hub connects the blades to the main shaft, or straight to the generator in direct-drive designs; the low-speed shaft turns at about 8–20 rpm; the gearbox converts slow, high-torque rotation into the faster rotation the generator needs, where copper windings spin through a magnetic field; the nacelle houses the gearbox, shafts, generator and brake; the anemometer and wind vane feed the controller; the yaw drive turns an upwind turbine to face the wind; the pitch system adjusts blade angle to control rotor speed and can feather the blades to stop the rotor.
Try it: switch between a geared and a direct-drive layout, or shift the wind and watch the nacelle yaw.
The 3D scenes are simplified teaching models, not to scale.
Those controls shape the power curve. Below about three metres a second, the rotor waits: that is the cut-in speed, which will matter for the bats.
Above it, output climbs steeply with the cube of the wind, up to the turbine's rated power, at around twelve metres a second.
Beyond that, the blades pitch to spill the extra wind and hold output steady. Near twenty-five metres a second, the cut-out speed, they turn edge-on and the rotor stops.
Because wind varies, a year's output, the capacity factor, is only part of the maximum: about a third across the United States in 2023.
~3 m/s
cut-in
~12 m/s
rated power reached
~25 m/s
cut-out
A typical power curve
Blades held at their best angle
Rotor speeds up with the wind
Output follows the cube law
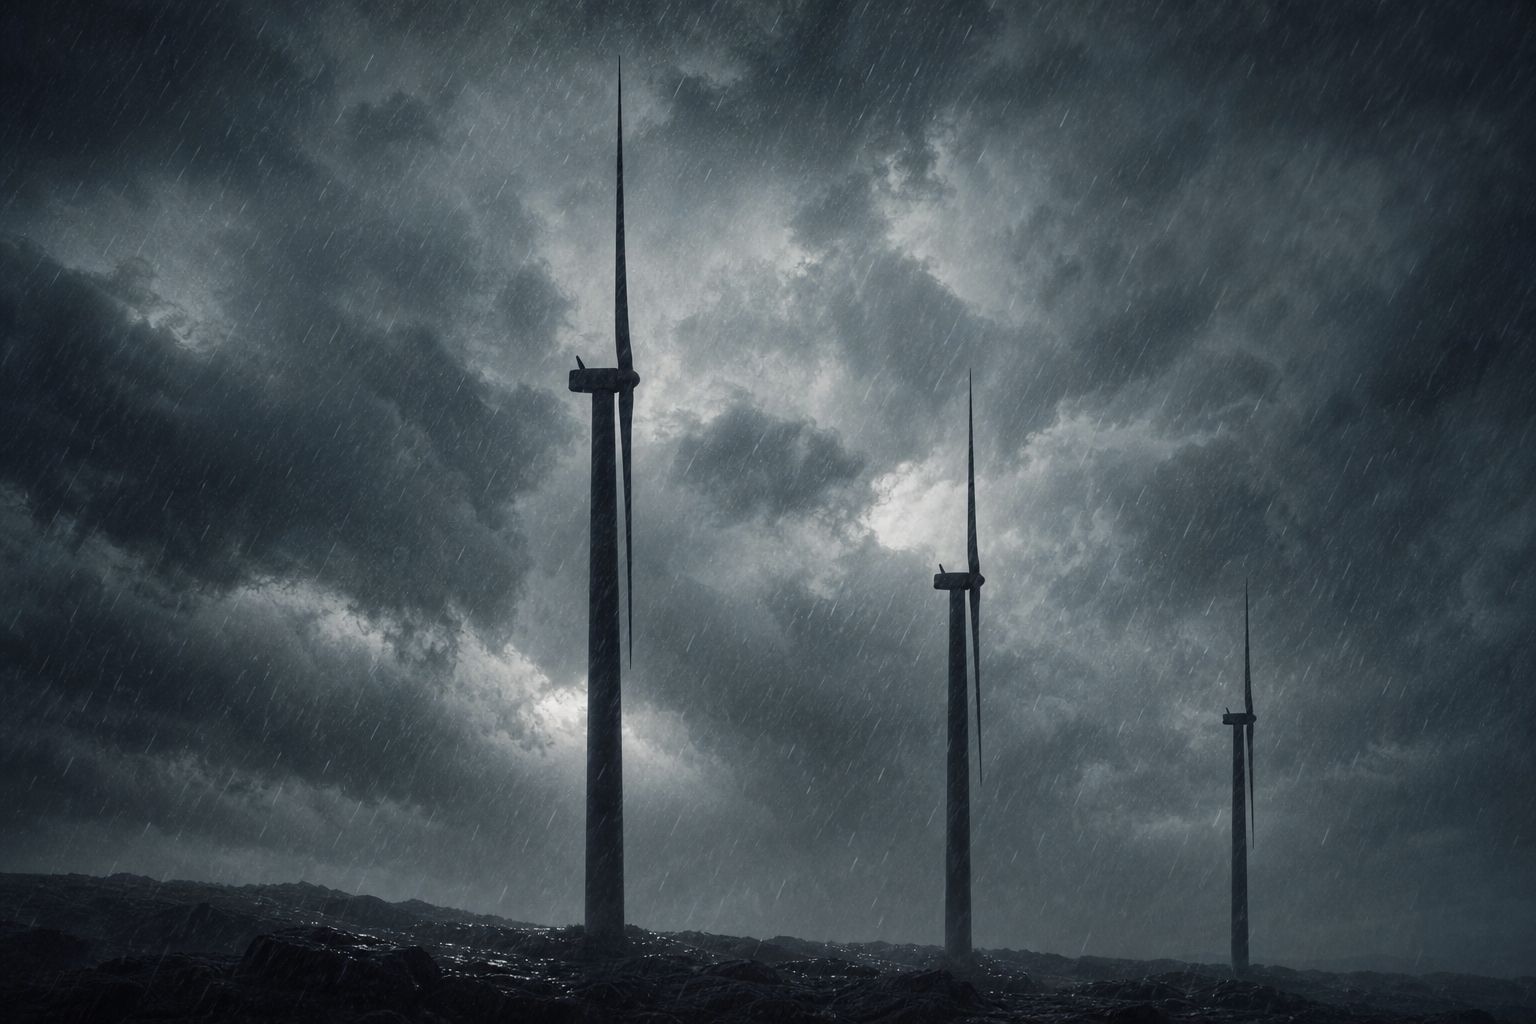
Below rated powerWaiting out a storm Blades feathered edge-on, rotors parked. AI-generated still.
2022, record
35.9%
2023, weaker winds
33.5%
US wind capacity factor (EIA)
Chapter III · The machine
Cut-in, rated, cut-out
Princeton’s Andlinger Center: output begins at cut-in (about 3 m/s in its example), rises steeply to rated power (12 m/s), stays flat until cut-out (25 m/s) and then drops to zero; above rated speed the blades are pitched to reduce lift and hold power constant, and near cut-out they turn edge-on and the turbine stops. The US Department of Energy gives a cut-in of about 7–11 mph and a cut-out above about 55–65 mph. US Energy Information Administration: the US wind fleet’s capacity factor, its actual output as a share of its maximum, was 35.9% in 2022, an all-time high, and 33.5% in 2023, mainly because of weaker winds.
Try it: pick a wind speed and see where the turbine sits on its curve. The curve is a typical shape, not one model’s data.
The 3D scenes are simplified teaching models, not to scale.
Near the ground, trees, hills and buildings slow the wind by friction. Higher up, it blows faster and more smoothly. This is wind shear.
A common rule of thumb: double the height, and the wind gets about ten percent faster. Remember the cube: that is about a third more power.
That is why towers keep growing, and why turbines go to sea, where little slows the wind.
0.5 m
forest: roughness length
0.0002 m
calm open sea
How rough is the surface?v1v2=(z1z2)α,α≈71
z
height above the surface
α
depends on terrain and weather
Power-law wind profile
Inland
23%
Coast
28%
Offshore
43%
Capacity factor, German examples (Leipzig University)
Chapter IV · Taller and bigger
Wind shear
UL HOMER Pro manual: wind speed rises with height; the power-law profile uses an exponent of about 1/7 (0.143), a value from research on turbulent flow over a flat plate, though in practice it varies with terrain roughness and atmospheric stability; surface roughness ranges from about 0.0002 m over a calm open sea to 0.5 m over forest and 3 m in a city centre. US Department of Energy: taller towers reach stronger, less turbulent winds. Leipzig University gives yearly yields of about 23% of rated output inland, 28% on the coast and 43% offshore.
Try it: move the hub up the tower, or move the turbine out to sea. Speeds use the 1/7 rule of thumb from a 10 m reading of 5 m/s; real sites differ.
The 3D scenes are simplified teaching models, not to scale.
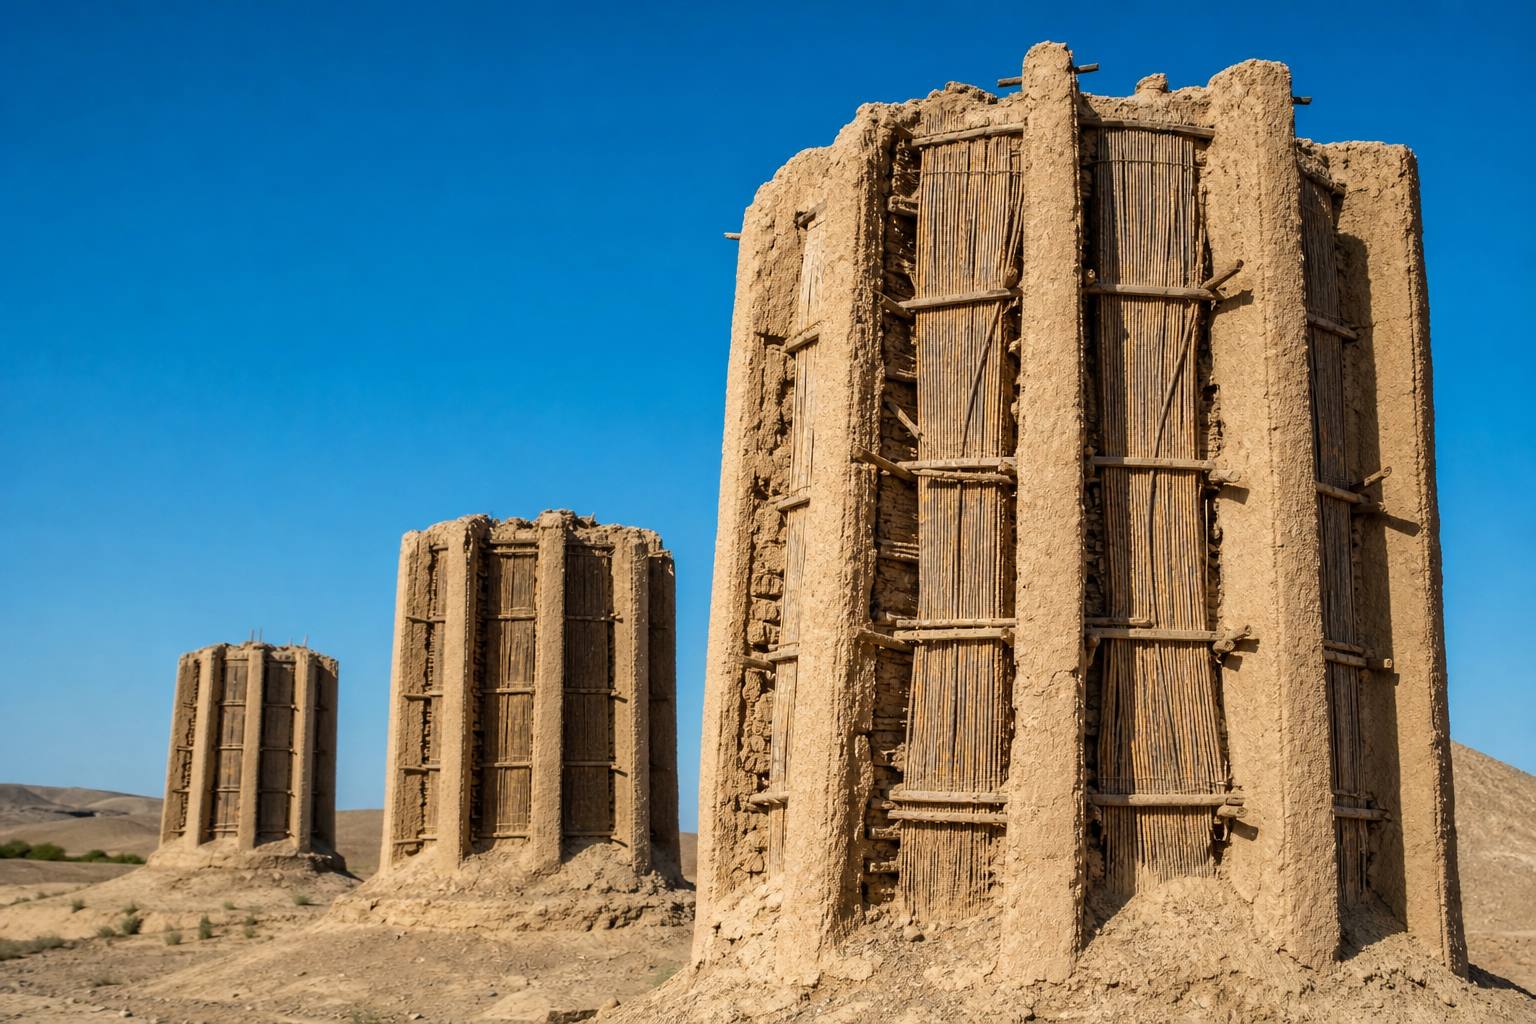
By at least the ninth century, windmills in Sistan, in Persia, turned on upright shafts to grind grain.
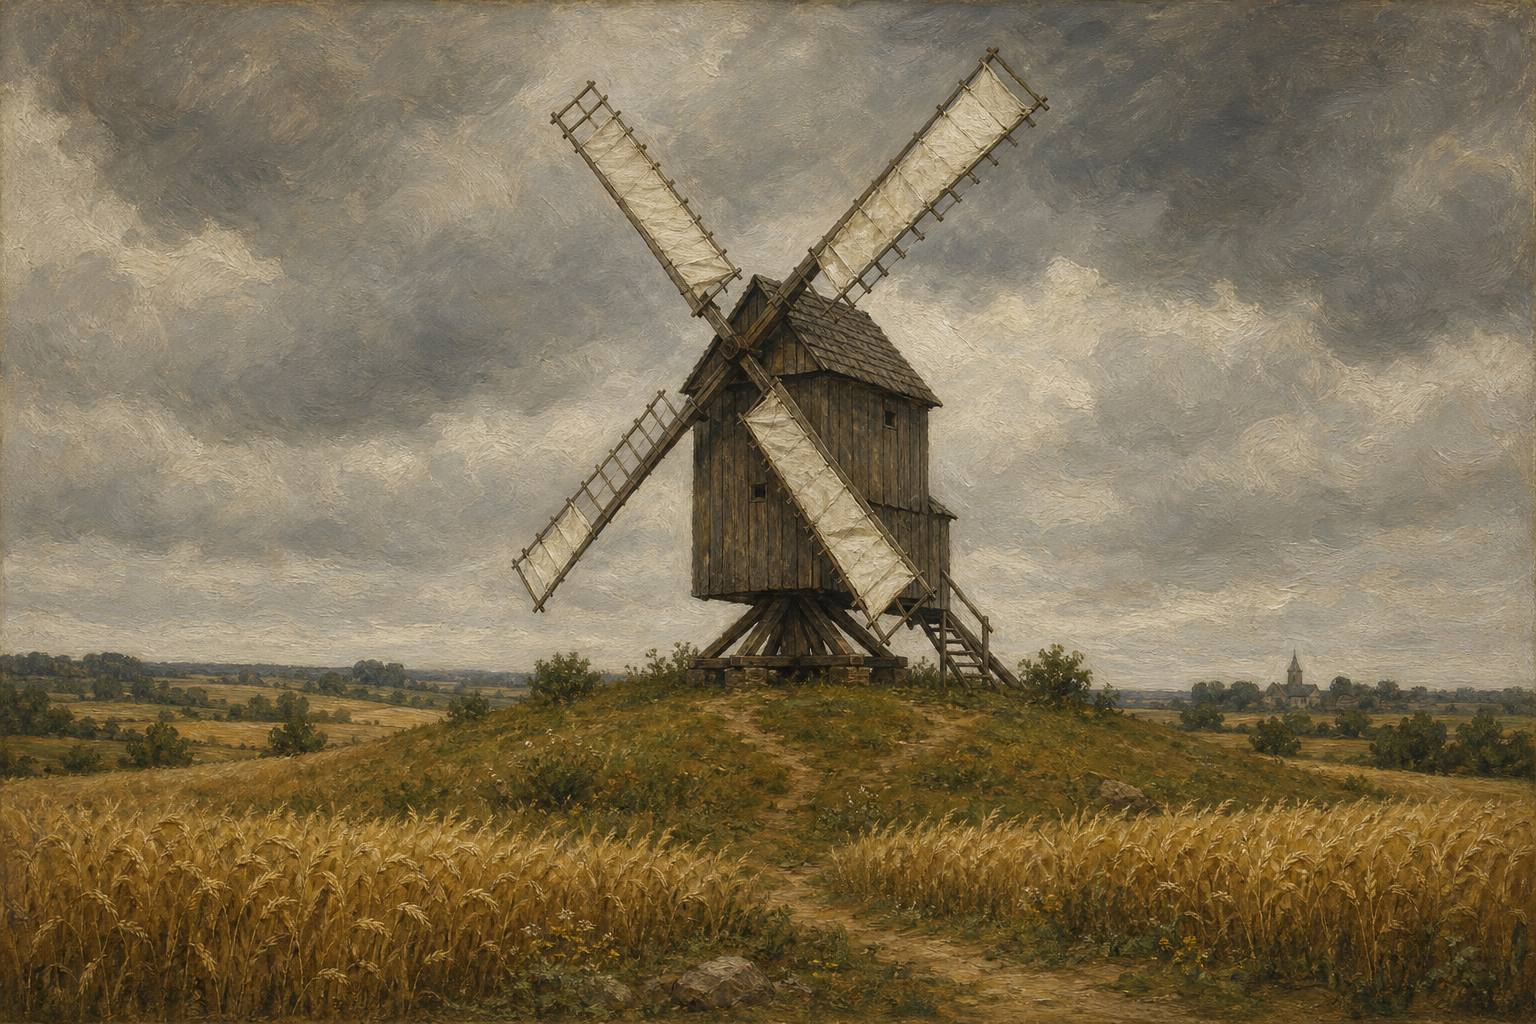
Europe's earliest certain windmill is recorded in 1185, in Yorkshire.
Electricity came in the 1880s, with James Blyth's turbine in Scotland and Charles Brush's in Ohio: a hundred and forty-four cedar blades, twelve kilowatts.
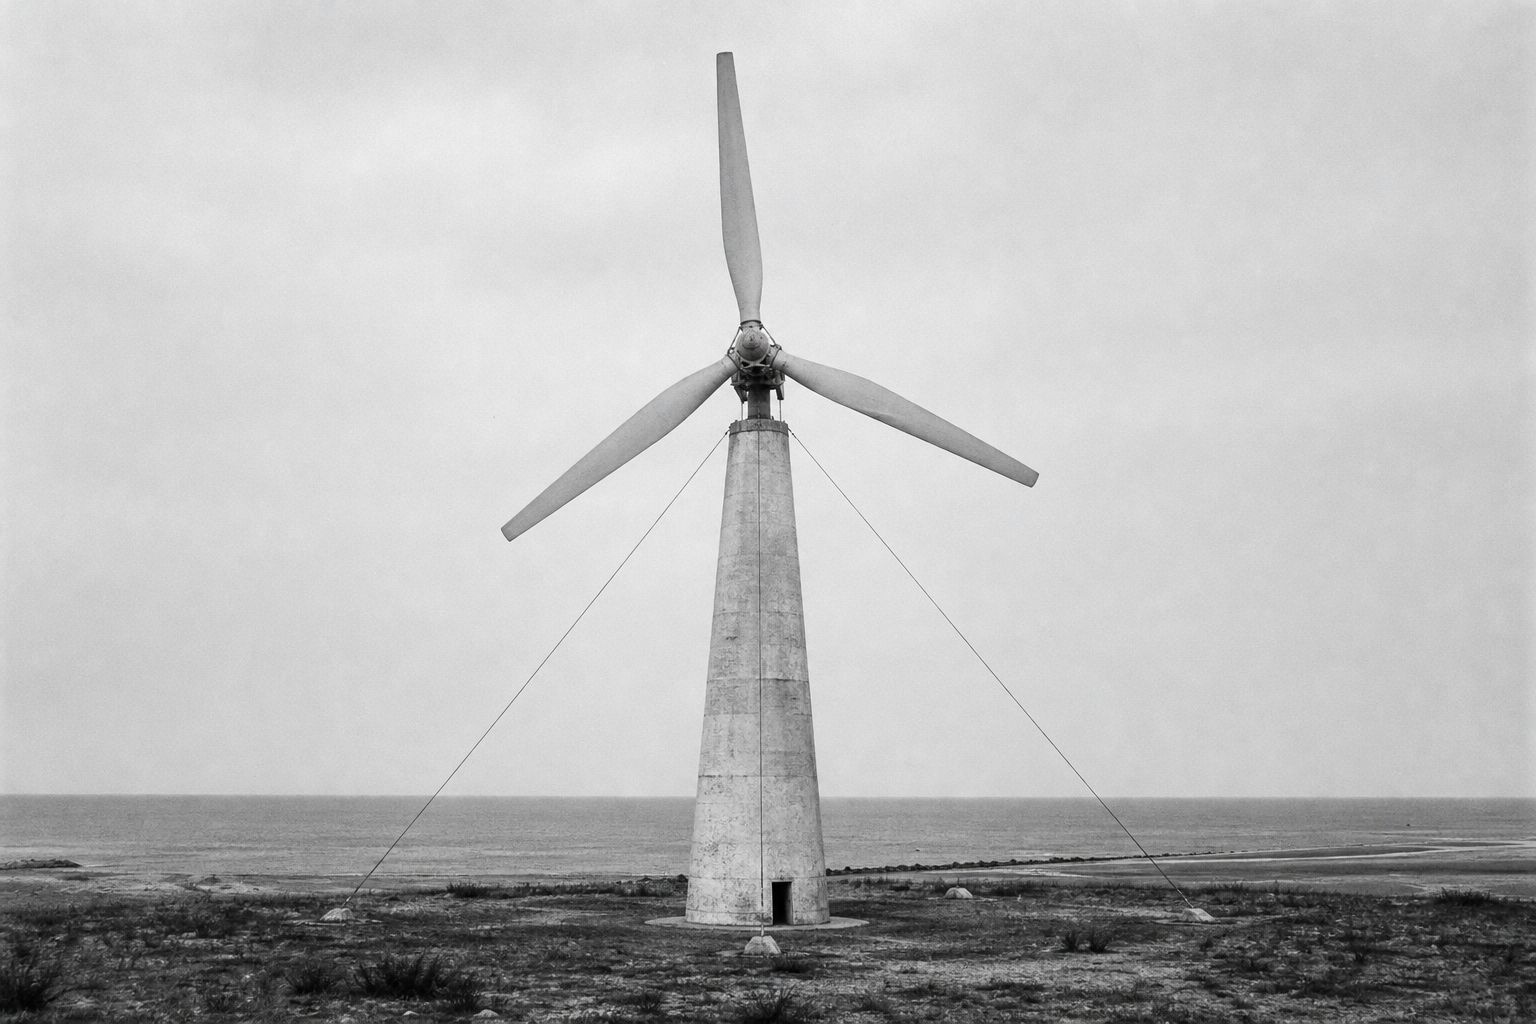
In 1957, Johannes Juul's Gedser turbine in Denmark gave two hundred kilowatts from three fixed blades facing the wind, regulated by stall. That layout became known as the Danish design.
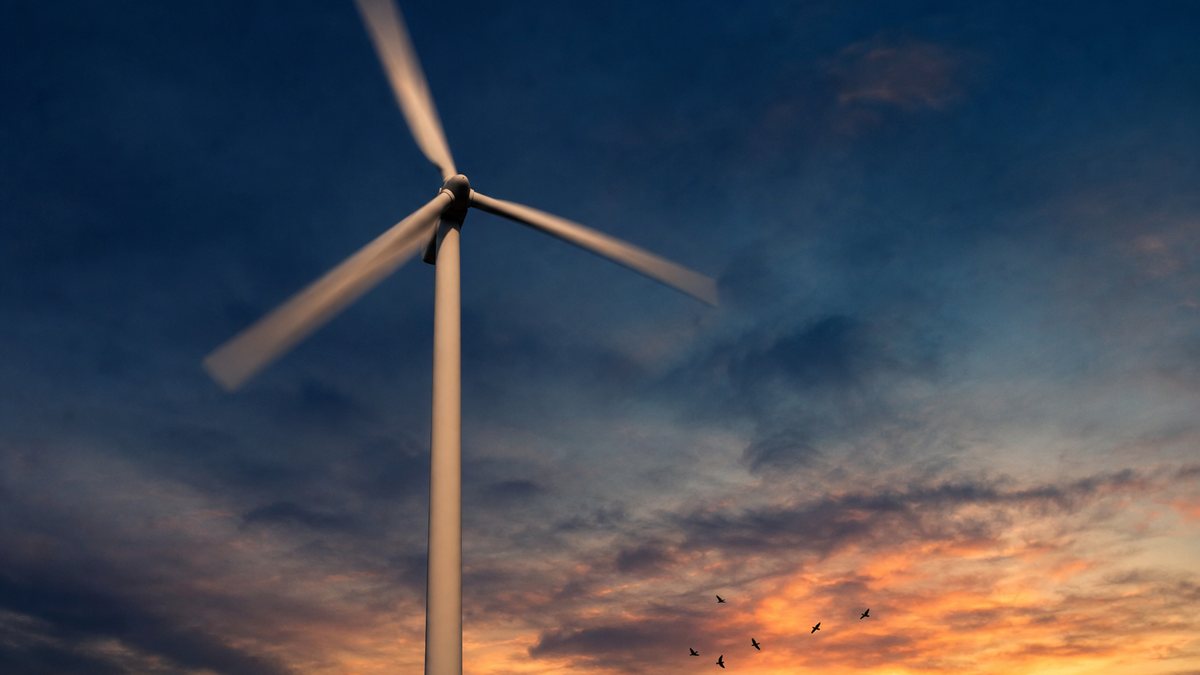
Persian windmills Mud-brick walls funnel the wind onto sails that turn on an upright shaft. AI-generated still.A post mill The whole wooden body turns on one post to face the wind. AI-generated still.
9th c. Sistan windmills, Persia
1185 Weedley, Yorkshire
1887 Blyth, Marykirk, Scotland
1888 Brush, Cleveland, 12 kW
1891 Poul la Cour, Askov, Denmark
1957 Gedser, 200 kW, 24 m rotor
MilestonesThe Danish design Three blades on the upwind side of a concrete tower. AI-generated still.
Chapter IV · Taller and bigger
From grain to the grid
Wikipedia, History of wind power: windmills were used in Sistan, Persia, by at least the 9th century, possibly the 7th; the earliest certain reference to a European windmill is from 1185, at Weedley in Yorkshire; James Blyth’s turbine at Marykirk, Scotland, dates from July 1887, Charles Brush’s in Cleveland, Ohio, from 1887–88, and Poul la Cour’s at Askov from 1891. ExplorersWeb: the Persian mills turn on a vertical axis, driven by drag, inside tall mud-brick walls. POWER magazine: Brush’s machine had 144 cedar blades, a 17 m rotor and a 12 kW rating. Wikipedia, Gedser wind turbine: built by Johannes Juul for SEAS in 1957, 200 kW, three stall-regulated blades, 24 m across; ran until 1967; its layout became known as the “Danish design”. POWER magazine: a three-bladed upwind design that pioneered modern wind turbines.
The rotor rings are drawn to scale with each other.
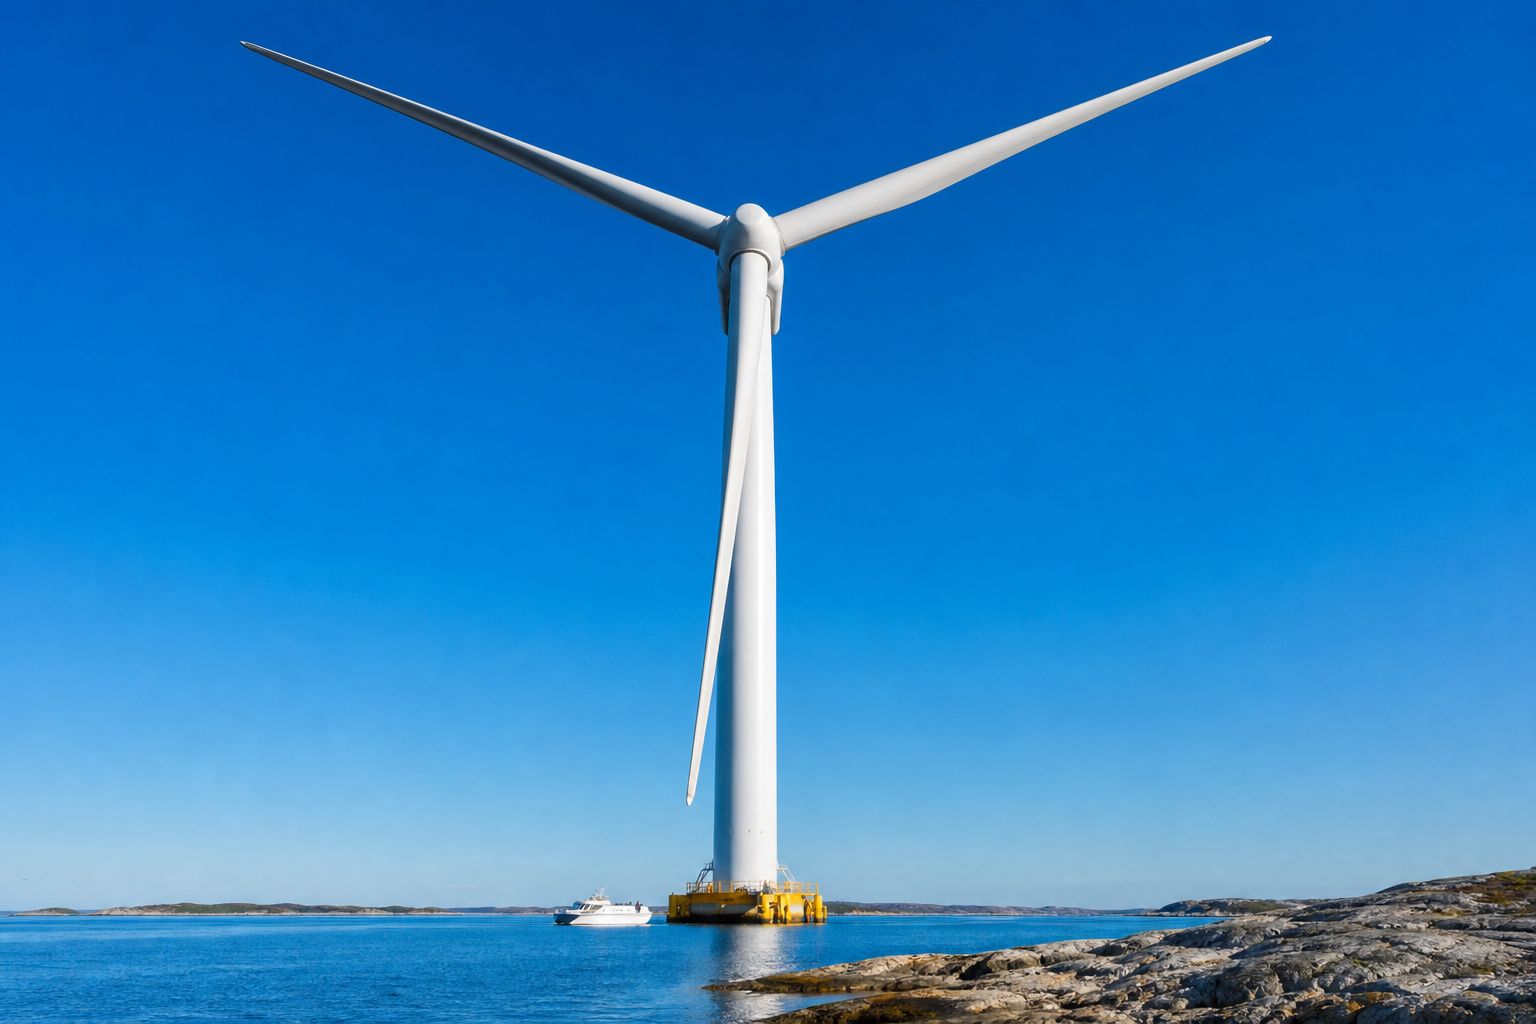
Today's machines dwarf it. In 2025, fifteen-megawatt turbines with rotors two hundred and thirty-six metres across began going up off Germany.
A twenty-six-megawatt prototype tested in China has a rotor three hundred and ten metres wide.
Bigger rotors catch more wind. But the bat study found more deaths at turbines with larger swept areas.
In 2025, wind made about eight and a half percent of the world's electricity, says the think tank Ember.
Thailand has about one point six gigawatts of wind power.
64
turbines of 15 MW
960 MW
in all
He Dreiht, off Germany (2025)
26 MW
rating
153 m
each blade
Prototype, Shandong, China (2025)A giant on test An imagined giant offshore machine; the boat at its foot gives the scale. AI-generated still.
2,715 TWh
generated worldwide
8.5%
of global electricity, a record
Wind power, 2025 (Ember)
~1,608 MW
installed
612
turbines
Thailand (The Wind Power database, 2026)
Chapter IV · Taller and bigger
Today’s giants
offshoreWIND.biz: the first Vestas V236-15.0 MW turbine at EnBW’s 960 MW He Dreiht wind farm off Germany was installed on 24 April 2025, one of 64 (15 MW-class machines had already gone up elsewhere; Mingyang commissioned a 16 MW offshore turbine in China in 2023); the turbine’s rotor is 236 m across (Wikipedia, He Dreiht). offshoreWIND.biz’s 2025 review: a 26 MW Dongfang test turbine with a 310 m rotor and 153 m blades was installed at Dongying, Shandong, in September 2025. Ember’s Global Electricity Review 2026, as reported by Energy News: wind generated 2,715 TWh in 2025, 8.5% of global electricity, an all-time high. The Wind Power database (updated May 2026): Thailand has 1,608 MW in 35 wind farms with 612 turbines.
The rotor rings are to scale with each other; the person-sized marker at the base is 2 m.
Bigger rotors, more power, more risk: what the estimate says, and what it does not.
Back to the bats. Most of those in the estimate are migratory tree bats: hoary bats, eastern red bats and silver-haired bats.
Scientists are unsure why they collide: perhaps they mistake turbines for trees, are drawn by the sound, or cannot detect the moving blades.
Deaths were also higher where blades pass closer to the ground, and near rivers.
It does not show whether bat populations are falling: the authors say that needs counts of living bats too.
Hoary bat
6.7
Eastern red bat
5.8
Silver-haired bat
3.4
Estimated deaths by species, 1981–2024 (USGS)
Mistaking turbines for trees
Drawn by the sound
Not detecting the moving blades
Why they collide: ideas, not answers
Lower ground clearance
Closer to rivers
Higher risk (PNAS, 2026)
Chapter V · Bats and blades
What the estimate shows
USGS (27 October 2026): the three species with the largest estimated totals are migratory, tree-roosting bats: the hoary bat (about 6.7 million), the eastern red bat (5.8 million) and the silver-haired bat (3.4 million); turbines with larger rotor-swept area, lower ground clearance and closer proximity to rivers had higher site-level fatalities for several species; the study does not establish whether wind energy is driving population declines, which would require merging fatality data with population status and trend estimates. Euronews: scientists are unsure why bats collide; theories include attraction to the noise, mistaking turbines for trees, and difficulty detecting blades; many bats depend on rivers for food, water and navigation.
The bats in the 3D scene are illustrative, not data.
The 3D scenes are simplified teaching models, not to scale.
Here the cut-in speed comes back. Most bats die in late summer and early autumn, on nights of light wind, when turbines make little power.
A 2011 study at a Pennsylvania wind farm raised the cut-in speed, so the blades stayed still in light winds.
Bat deaths fell by forty-four to ninety-three percent, for about one percent of the year's power or less.
Across a hundred and forty-one European wind farms, pausing turbines when bats fly most cut their deaths by more than eighty percent, though it did not help migrating birds.
Resting on a calm night Rotors parked under the stars. AI-generated still.
~3.6–4.0 m/s
normal
~4.9 or 6.5 m/s
raised
Cut-in speed at Casselman (ESA)
44–93%
fewer bat deaths each night
≤ 1%
of yearly power lost
Casselman Wind Project, 2008–09 (Arnett et al., 2011)
> 80%
fewer deaths with targeted pauses
141 European wind farms
Chapter V · Bats and blades
Letting the blades rest
Bats and Wind Energy Cooperative: fatalities are closely tied to low wind speeds, mostly on low-wind nights in late summer and early autumn. Arnett et al. (2011), Frontiers in Ecology and the Environment: raising turbine cut-in speeds at the Casselman Wind Project in Pennsylvania over two years reduced nightly bat fatalities by 44–93%, with an annual power loss of 1% or less. Ecological Society of America: the study ran on summer and autumn nights in 2008 and 2009; bat activity and fatalities are highest in the late-summer and early-autumn migration months; the normal cut-in of about 8–9 mph was raised to about 11 mph and 14.5 mph. Euronews: a separate study of 141 European wind farms found that not running turbines in conditions particularly favourable to bat flight cut mortality by more than 80%; such measures did not reduce deaths of migratory birds. IPCC (2014) median life-cycle emissions: 11 g CO₂-eq/kWh for onshore wind, 820 for coal.
Try it: compare a normal cut-in speed with a raised one on a light-wind night. The bats and their paths are illustrative.
The 3D scenes are simplified teaching models, not to scale.
Why does the trade-off matter? Over its life, onshore wind emits about eleven grams of carbon dioxide per kilowatt-hour, against about eight hundred and twenty for coal, by IPCC median figures.
Resting the blades on calm nights costs a little power. Whether today's losses are shrinking bat populations is still an open question.
Coal
820
Gas (combined cycle)
490
Solar PV (utility)
48
Wind, onshore
11
Life-cycle emissions, IPCC medians
9th c. Persian windmills grind grain
1887–88 First wind-powered electricity
1919 Betz limit published
1957 Gedser: the Danish design
2011 Raised cut-in speed shown to spare bats
2025 Wind: 8.5% of world electricity
2026 PNAS estimate of US bat deaths
Wind power in time
Epilogue · Sources
Sources
Every fact in this film comes from the sources below. The chapter stills and pictures are AI-generated and show no real people or brands. The turbines, air flows, airfoil, stream tube and bats in the 3D scenes are simplified teaching models; the power curve is a typical shape, not one model’s data. The bat numbers are one study’s statistical estimate, and the study itself says it does not show whether bat populations are declining. The film focuses on bats because that study is the news; turbines also kill birds, and the European pauses that protect bats did not reduce migratory-bird deaths (Euronews). Pausing turbines costs some generation (Bats and Wind Energy Cooperative).