Satellite radar has hinted at two active magma reservoirs beneath Masaya volcano in Nicaragua, close to about two million people. To understand what that means, this film starts deep inside the Earth: why the mantle is solid yet melts in three special places, why most volcanoes ring the Pacific, why silica and gas decide between a lava river and an explosion, what a magma chamber and a caldera are, how eruptions are measured, what makes them deadly, and how scientists watch a volcano swell. Choose how magma melts, mix your own magma, empty a chamber and inflate one under a satellite.
Interactive 3D film8 min1815 to 2026Published 20 October 2026
A volcano near two million people, watched from space.
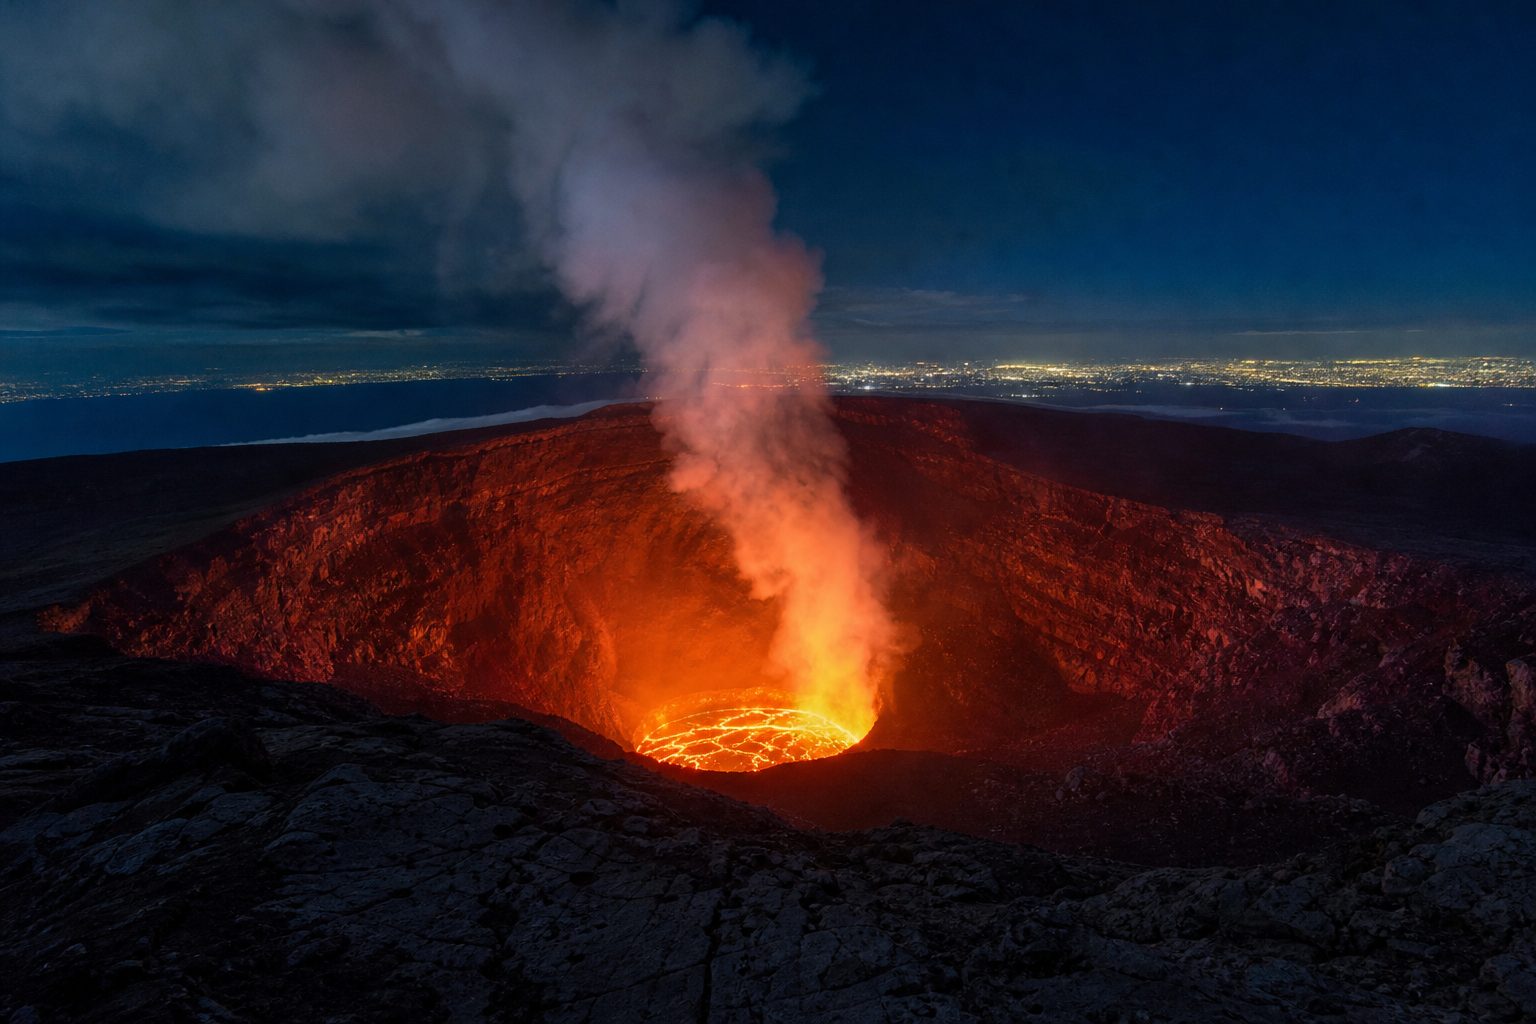
About two million people live within twenty kilometres of Masaya, a volcano in Nicaragua with a glowing lava lake.
In 2026, Penn State researchers described six years of satellite radar. The caldera floor sank, then rose, possibly as fresh magma entered a deeper reservoir, while around the active crater the ground kept sinking, as if a shallower one were draining.
The team saw no sign of immediate danger. To understand what they saw, let's start far below our feet.
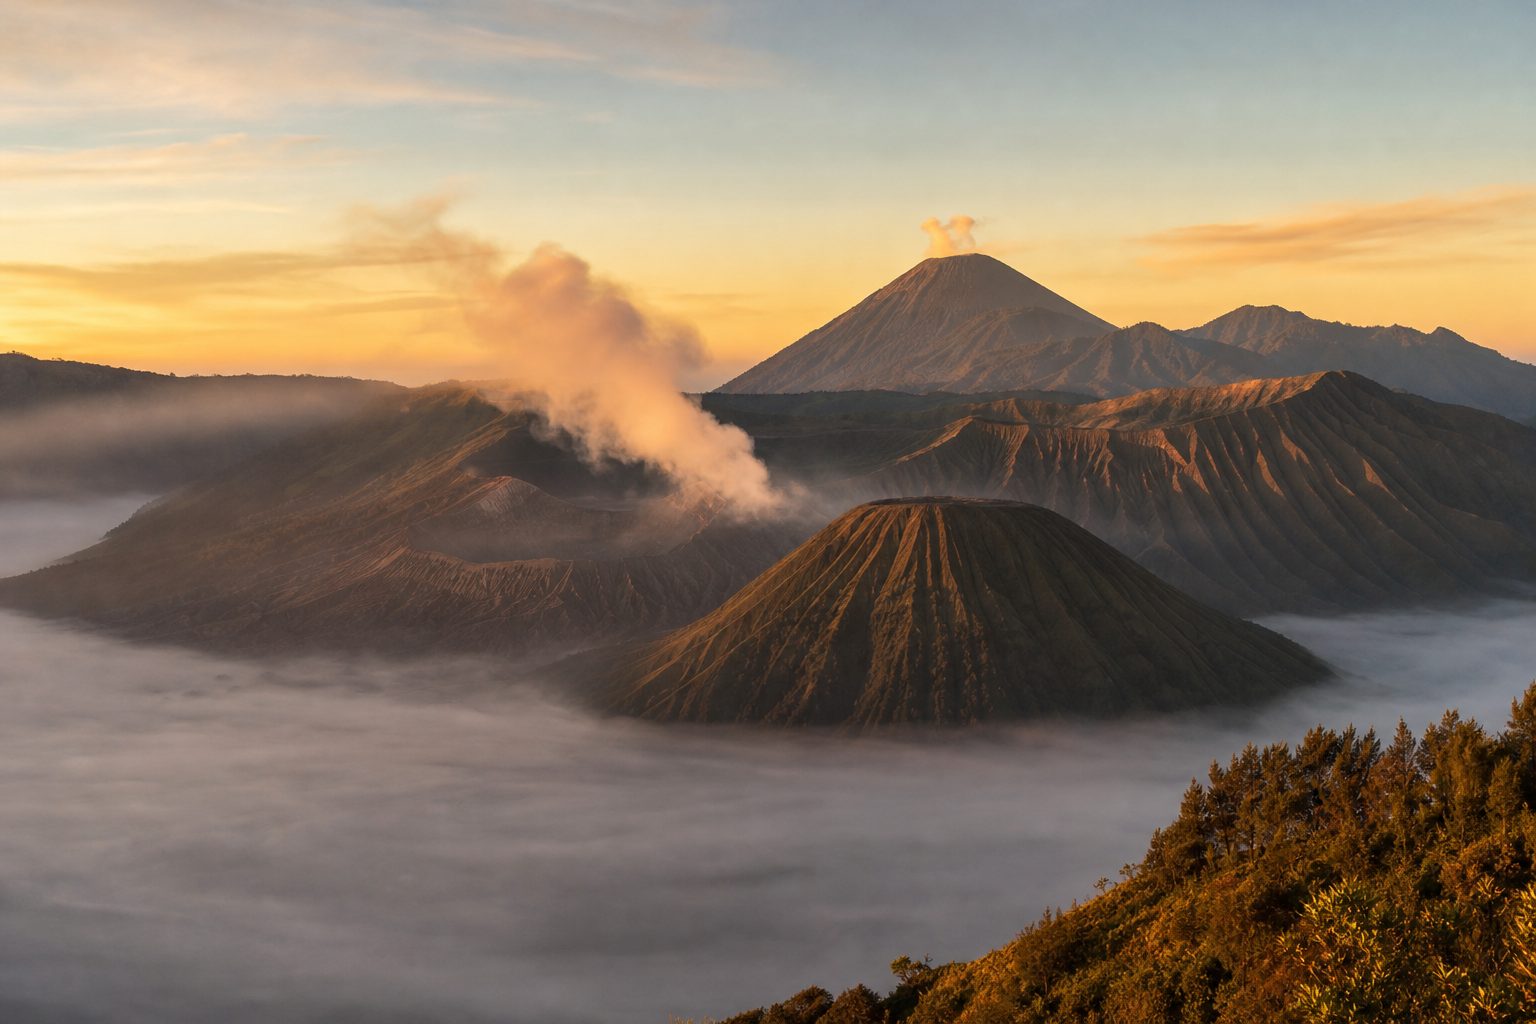
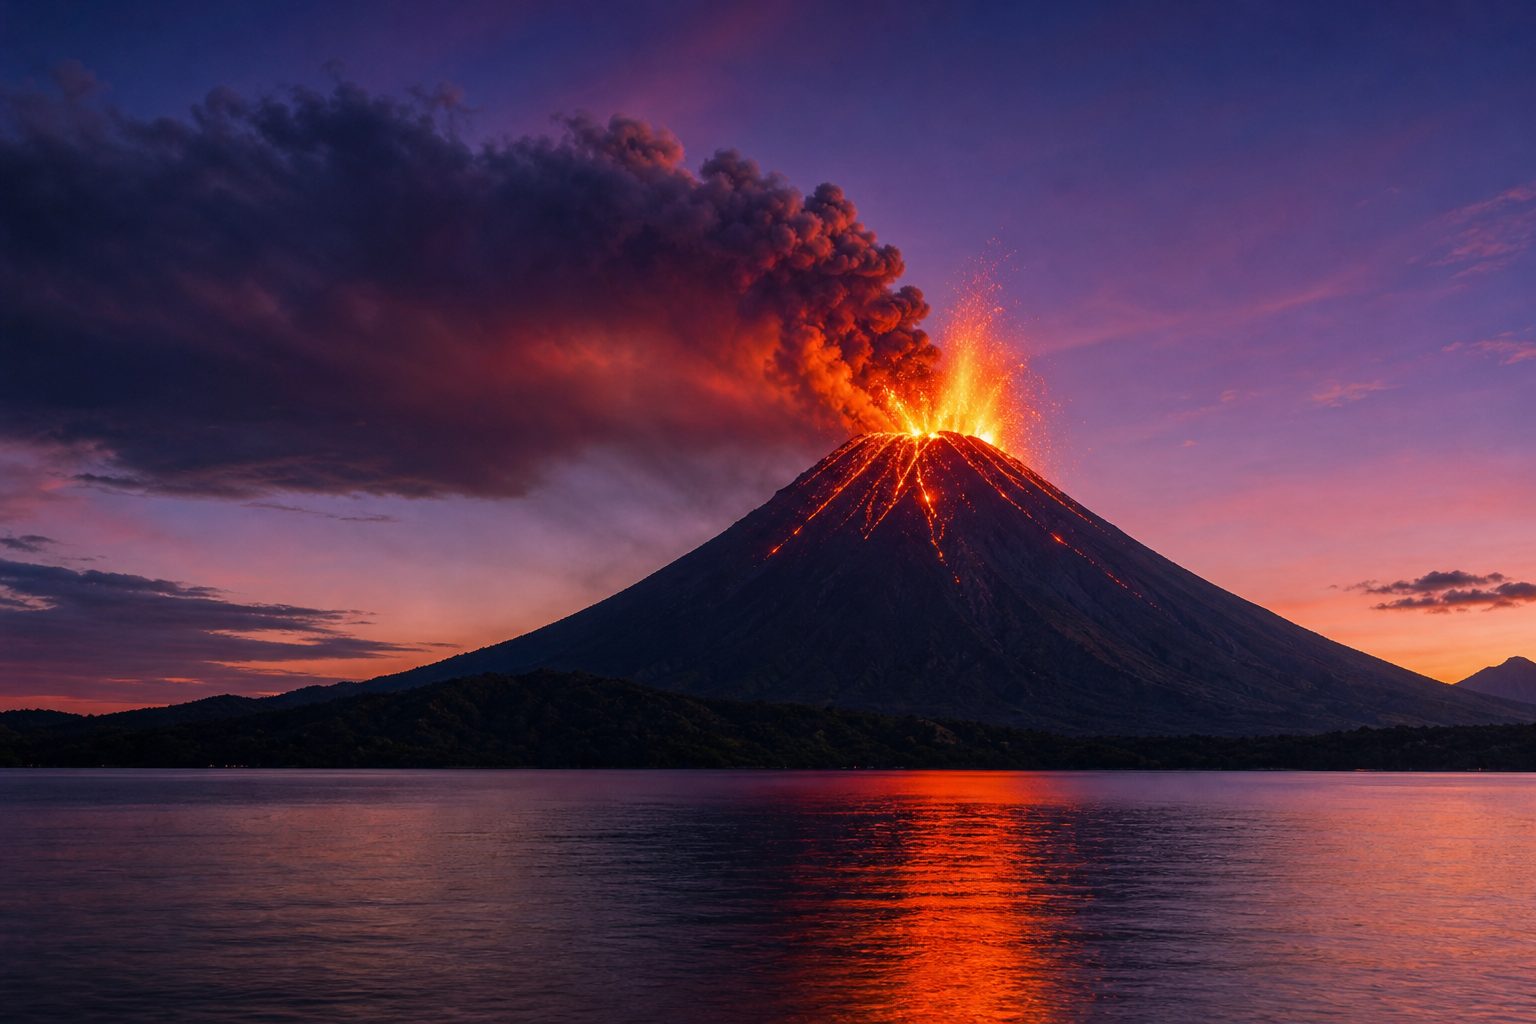
A lava lake Masaya’s Santiago crater has held a lava lake since December 2015. AI-generated still.
Lizzie Johnson, Young Cheol Kim, Christelle Wauthier
Sentinel-1 radar images, 2018–2024
one satellite pass about every 12 days
The study (Geophysical Research Letters, 2026)
~2 million
people within 20 km
1772
last major lava flow
Masaya (ScienceAlert, ScienceDaily)
where magma comes from
why some eruptions explode
what makes them deadly
how volcanoes are watched
What this film covers
Prologue · The news
Two reservoirs under Masaya?
According to Penn State, a study in Geophysical Research Letters by Lizzie Johnson, Young Cheol Kim and Christelle Wauthier analysed six years (2018–2024) of Sentinel-1 radar (InSAR) data over Masaya, near Managua. The caldera ground first subsided and then rose, possibly as fresh magma entered a deep reservoir, while the ground around the active Santiago crater kept sinking, which the authors read as a separate, shallower reservoir that may be losing magma. The researchers said their observations show no immediate danger to nearby communities and that continued monitoring is needed. ScienceAlert notes the authors call the arrangement similar to what is inferred at Kīlauea, and that Masaya’s frequent degassing pushes sulfur dioxide above WHO air-quality standards.
This is one new study. The film treats it as a hint, not a settled result, and teaches the established science behind it.
How to use: pick a chapter or press ← →; drag to rotate. Several steps have buttons.
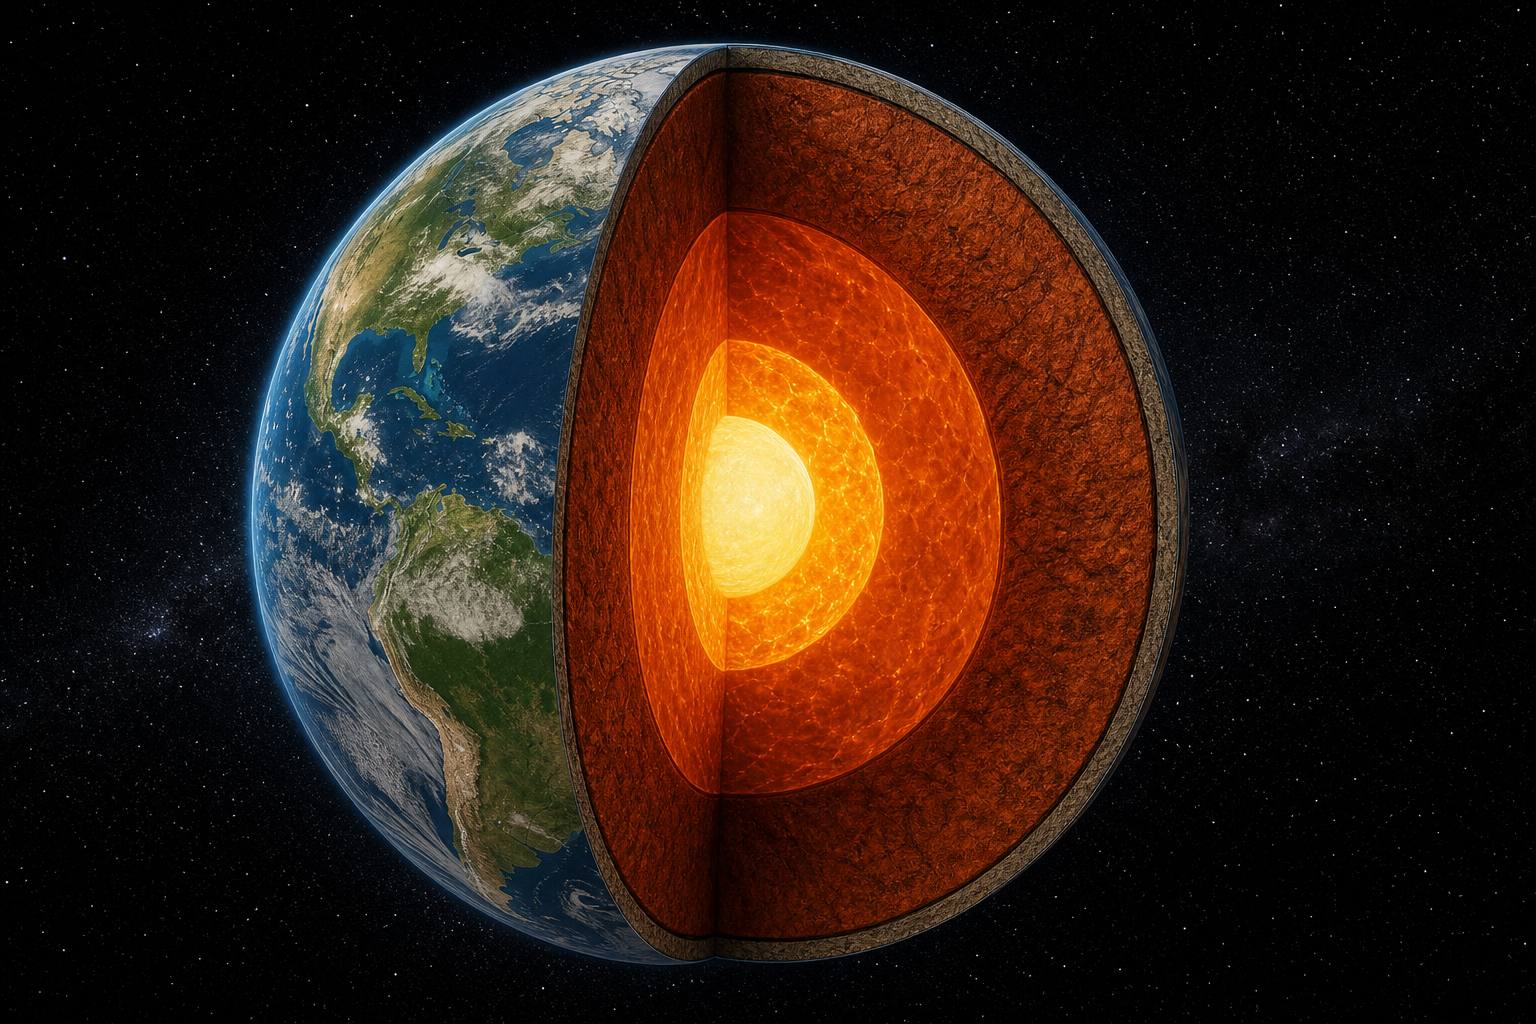
Picture the Earth cut open: a thin rocky crust, then the mantle, about two thousand nine hundred kilometres thick, then a metal core.
The mantle is hot, but it is not a sea of lava: it is solid rock, creeping a few centimetres a year.
Deep down, the crushing pressure keeps this hot rock from melting. Magma forms only where that changes: where the pressure drops, or where water lowers the melting point.
cm a year of slow flow, about as fast as a fingernail grows
The mantle (AMNH)
pressure drops while the rock stays hot
water is added, lowering the melting point
typically only about 10% of the rock melts
Where magma forms (Earle)
Chapter I · A solid planet
A solid mantle that flows
The American Museum of Natural History describes the mantle as about 2,900 km thick and mostly solid rock. Over long times it is ductile and flows slowly by convection, moving roughly 2 to 3 cm a year. Magma forms by partial melting of rock in the upper mantle or crust (Earle, Physical Geology).
The 3D Earth, plates and volcano are simplified teaching models, not to scale; ground movements are exaggerated so they can be seen.
Earth's outer shell is broken into huge plates that slowly move. Where two plates pull apart, at mid-ocean ridges, hot mantle rises, the pressure on it drops, and part of it melts. That is decompression melting.
The same pressure drop melts rock above a hotspot, an unusually hot patch of mantle. Hawaii sits on one.
The second way is to add water. Where one plate dives beneath another, at a subduction zone, it carries water down into the hot mantle, and the water lowers the melting point, a bit like salt melting ice on a road. That is flux melting.
mid-ocean ridge: pressure drops
hotspot: pressure drops
subduction zone: water added
Three places, two ways
5.5
million years: oldest rocks on Kauai, far from the hotspot
<0.7
million years: oldest rocks on the Big Island, above it; the plate carries older islands away
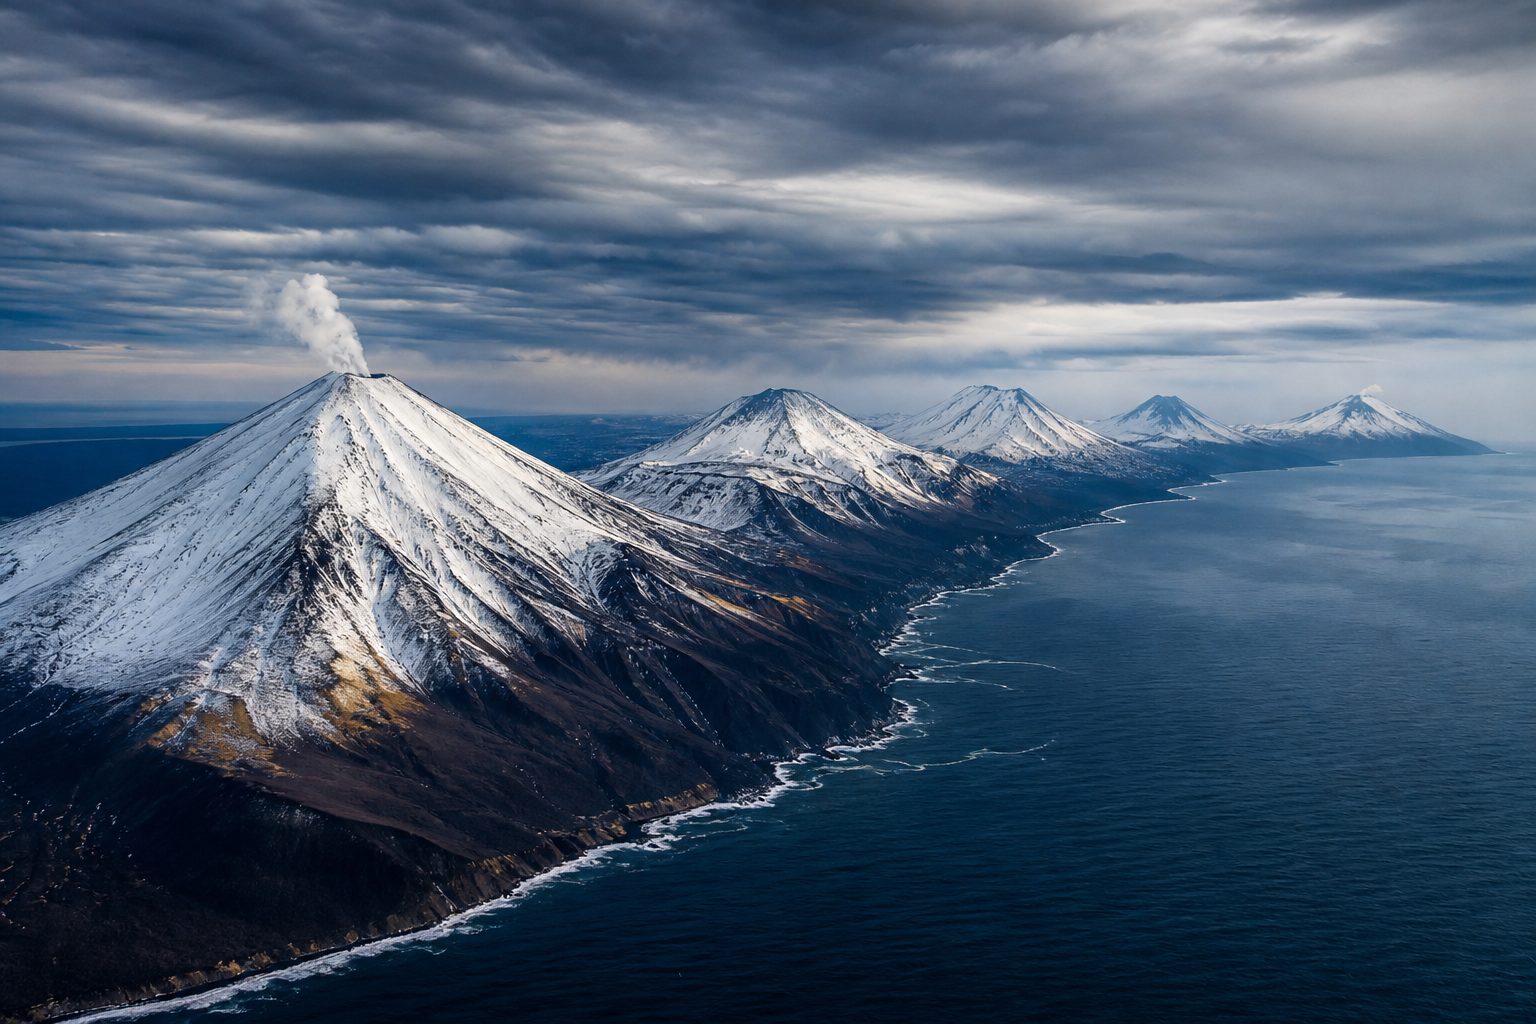
Hawaiian chain (USGS)A volcanic arc Above subduction zones, volcanoes line up in arcs parallel to the trench. AI-generated still.
~10%
of the rock melts, typically
lighter
than the rock around it, so the melt rises
Partial melting (Earle)
Chapter I · A solid planet
Decompression and flux melting
Earle’s Physical Geology: in decompression melting, rock rises and the pressure on it falls while its temperature stays about the same; this happens at mantle plumes (hotspots) and where the mantle wells up, as under spreading ridges. In flux melting, water added to hot rock lowers its melting temperature; at subduction zones the water comes from the subducting oceanic crust. Typically only about 10% of the rock melts, and the melt is richer in silica than its source. USGS: the Pacific Plate moves over the Hawaiian hotspot, so the islands get older to the north-west.
Later studies question whether hotspots are fixed and deep, as the simple plume model assumes (USGS).
The 3D Earth, plates and volcano are simplified teaching models, not to scale; ground movements are exaggerated so they can be seen.
Subduction zones circle the Pacific, and so do volcanoes. This belt, about forty thousand kilometres long, is the Ring of Fire, home to about three quarters of the world's volcanoes.
Southeast Asia sits on its western edge. Under Indonesia, where the Indo-Australian and Eurasian plates meet and one sinks beneath the other, about a hundred and thirty volcanoes are active.
40,000
km long, about (25,000 miles)
~75%
of the planet’s volcanoes
~90%
of the world’s earthquakes
Ring of Fire (National Geographic)A volcanic landscape Merapi on Java, Indonesia’s most active volcano, has erupted more than 80 times. AI-generated still.
127
active volcanoes (2012 count)
~5M
people living in danger zones
Indonesia (list of volcanoes)
Tambora, Sumbawa: 1815
Krakatau, Sunda Strait: 1883
Pinatubo, Luzon: 1991
Our neighbours in this film
Chapter I · A solid planet
The Ring of Fire
National Geographic: the Ring of Fire runs roughly 25,000 miles (about 40,000 km) around the Pacific, where plates meet; it holds an estimated 75% of the planet’s volcanoes and about 90% of its earthquakes. Indonesia’s volcanoes form at subduction zones between the Indo-Australian and Eurasian plates; the country had 127 active volcanoes as of 2012, with about 5 million people living within danger zones.
Volcano markers on the globe are placed approximately, for orientation only.
The 3D Earth, plates and volcano are simplified teaching models, not to scale; ground movements are exaggerated so they can be seen.
What happens next depends mostly on two things: how sticky the magma is, and how much gas is dissolved in it.
Stickiness, or viscosity, comes from silica, the compound that makes quartz sand and glass. It links into long tangled chains: the more silica, the stiffer the melt. Kīlauea's basalt is about fifty-two percent silica; the dacite of Mount Saint Helens in 1980, about sixty-four.
Magma also holds gas, mostly water vapour, dissolved under pressure like the gas in a sealed bottle of soda. As magma rises and the pressure falls, the gas comes out as bubbles.
viscosity: resistance to flow
gas content: how much can bubble out
The two controls (Oregon State, Volcano World)
52%
silica: Kīlauea basalt
0.5%
water: Kīlauea basalt
64%
silica: St. Helens dacite, 1980
4%
water: St. Helens dacite
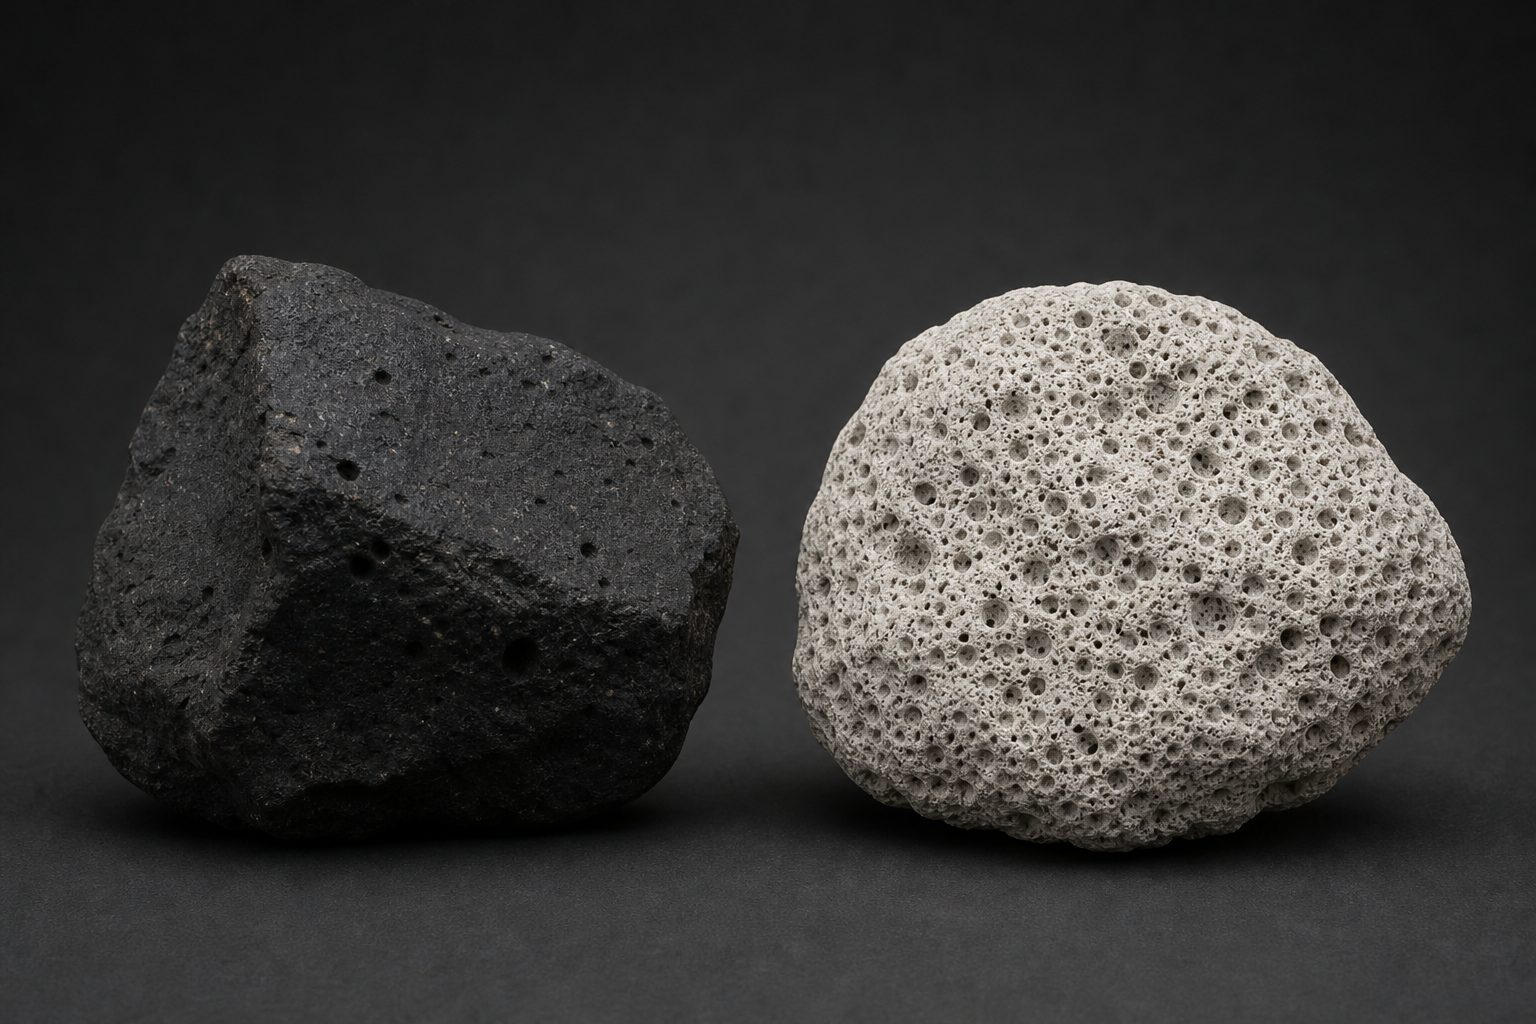
Two magmas (USGS)Frozen bubbles Dense basalt (left) and pumice (right), a rock that is mostly gas holes. AI-generated still.
Chapter II · Runny or sticky
Viscosity and gas
USGS Hawaiian Volcano Observatory: Kīlauea’s basalt has about 52% silica and about 0.5% water; Mount St. Helens’ 1980 dacite had roughly 64% silica and about 4% water. Silica molecules link into chains, so more silica means higher viscosity. Oregon State University’s Volcano World: viscosity and gas content are the two main factors; Hawaiian basalt carries about 0.5 weight percent gas, while viscous rhyolite can carry up to 7–8 percent.
The 3D Earth, plates and volcano are simplified teaching models, not to scale; ground movements are exaggerated so they can be seen.
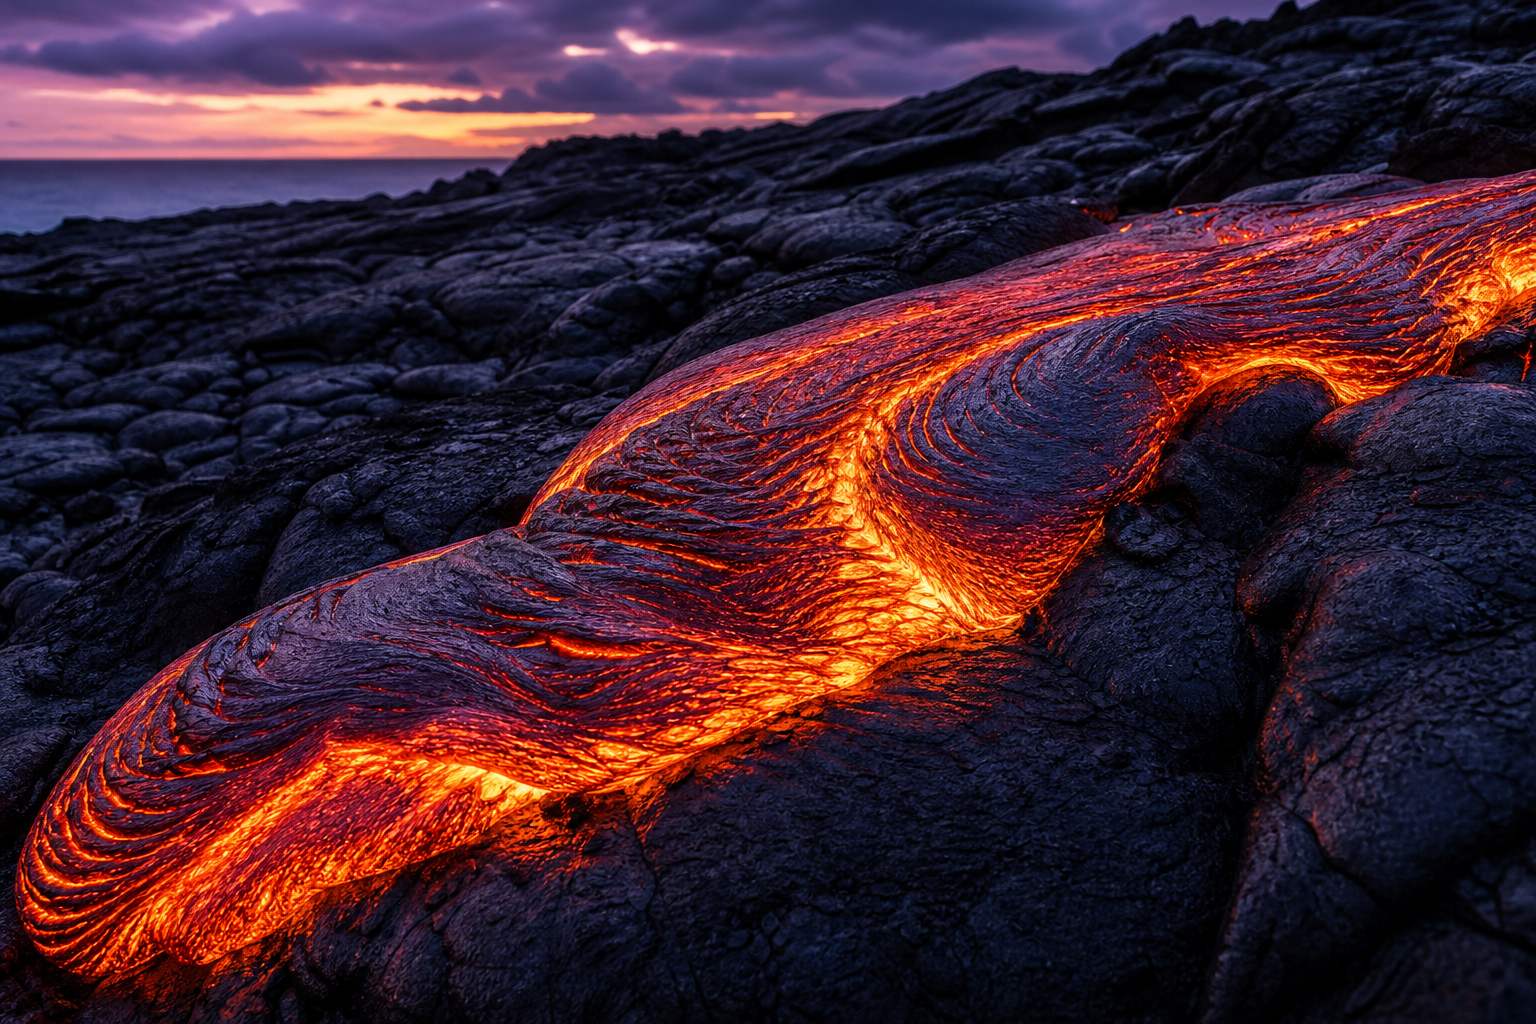
In runny basalt, bubbles escape easily, and lava pours out in fountains and rivers: a gentle, effusive eruption, the kind Hawaii is famous for.
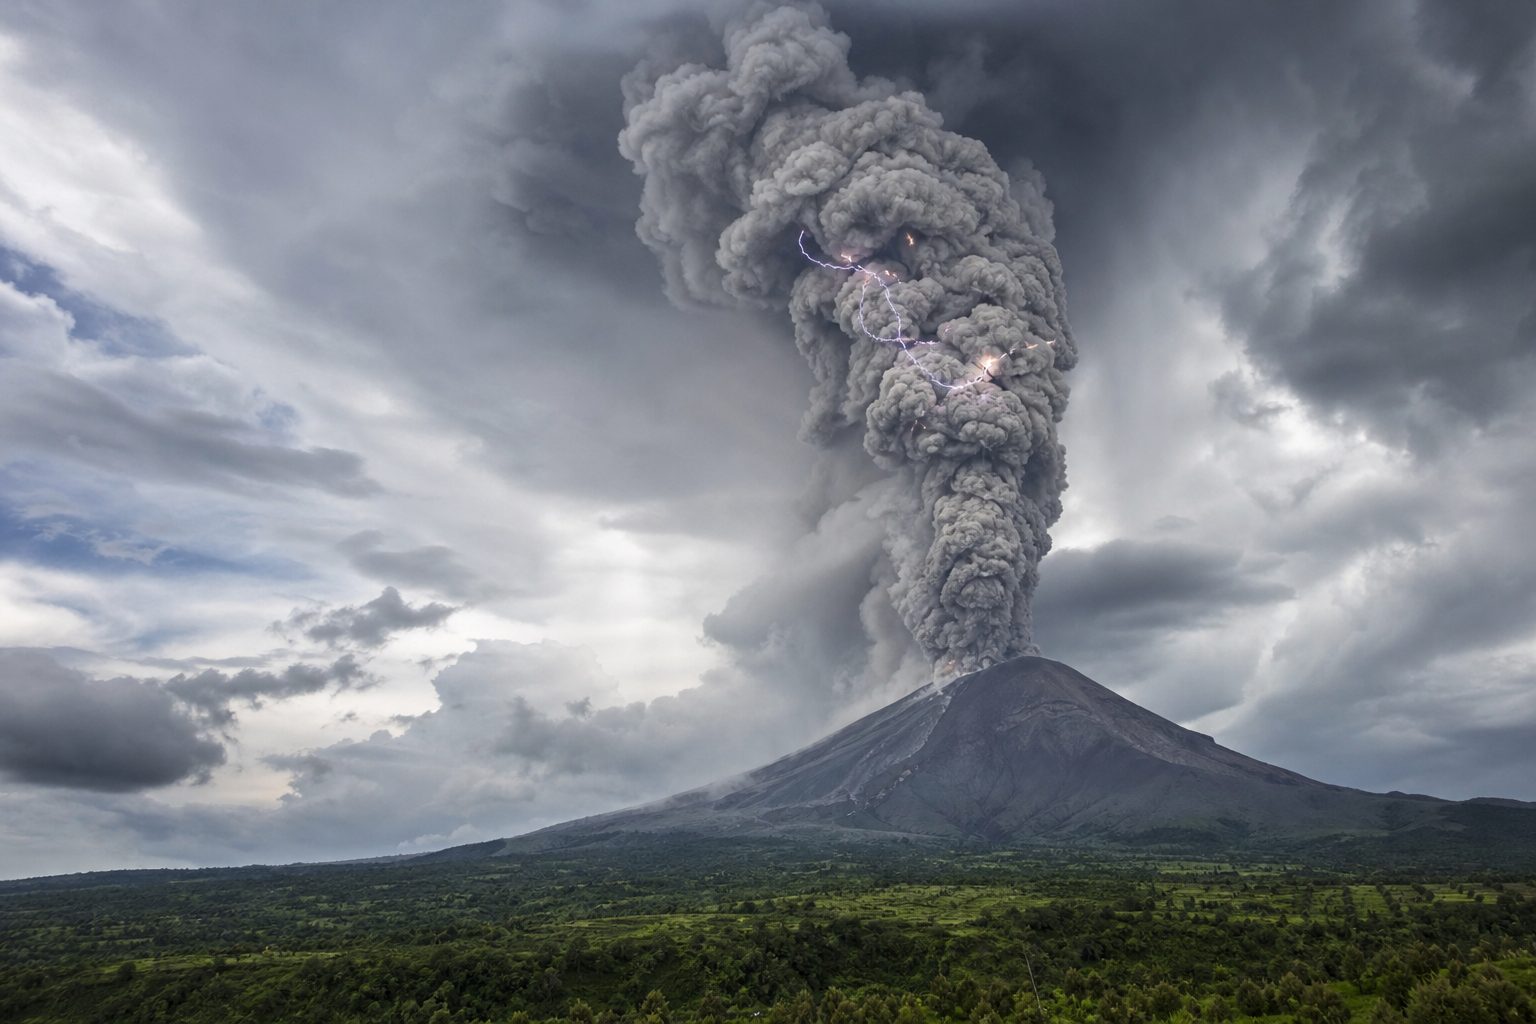
In sticky, gas-rich magma, the bubbles stay trapped until the magma nears the surface, then expand all at once and tear it into ash. That is an explosive eruption, like Mount Saint Helens in 1980.
Try it: set the silica and the gas, then erupt.
Effusive Pāhoehoe: basalt lava runny enough to form smooth, ropy skins. AI-generated still.Explosive Expanding gas shreds sticky magma into ash, carried kilometres up. AI-generated still.
Hawaiian basalt
~0.5%
Rhyolite, up to
7–8%
Gas dissolved in magma (Volcano World)
Chapter II · Runny or sticky
Effusive and explosive
USGS: in low-viscosity magma, gas bubbles rise easily and escape; in high-viscosity magma they get stuck and reach the surface at more than atmospheric pressure, and their expansion can shatter the magma into ash. Oregon State’s Volcano World: as the pressure drops, bubbles grow until they blow sticky magma into ash-sized fragments.
The mixer is a teaching toy: real eruptions also depend on temperature, crystals, water from outside and the shape of the vent.
The 3D Earth, plates and volcano are simplified teaching models, not to scale; ground movements are exaggerated so they can be seen.
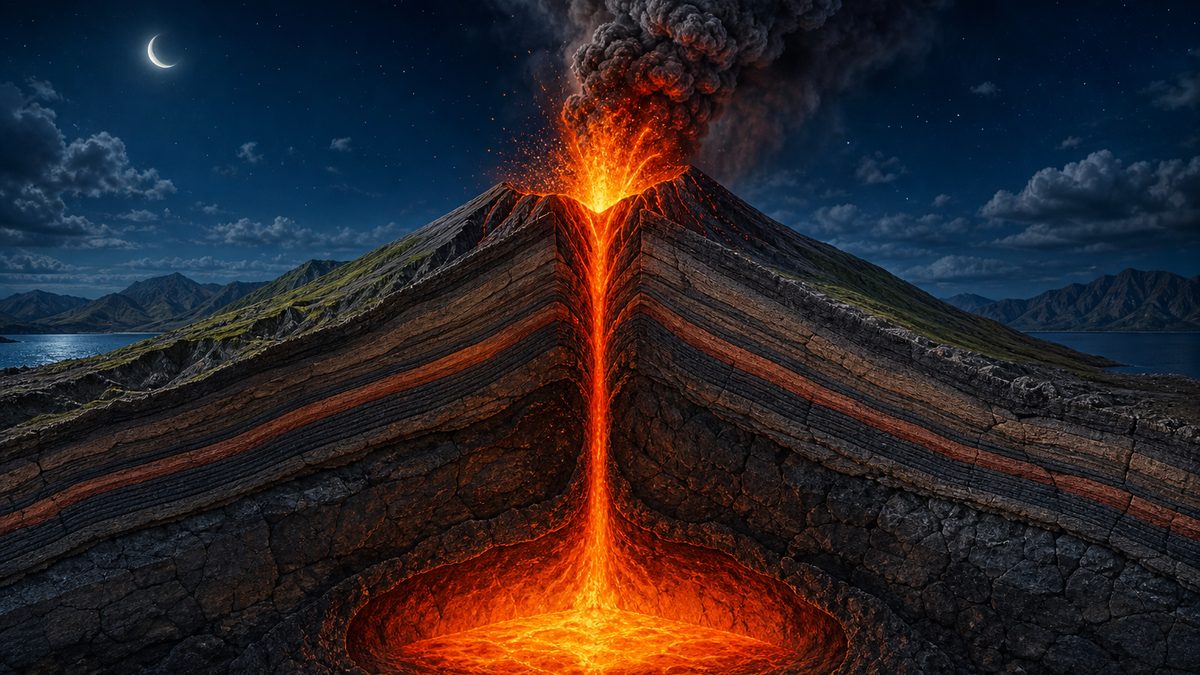
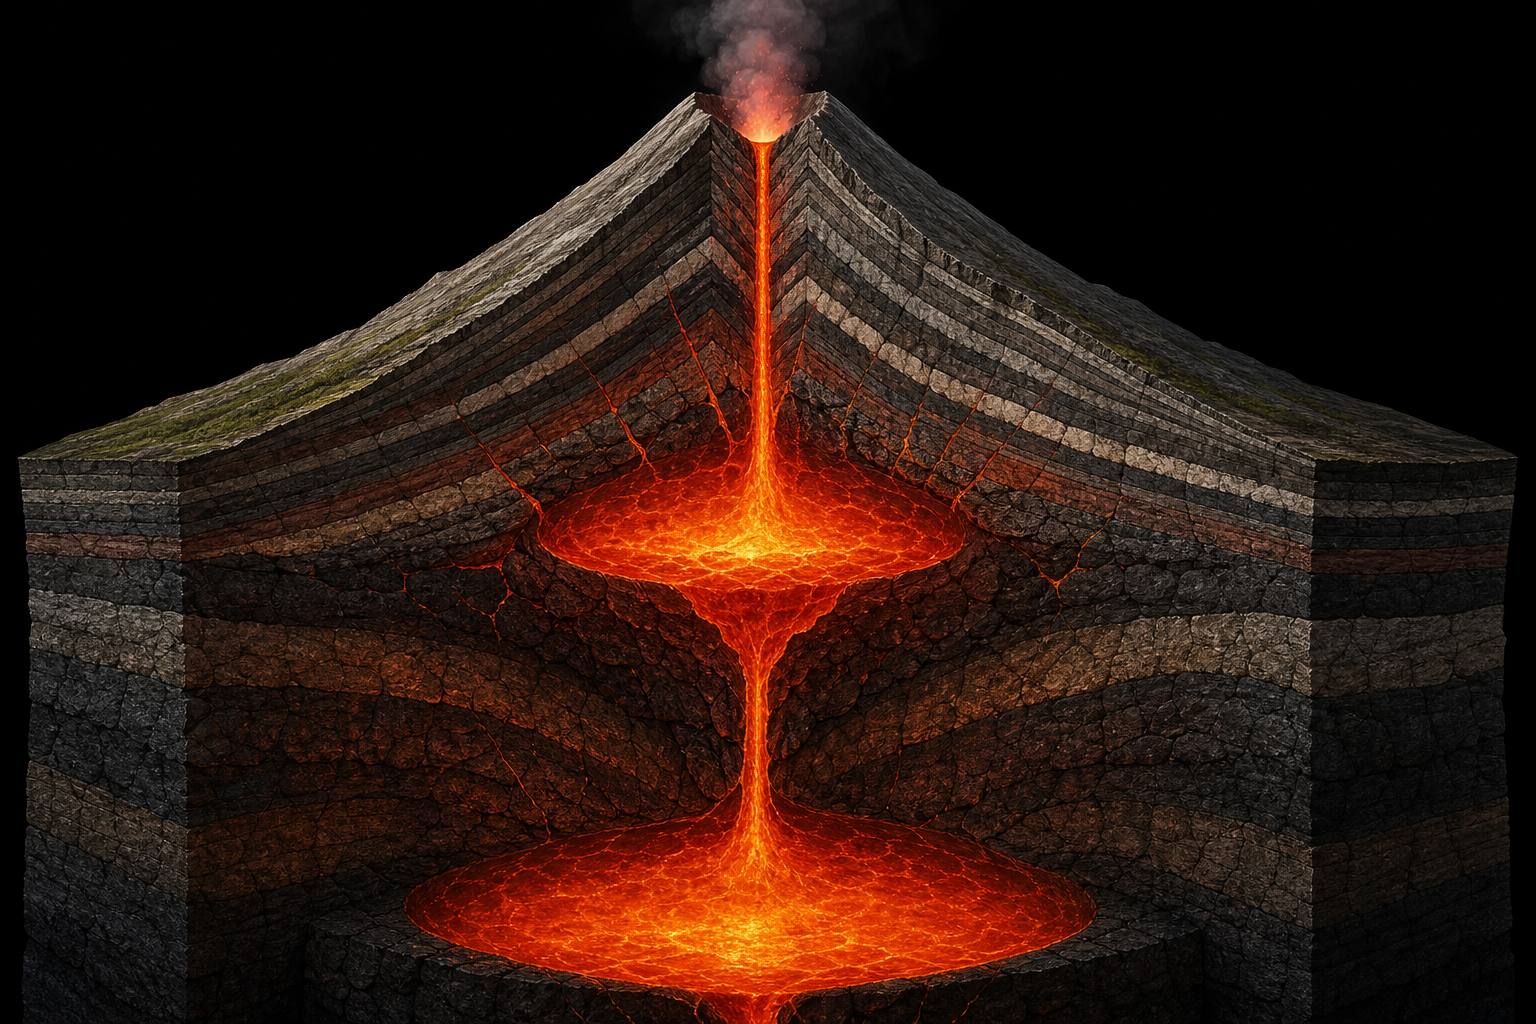
Magma is lighter than the rock around it, so it rises, but rarely straight to the surface. It gathers in the crust beneath the volcano, in magma chambers or reservoirs.
As fresh magma arrives, a chamber fills and the ground above swells slightly; when magma leaves, the ground sinks back.
A volcano can have more than one reservoir, at different depths, as scientists infer beneath Kīlauea's summit.
Inside a volcano An artist’s cutaway: stacked bodies of magma joined by a conduit. AI-generated still.
swells as magma or gas collects
sinks as it drains
often by only a few centimetres
What the ground does (USGS)
“interestingly similar to what is inferred at Kīlauea”Johnson et al., on Masaya’s two reservoirs (via ScienceAlert)
Chapter III · The chamber
Chambers and reservoirs
USGS Volcano Hazards Program: changes to a volcano’s surface, swelling, sinking or cracking, can be caused by magma, gas or water moving underground, and are often only a few centimetres or less. The Masaya study (Johnson et al., via ScienceAlert) interprets two magma sources and describes the arrangement as similar to what is inferred at Kīlauea.
In the model the swelling is hugely exaggerated so it can be seen.
The 3D Earth, plates and volcano are simplified teaching models, not to scale; ground movements are exaggerated so they can be seen.
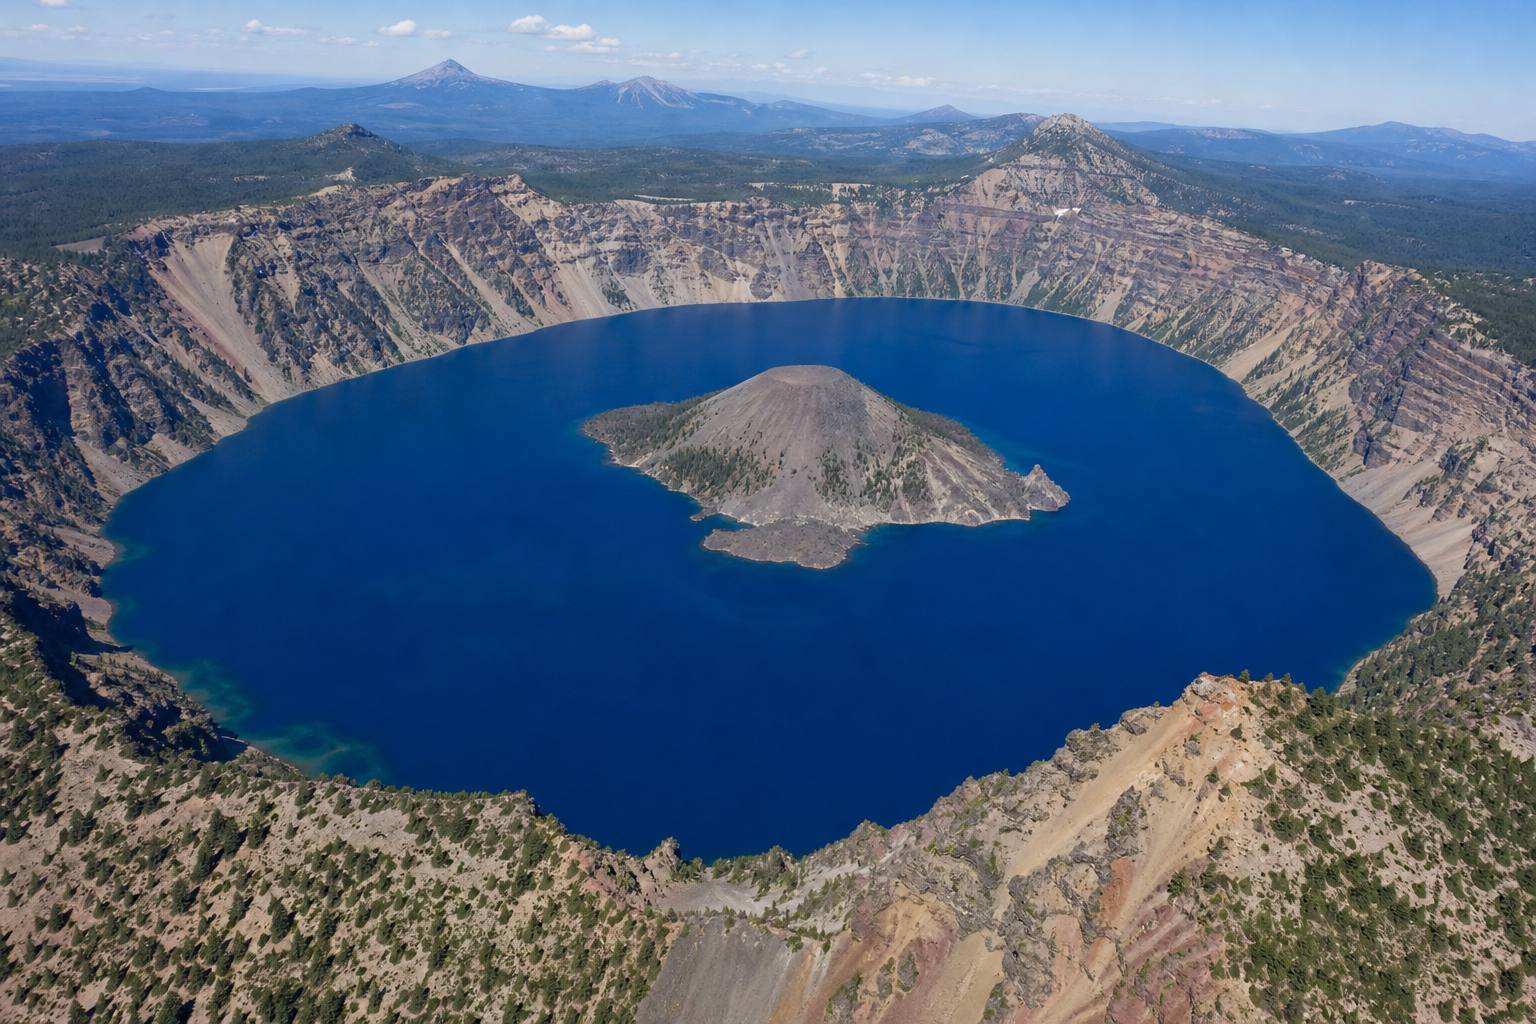
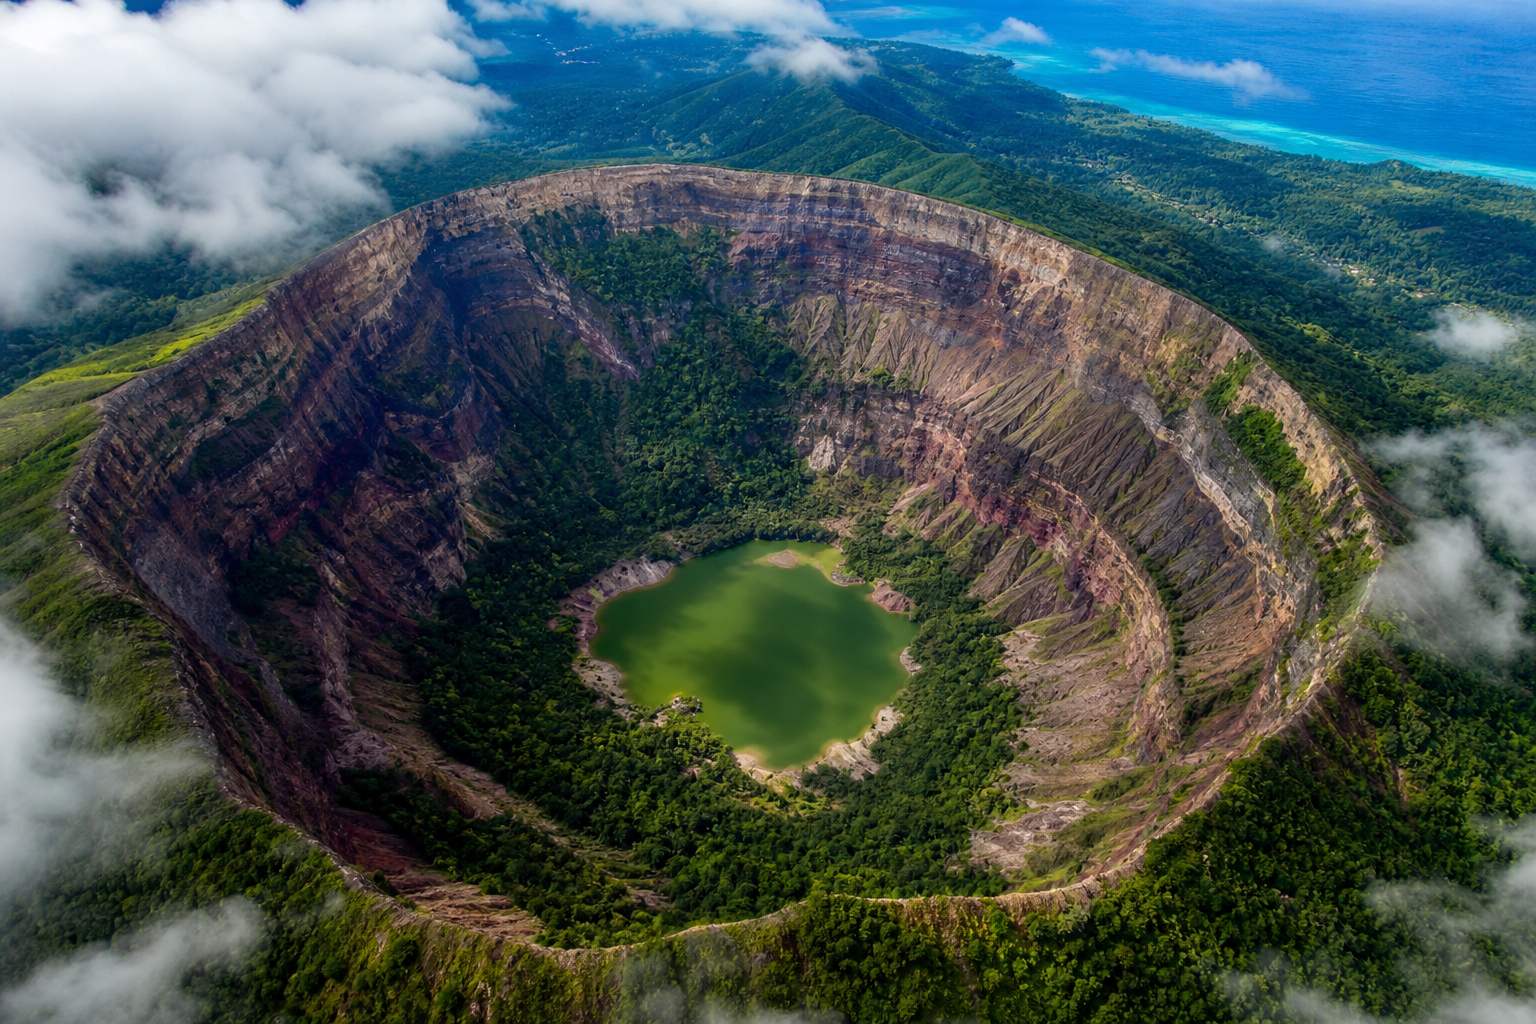
If a chamber empties quickly, the rock above loses its support and collapses. The result is a caldera, a collapse crater generally more than a kilometre across.
In 2018, as magma drained from beneath Kīlauea's summit, part of its caldera floor dropped more than five hundred metres. Masaya itself has calderas.
>1
km across: a caldera
<1
km, a few hundred metres: usually a crater
Caldera or crater? (USGS)A caldera lake A lake inside a collapsed summit, with a young cone rising from the water. AI-generated still.
>500
m: Kīlauea summit drop, 2018
70×45
km: Yellowstone caldera
Kīlauea and Yellowstone (USGS)
drain: the chamber shrinks, the summit sinks
refill: magma returns, the summit is rebuilt
In the model
Chapter III · The chamber
Calderas
USGS Yellowstone Volcano Observatory: a caldera is a large crater formed when a volcano’s magma chamber partly empties and the ground above collapses into the void; a collapse generally more than 1 km across is a caldera. In 2018 Kīlauea’s summit dropped more than 500 m, forming a smaller caldera within the larger one. Crater Lake formed when Mount Mazama’s summit collapsed about 7,700 years ago. Penn State notes Masaya has multiple overlapping craters and calderas.
The 3D Earth, plates and volcano are simplified teaching models, not to scale; ground movements are exaggerated so they can be seen.
The Volcanic Explosivity Index, proposed in 1982, rates explosive eruptions from zero to eight, mainly by how much material they throw out.
It is logarithmic, like the earthquake magnitude scale: each step means about ten times more material. Mount Saint Helens in 1980 scored five, about one cubic kilometre; Pinatubo in 1991 scored six, about ten.
volume of tephra (ash and rock fragments) thrown out: the main criterion
height of the eruption column: a secondary guide
not useful for gentle lava eruptions
What the VEI measures
0 – 8
the scale
×10
per step (except at the bottom)
The VEI (USGS, NPS)
VEI 4
~0.1
VEI 5
~1
VEI 6
~10
VEI 7
~100
Ash volume by VEI (USGS)
Mount St. Helens 1980: VEI 5
Vesuvius AD 79: VEI 5
Pinatubo 1991, Krakatau 1883: VEI 6
Tambora 1815: VEI 7
Examples
Chapter IV · How big, how deadly
The Volcanic Explosivity Index
USGS Yellowstone Volcano Observatory: the VEI was proposed in 1982 by Chris Newhall and Steve Self. Ash volume is a primary criterion, about 0.1 km³ for VEI 4, 1 km³ for VEI 5 and 10 km³ for VEI 6; each level is roughly ten times the one below, except at the bottom of the scale. Mount St. Helens 1980 is VEI 5 and Pinatubo 1991 VEI 6. The National Park Service: the scale runs from 0 to 8, Hawaiian-style effusive eruptions are rated 0, and it is not useful for effusive lava eruptions. Column height is a secondary guide; the USGS gives Hunga Tonga-Hunga Haʻapai (2022) a preliminary VEI 5. VEI 5 for Vesuvius, 6 for Krakatau and 7 for Tambora are from the Wikipedia articles listed.
The cubes are drawn to scale with each other (each edge about 2.15 times the last), not to any real landscape.
The largest eruption in recorded history was Tambora, in Indonesia, in April 1815, with a VEI of seven.
The mountain lost about a third of its height. Estimates of the dead range from about ten thousand killed directly to seventy thousand or more including famine and disease.
In 1883, Krakatau, between Java and Sumatra, exploded with a VEI of six. It was heard nearly five thousand kilometres away, and its tsunamis caused most of the roughly thirty-six thousand deaths.
VEI 7
largest in recorded history
37–45
km³ of magma, counted as solid rock (no gas holes)
Tambora, 10 April 1815A giant caldera Tambora’s caldera is 6–7 km wide and 600–700 m deep; the peak fell from about 4,300 m to 2,851 m. AI-generated still.Krakatau, 27 August 1883 Heard on Rodrigues, an island near Mauritius, about 4,800 km away. AI-generated still.
36,417
deaths (official toll)
~10%
of them from pyroclastic flows (hot ash avalanches, next)
Krakatau
Chapter IV · How big, how deadly
Tambora 1815, Krakatau 1883
Tambora reached its climax on 10 April 1815 with a VEI of 7, erupting 37–45 km³ of dense-rock equivalent (the magma counted as solid rock); Wikipedia also notes that around 100 km³ of rock was blasted into the air, the bulk volume the VEI looks at; the peak dropped from about 4,300 m to 2,851 m, leaving a caldera 6–7 km across and 600–700 m deep. Death estimates range from about 10,000 direct deaths (Zollinger, 1855) to at least 71,000 in total (Oppenheimer, 2003). National Geographic calls it the largest eruption in recorded history. Krakatau’s climax came on 27 August 1883 (VEI 6); the blast was heard on Rodrigues, about 4,800 km away. The official toll was 36,417; about 10% died in pyroclastic flows, and UC Santa Barbara attributes the bulk of the deaths to the tsunamis.
The 3D Earth, plates and volcano are simplified teaching models, not to scale; ground movements are exaggerated so they can be seen.
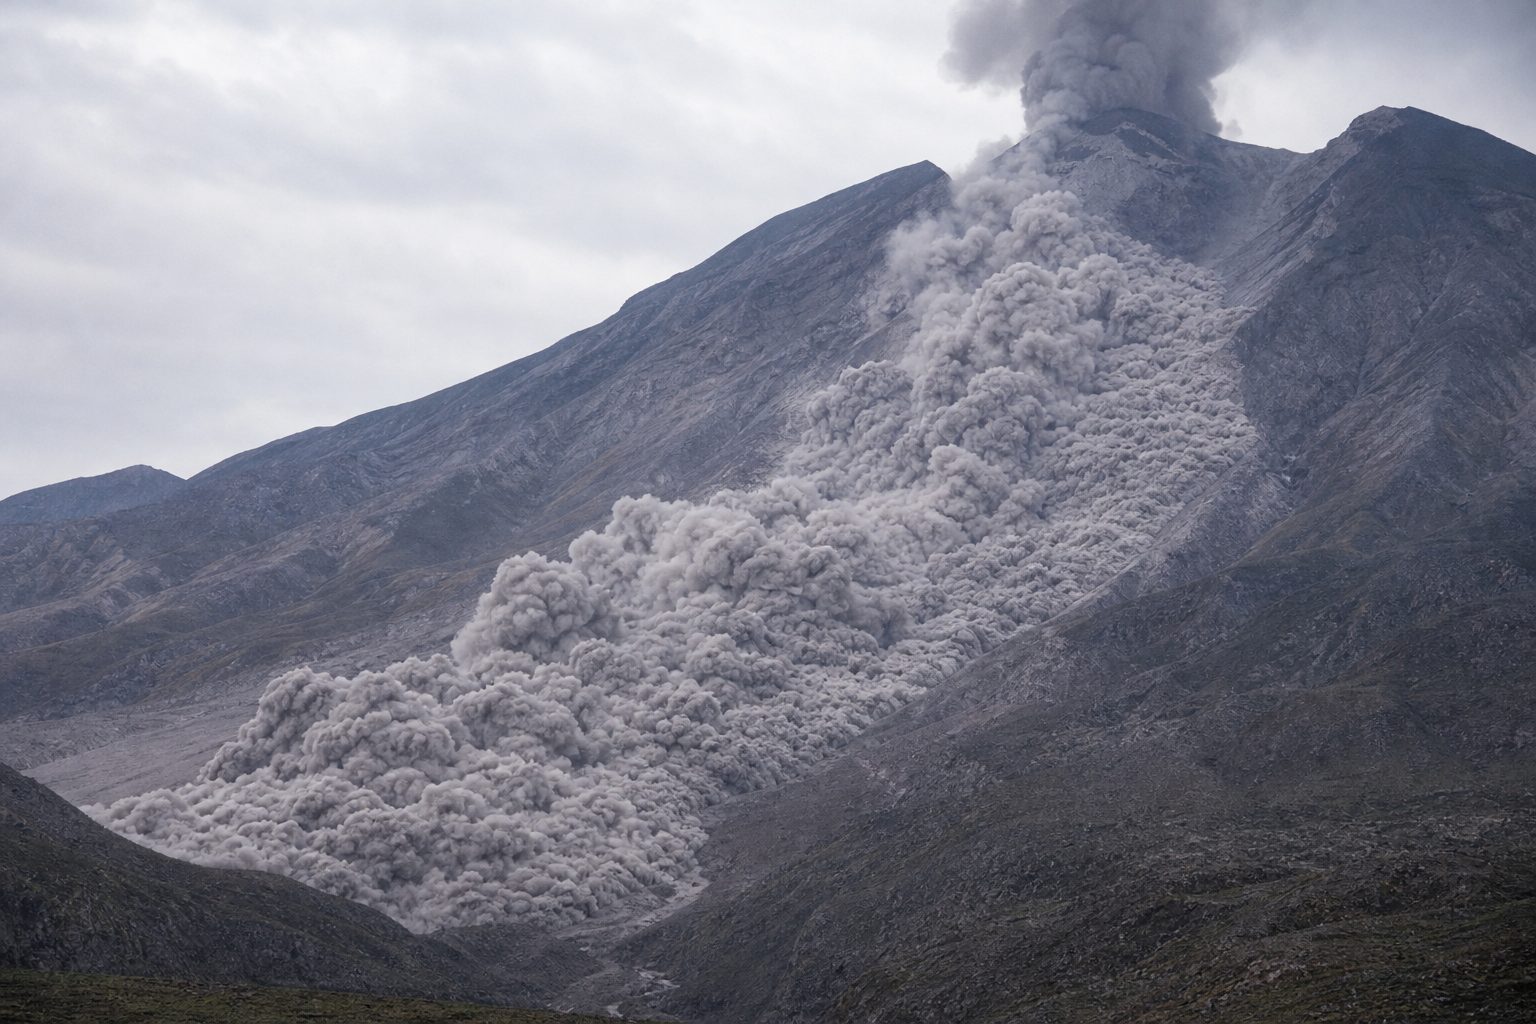
Among the deadliest dangers is the pyroclastic flow, an avalanche of hot ash, rock and gas that can race downhill at well over a hundred and fifty kilometres an hour.
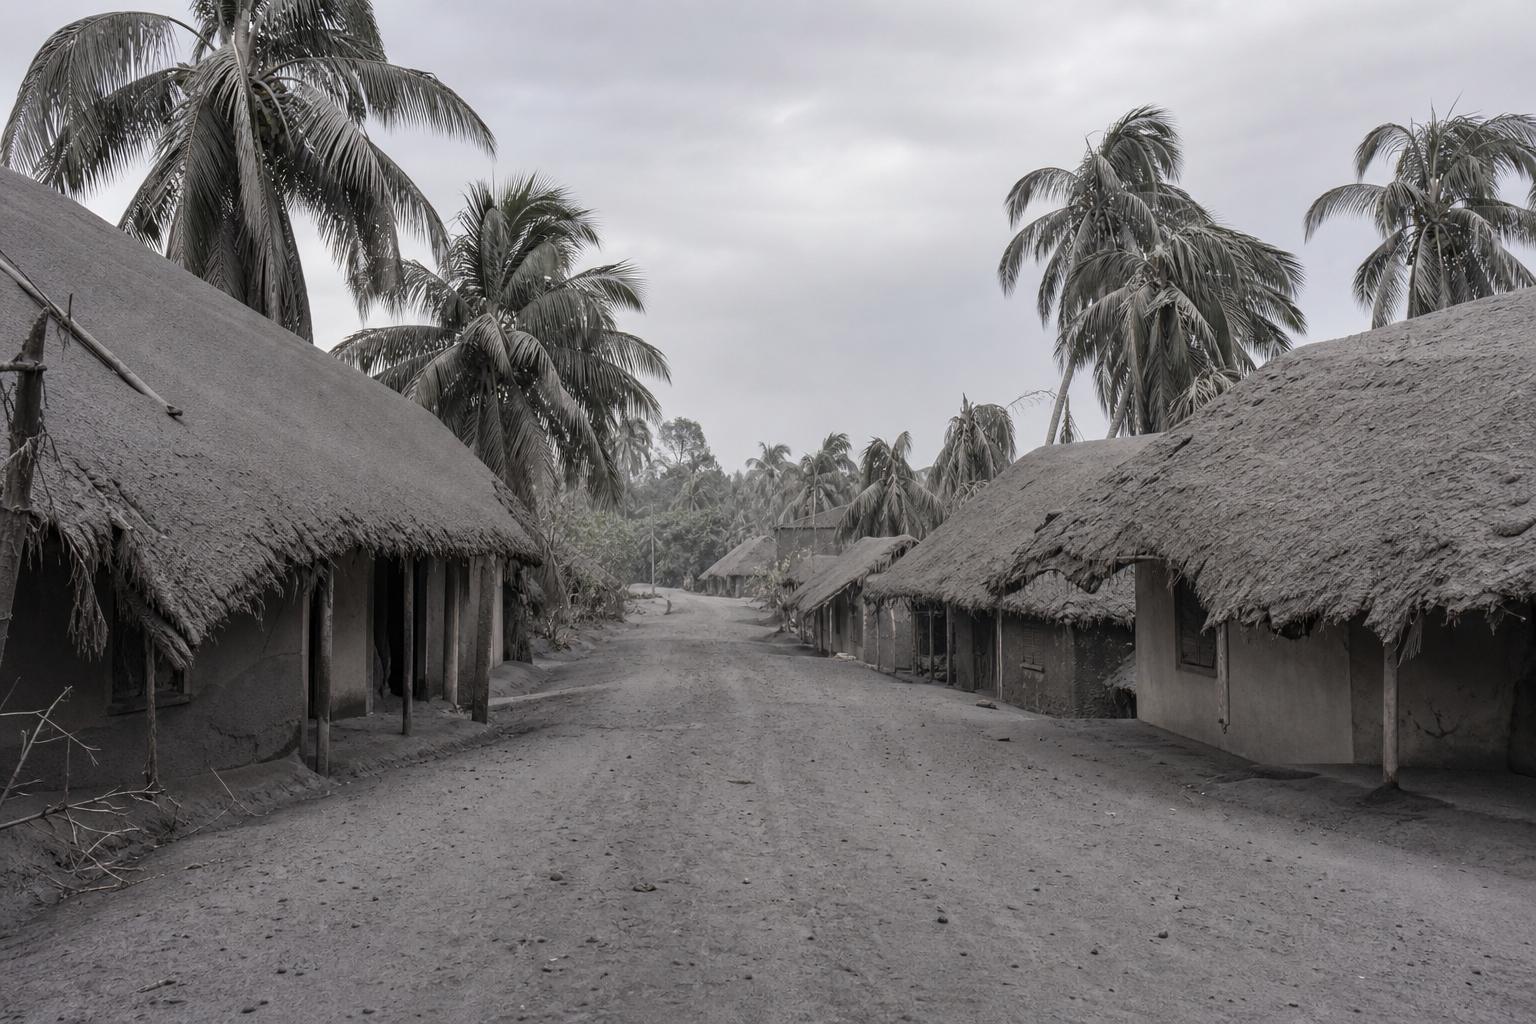
Falling ash is another danger. When Pinatubo erupted in 1991, more than eight hundred and forty people died, most when roofs collapsed under wet ash.
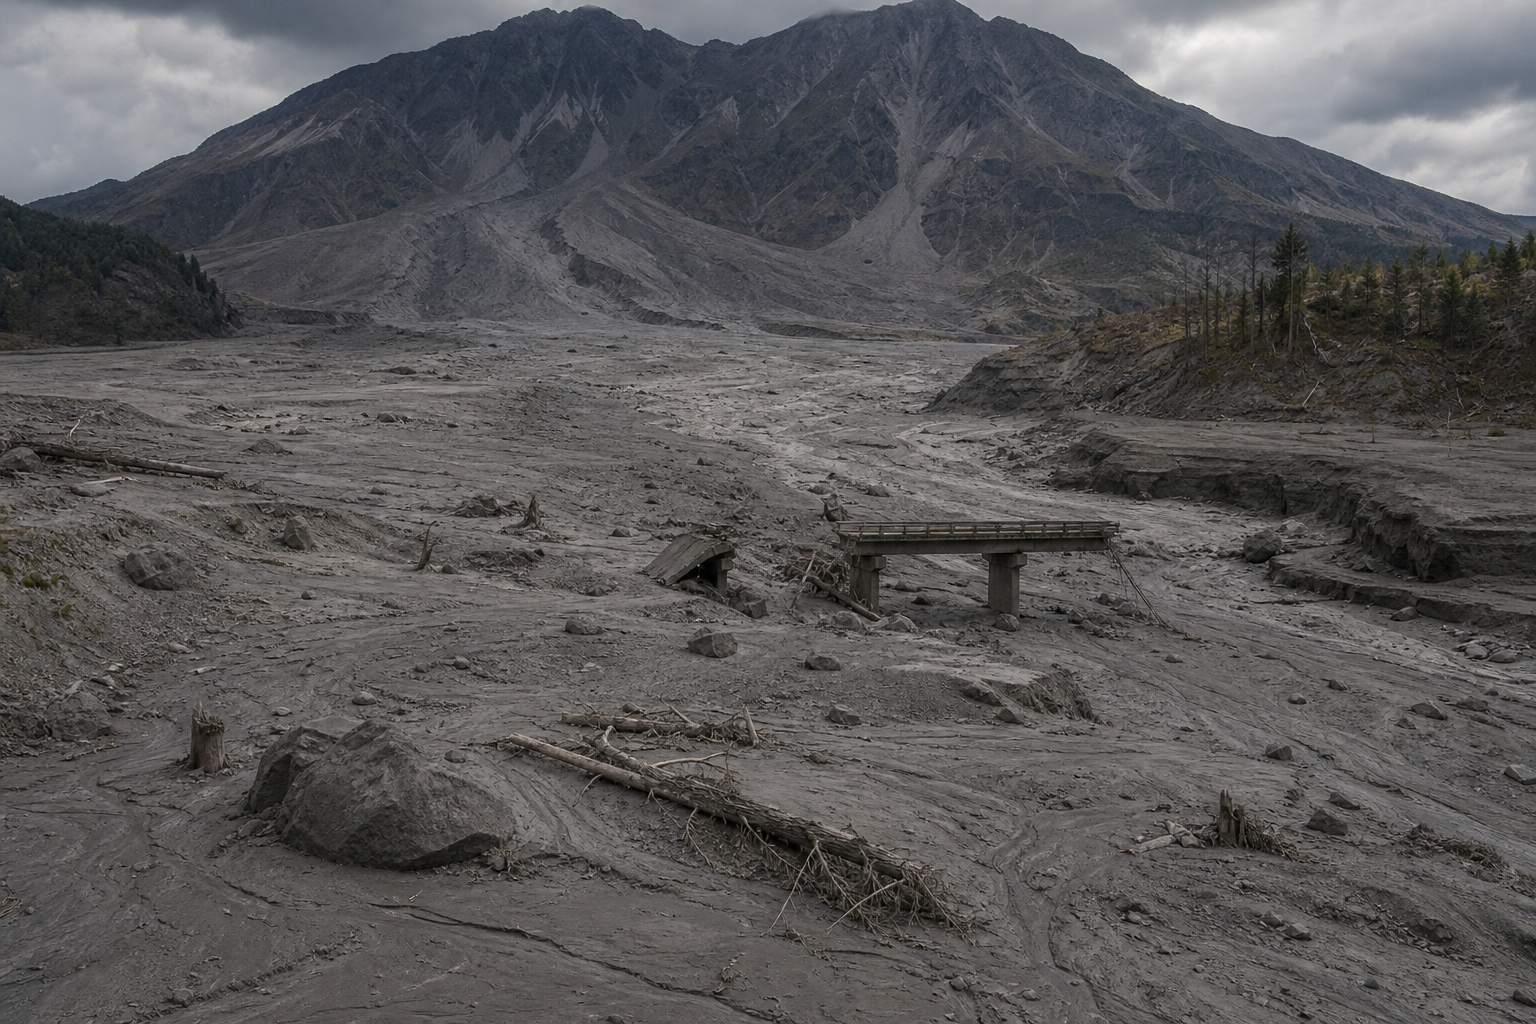
Rain can turn loose ash into lahars, mudflows that travel tens of kilometres down river valleys and have historically been among the deadliest hazards of all. Gases such as carbon dioxide and sulfur dioxide can poison the air.
A pyroclastic flow Up to about 800 °C (USGS). Flows and surges like this killed most victims at Pompeii and Herculaneum in AD 79. AI-generated still.Ashfall Ash is tiny shards of rock and volcanic glass; wet, it is heavy enough to break roofs. AI-generated still.After a lahar Lahars can carry 60–90% rock debris by weight, move at 30–65 km/h and run more than 80 km. AI-generated still.
CO₂ is heavier than air and can pool in low ground
SO₂ makes acid rain
around Masaya, SO₂ often exceeds WHO air-quality standards
Volcanic gases (USGS, ScienceAlert)
Chapter IV · How big, how deadly
Volcano hazards
USGS Fact Sheet 002-97: historically, lahars have been one of the deadliest volcano hazards; pyroclastic flows can be as hot as 1,500 °F and move at 100 to 150 miles an hour; lahars move at 20 to 40 miles an hour, can travel more than 50 miles and may carry 60–90% rock debris by weight; carbon dioxide is heavier than air and can collect in low areas at deadly concentrations, and sulfur dioxide forms acid rain. At Vesuvius in AD 79, pyroclastic surges killed most victims at Pompeii and Herculaneum (date traditionally 24 August; some scholars argue for autumn). USGS: at Pinatubo on 15 June 1991 more than 840 people died, mostly from roofs collapsing under wet ash.
The 3D Earth, plates and volcano are simplified teaching models, not to scale; ground movements are exaggerated so they can be seen.
The biggest eruptions also cool the climate. Pinatubo pushed about fifteen million tons of sulfur dioxide into the stratosphere, the calm layer above the weather. There it became a haze of acid droplets that reflected sunlight, and the global average temperature fell by about six tenths of a degree.
After Tambora the cold was worse: in 1816, June frosts struck parts of North America, crops failed, and it became the Year Without a Summer.
15
million tons of sulfur dioxide
10–50
km up: the stratosphere
Pinatubo’s haze (NASA)
−0.6
°C, global average surface temperature (1 °F)
15
months after the eruption
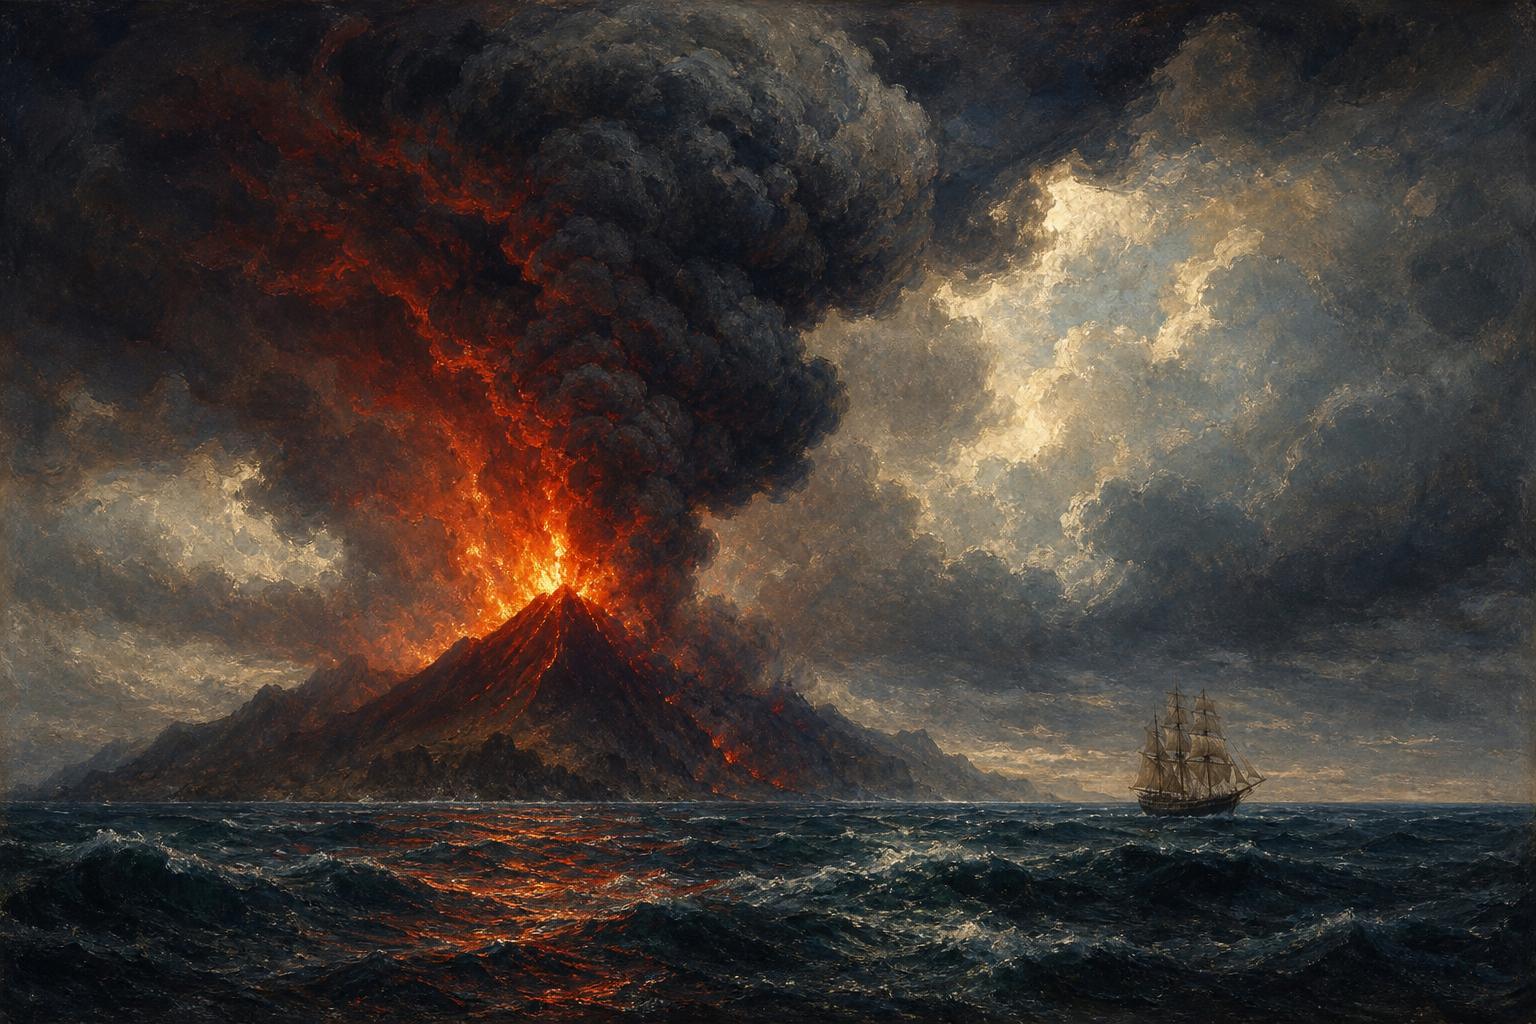
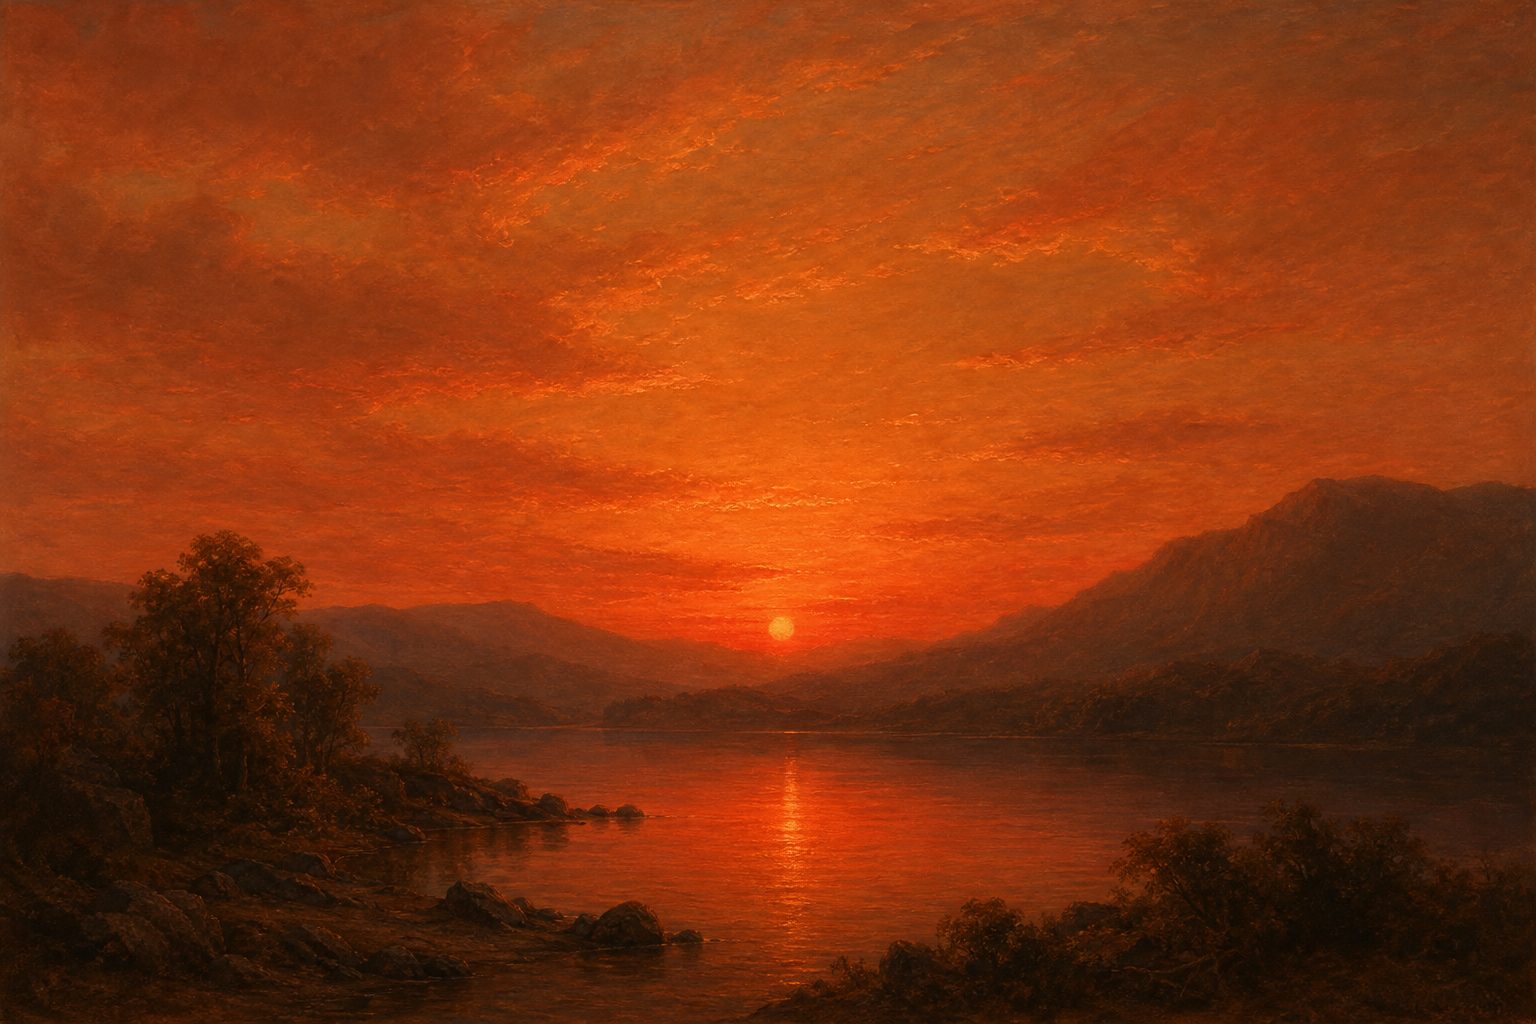
Global cooling (NASA)Volcanic skies A painting-style scene of a hazy red sunset, the kind of sky people described after big eruptions. AI-generated still.
Apr 1815 Tambora erupts
Jun 1816 summer frost in North America
Jun 1991 Pinatubo erupts
1991–92 global average about 0.6 °C cooler within 15 months
Two cold spells
Chapter IV · How big, how deadly
Eruptions and climate
NASA Earth Observatory: Pinatubo injected about 15 million tons of sulfur dioxide into the stratosphere, where it formed a haze of sulfuric acid droplets; over about two years the plume covered virtually the entire globe, and the average global surface temperature fell by about 1 °F (0.6 °C) over the following 15 months. USGS: in parts of Europe and North America 1816 was known as “the year without a summer”. Estimates of Tambora’s global cooling vary between studies, so the film gives no single figure.
The spreading veil on the globe is schematic.
The 3D Earth, plates and volcano are simplified teaching models, not to scale; ground movements are exaggerated so they can be seen.
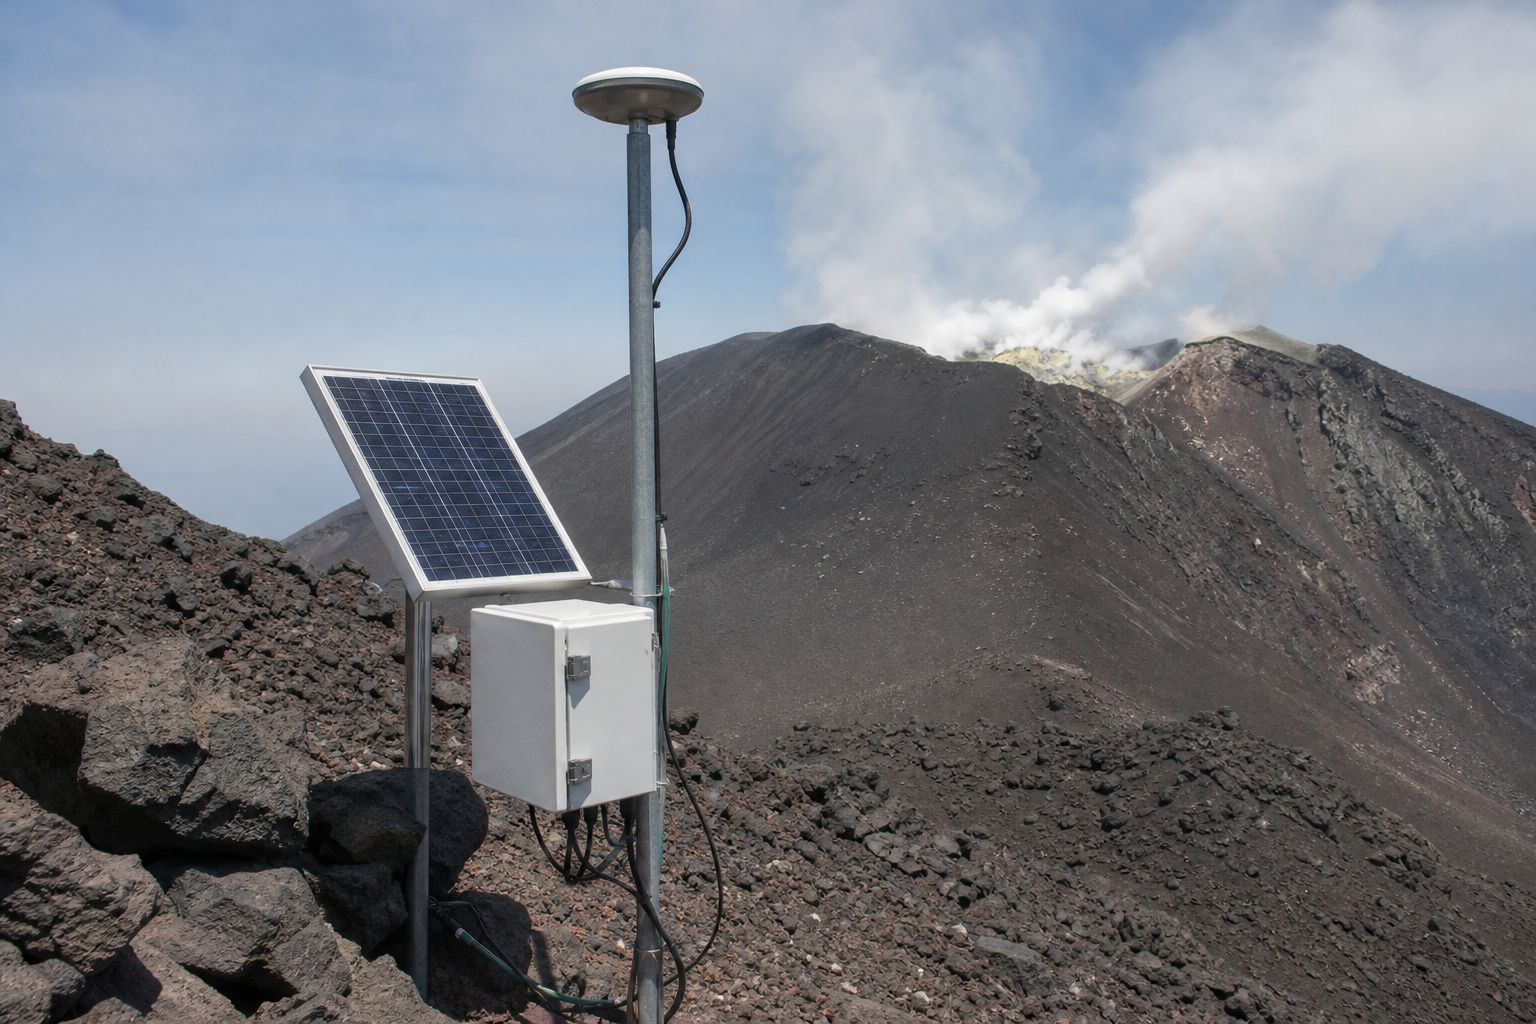
Scientists watch for three warning signs: swarms of small earthquakes, picked up by seismometers; the ground swelling, measured by tiltmeters and GPS; and changes in the gases rising from the magma.
Before Pinatubo's great eruption in June 1991, scientists used these tools to forecast it. Tens of thousands of people were evacuated, and the U.S. Geological Survey says more than five thousand lives were saved.
Even so, forecasts give weeks or months of warning, not an exact day.
earthquake swarms: magma on the move
swelling and tilt: a chamber gaining pressure
changing gas: SO₂ and CO₂
Three warning signs (Earle)A monitoring station A GPS antenna and a solar-powered sensor box on a volcano’s flank. AI-generated still.
>60,000
people evacuated
>5,000
lives saved (USGS)
7
telemetered seismic stations
2
tiltmeters
Pinatubo, 1991 (USGS, EOS Singapore)
months to weeks of warning, not days
a sudden drop in earthquakes may mean magma has stalled, not that it is over
Limits (Earle)
Chapter V · Watching a volcano
Monitoring a volcano
Earle’s Physical Geology: seismometers are the cheapest way to watch a volcano, and swarms of small quakes suggest magma is moving; tiltmeters and GPS reveal a swelling chamber; changes in gas composition (SO₂, CO₂) matter; eruption potential can be estimated months to weeks ahead, not days. USGS: before the 15 June 1991 climax at Pinatubo, USGS and PHIVOLCS installed seven telemetered seismic stations and two tiltmeters and measured SO₂ with a COSPEC; their work saved more than 5,000 lives and $250 million in property. The Earth Observatory of Singapore notes that more than 60,000 people were evacuated from within 30 km.
The 3D Earth, plates and volcano are simplified teaching models, not to scale; ground movements are exaggerated so they can be seen.
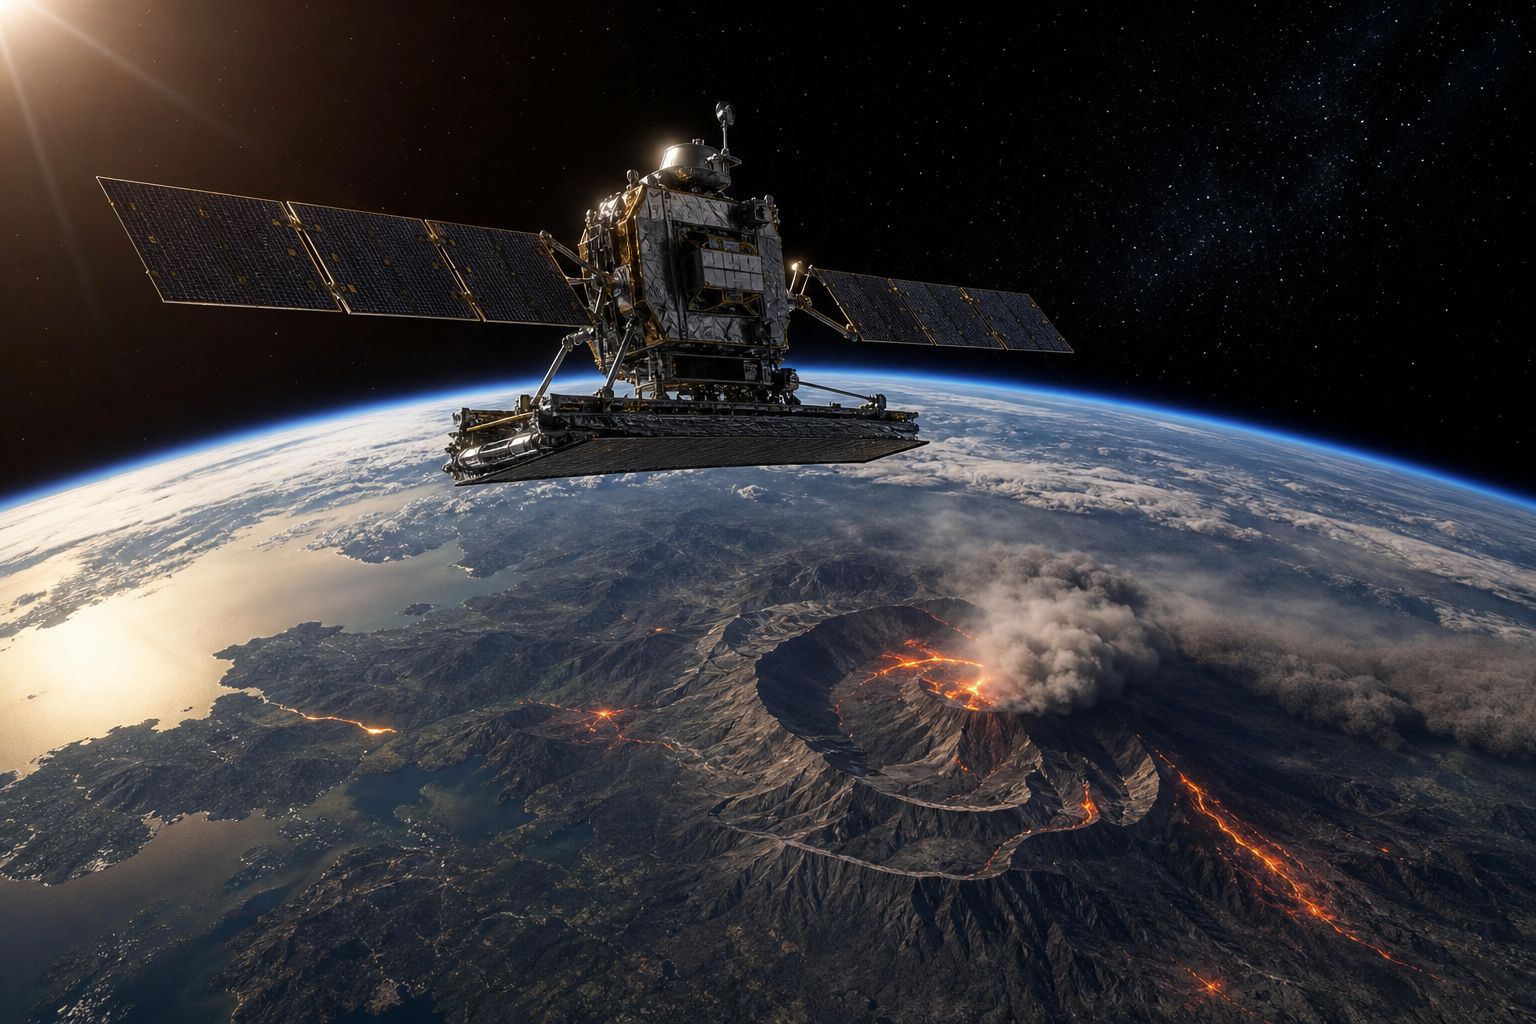
Satellites help too. A radar satellite such as Sentinel-1 passes over Masaya about every twelve days and measures its distance to the ground very precisely, even through cloud.
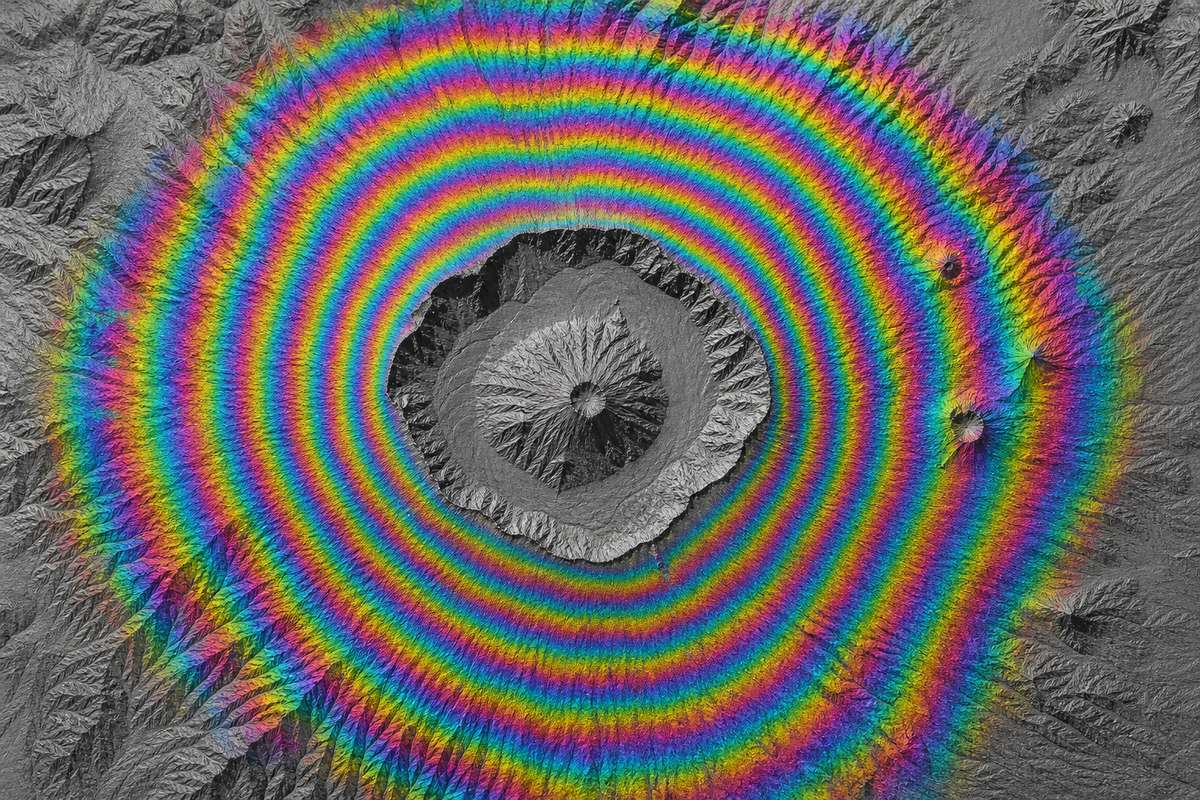
Comparing two passes gives an interferogram: rings of colour where the ground moved. Going once through the colours, from one ring to the next, means about two point eight centimetres of movement toward or away from the satellite.
That is how the Masaya team saw one area sink and rise while the crater kept sinking. Fill and drain the two reservoirs yourself, and watch the rings change.
A radar satellite Radar brings its own signal, so it works at night and through cloud. AI-generated still.An interferogram More rings packed together means more movement in that place. AI-generated still.
2.8
cm toward or away from the satellite, per colour cycle
~12
days between passes over Masaya
InSAR, Sentinel-1 (colour scale from USGS)
caldera ground: sank, then rose
around Santiago crater: kept sinking
reading: a deep reservoir filling, a shallow one draining
Masaya, 2018–2024 (Penn State)
Chapter V · Watching a volcano
InSAR
Penn State: Sentinel-1 observes Masaya about once every 12 days, and interferometric synthetic aperture radar (InSAR) detects tiny changes in ground elevation, even through cloud. USGS: in an interferogram, each colour cycle represents 2.8 cm of range change, the change in distance between the satellite and the ground. Between 2018 and 2024 the caldera ground at Masaya first subsided and then rose, while the ground around the Santiago crater kept sinking, which the authors interpret as a deeper reservoir receiving magma and a separate, shallower one losing it.
The rings in the model come from a simple textbook model of a swelling or shrinking point source; their spacing and the reservoir positions are illustrative, not Masaya’s real ones.
The 3D Earth, plates and volcano are simplified teaching models, not to scale; ground movements are exaggerated so they can be seen.
For now, the Masaya team sees no sign of immediate danger. Every twelve days or so a satellite passes over again and measures, so that the people living beside the volcano would have time to leave if that changes.
1815 Tambora, VEI 7
1883 Krakatau, VEI 6
1982 the VEI is proposed
1991 Pinatubo forecast and evacuated
2018 Kīlauea’s summit collapses
2026 two reservoirs suggested at Masaya
Milestones in this filmStill breathing All stills and illustrations in this film are AI-generated; none shows a real event.
melt
rise
gather
erupt
watch
A volcano in five words
Epilogue · Sources
How volcanoes work
Magma formation, the role of silica and gas, magma chambers, calderas, the VEI, volcanic hazards, climate effects and monitoring are established volcanology, described by the USGS, NASA, universities and open textbooks. The Masaya result is one new study, reported here as its authors describe it.
The 3D Earth, plates and volcano are simplified teaching models, not to scale. All stills are AI-generated. The Earth texture is NASA Blue Marble imagery.