PlanetPast
EN

Technology · Physics

How the Power Grid Works

The Machine That Never Stops Balancing

On 13 October 2026 the US Department of Energy issued an emergency order for the PJM grid, which serves more than 67 million people, as above-normal October temperatures were forecast during autumn maintenance. This film explains the machine behind the plug: how Edison's first power station of 1882 gave way to alternating current and transformers, why power travels at hundreds of thousands of volts, how a grid must match supply and demand every instant and why its frequency is the signal that shows it, what happens when a power station trips, how the Iberian Peninsula went dark in April 2025, how solar power reshapes the daily curve, and why data centres are adding new demand.

Interactive 3D film9 min1882 to 2026Published 30 October 2026

Watch the interactive filmRead in ไทย

Prologue

Technology · Physics

The machine that never stops balancing

How a power grid works, and how it fails.

Every second, a power grid must make exactly as much electricity as people are using. In mid-October 2026, that balance came under strain in the eastern United States.

Above-normal temperatures were forecast just as many power stations were shut for maintenance. On the thirteenth, the Department of Energy issued an emergency order for PJM, the grid operator for more than sixty-seven million people.

PJM warned that it might need every generator running at full output. Why not just store extra power for a hot day? Because storing electricity in bulk is still hard, so a grid makes it at the moment it is used.
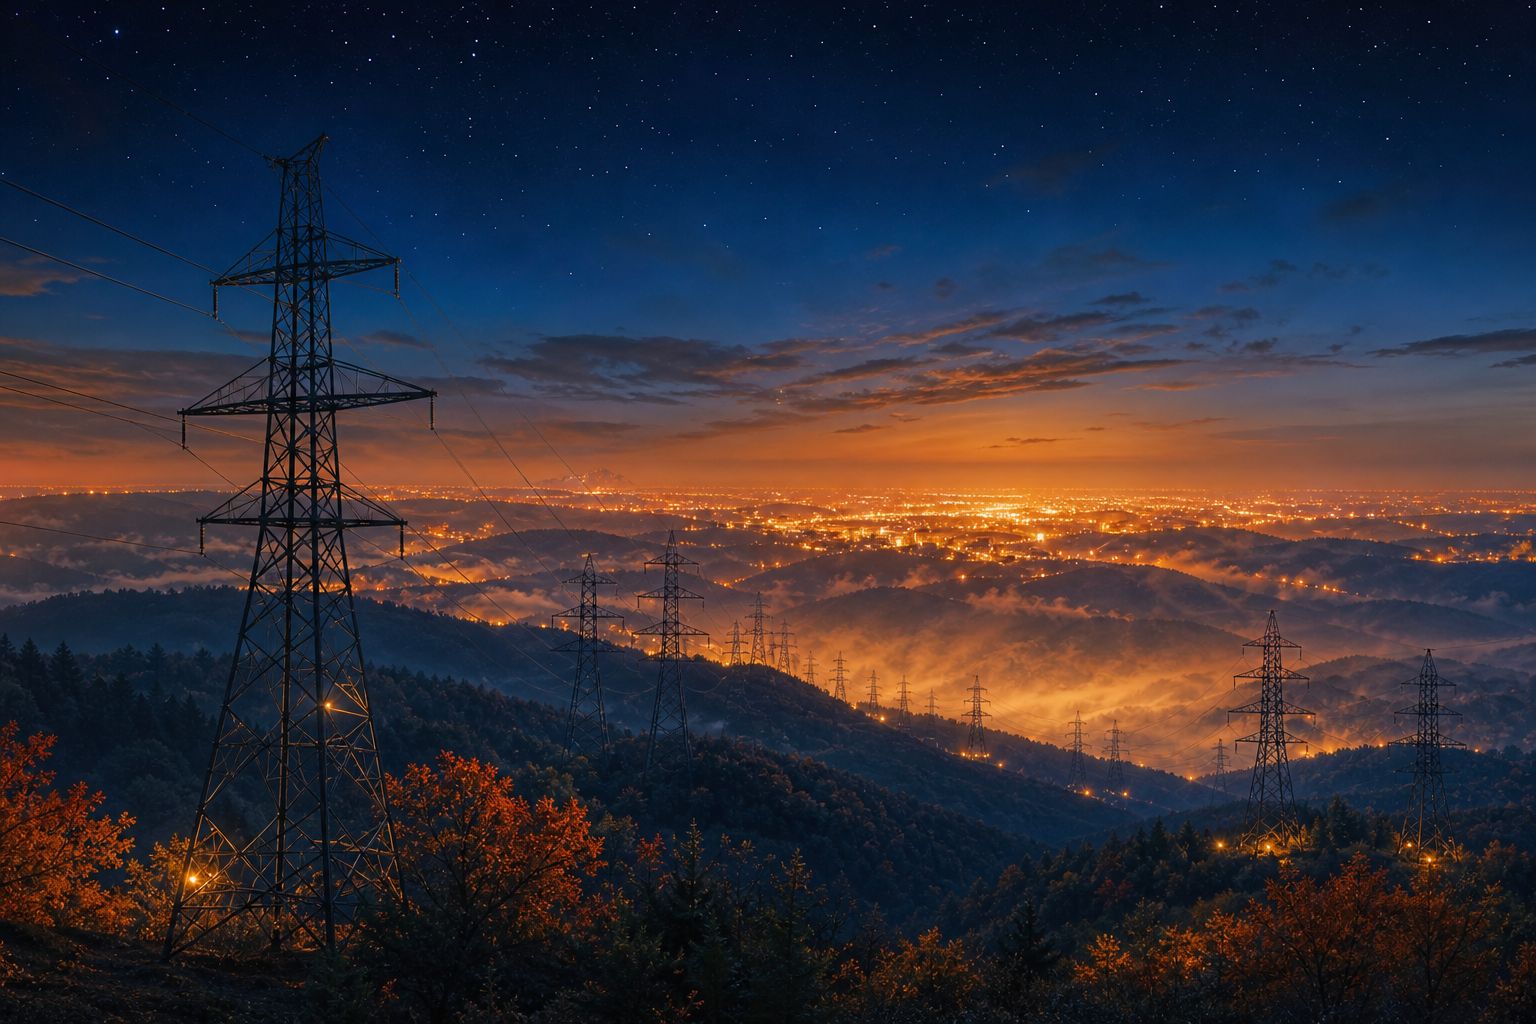
An October strain Transmission lines running toward a city. AI-generated still.
13–16 Oct
2026, under Section 202(c) of the Federal Power Act
67 million+
people served by PJM, in 13 states and D.C.
The emergency order
  • From Edison’s street to a continent
  • Why power travels at high voltage
  • The balance, and the frequency that shows it
  • Blackouts, solar power and data centres
In this film
Prologue

An emergency order in October

Potomac Local: the Energy Department issued the order on 13 October 2026 under Section 202(c) of the Federal Power Act, after a request from PJM on 11 October, citing high demand, autumn generator maintenance and scheduled transmission outages; it ran to 16 October. The National: PJM issued a maximum generation alert for 13 and 14 October, citing above-normal temperatures, and was told to ask data centres and other large customers to switch to back-up generation if necessary. PJM: more than 67 million people in 13 states and the District of Columbia.

The 3D grid is a simplified teaching model: distances, heights and the number of towers are not to scale, and the flowing lights show the direction of power, not real electrons.

Sources: Potomac Local (13 Oct 2026): Energy Secretary issues emergency order for the Mid-Atlantic grid; The National (13 Oct 2026): emergency order by US to “prevent blackouts” could affect data centres; PJM annual report 2025: PJM by the numbers
Chapter I · From one street to a continent

Chapter I

From one street to a continent

The first power station, and its limit.

The first grids were tiny. In 1882 Thomas Edison opened the Pearl Street Station in New York, one of the world's first central power stations.

It made direct current, which flows one way, at low voltage. Low-voltage power loses too much on long wires, so the station could serve only about one square mile of lower Manhattan.

Lighting a whole city that way would have taken a great many such stations, yet Edison stayed committed to direct current.

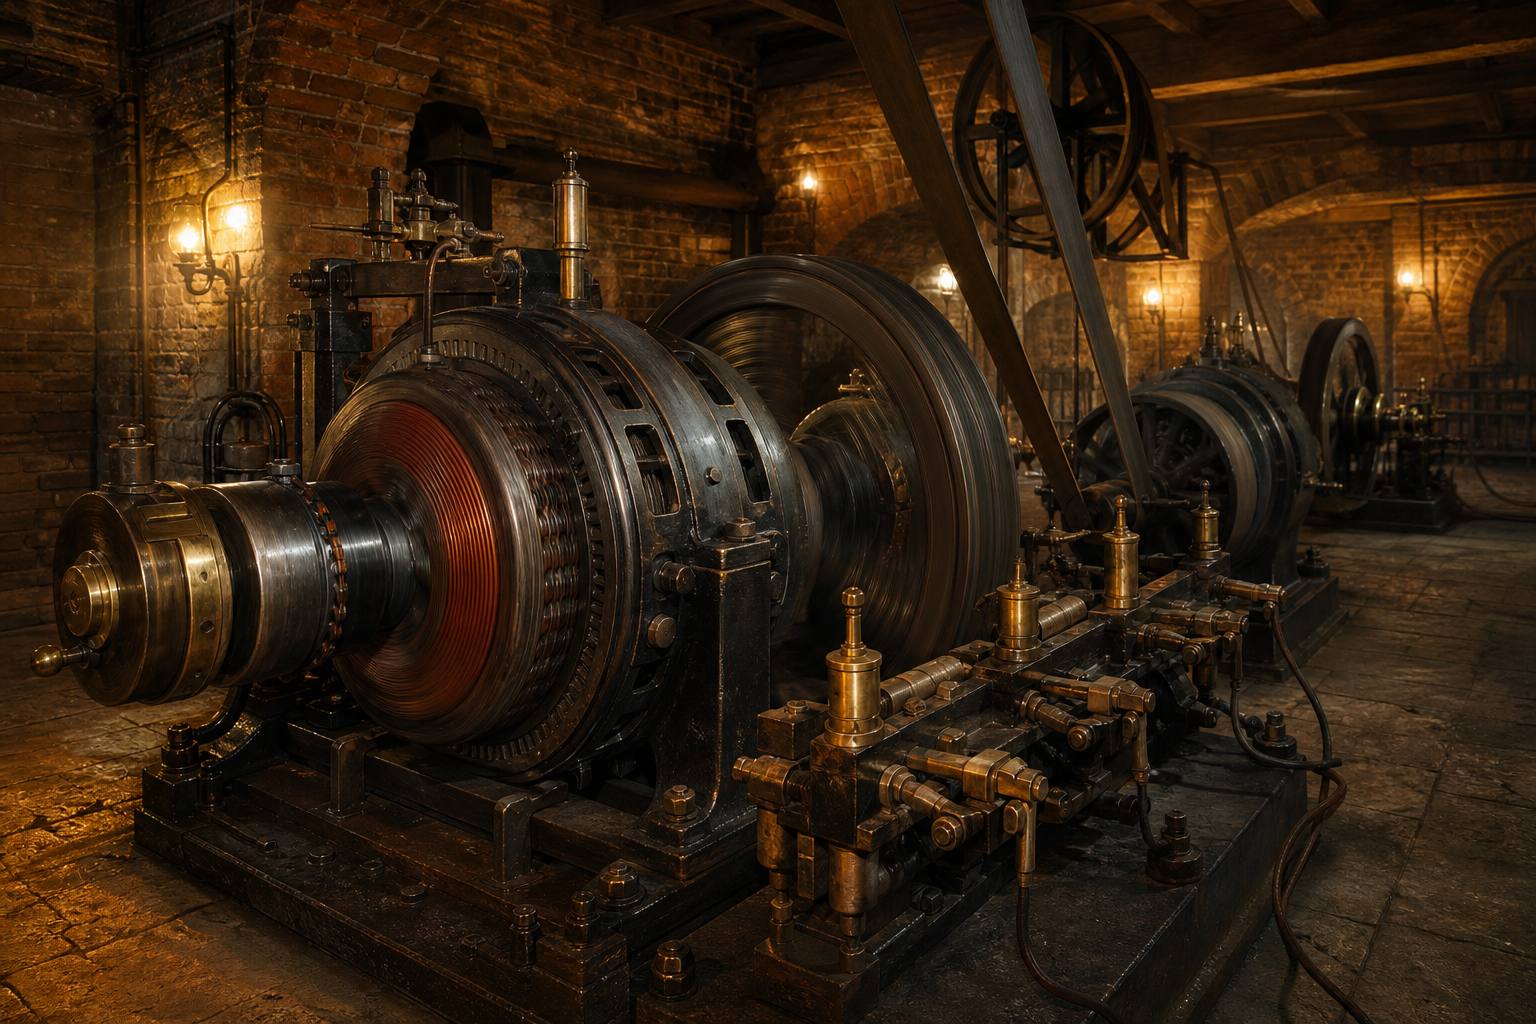
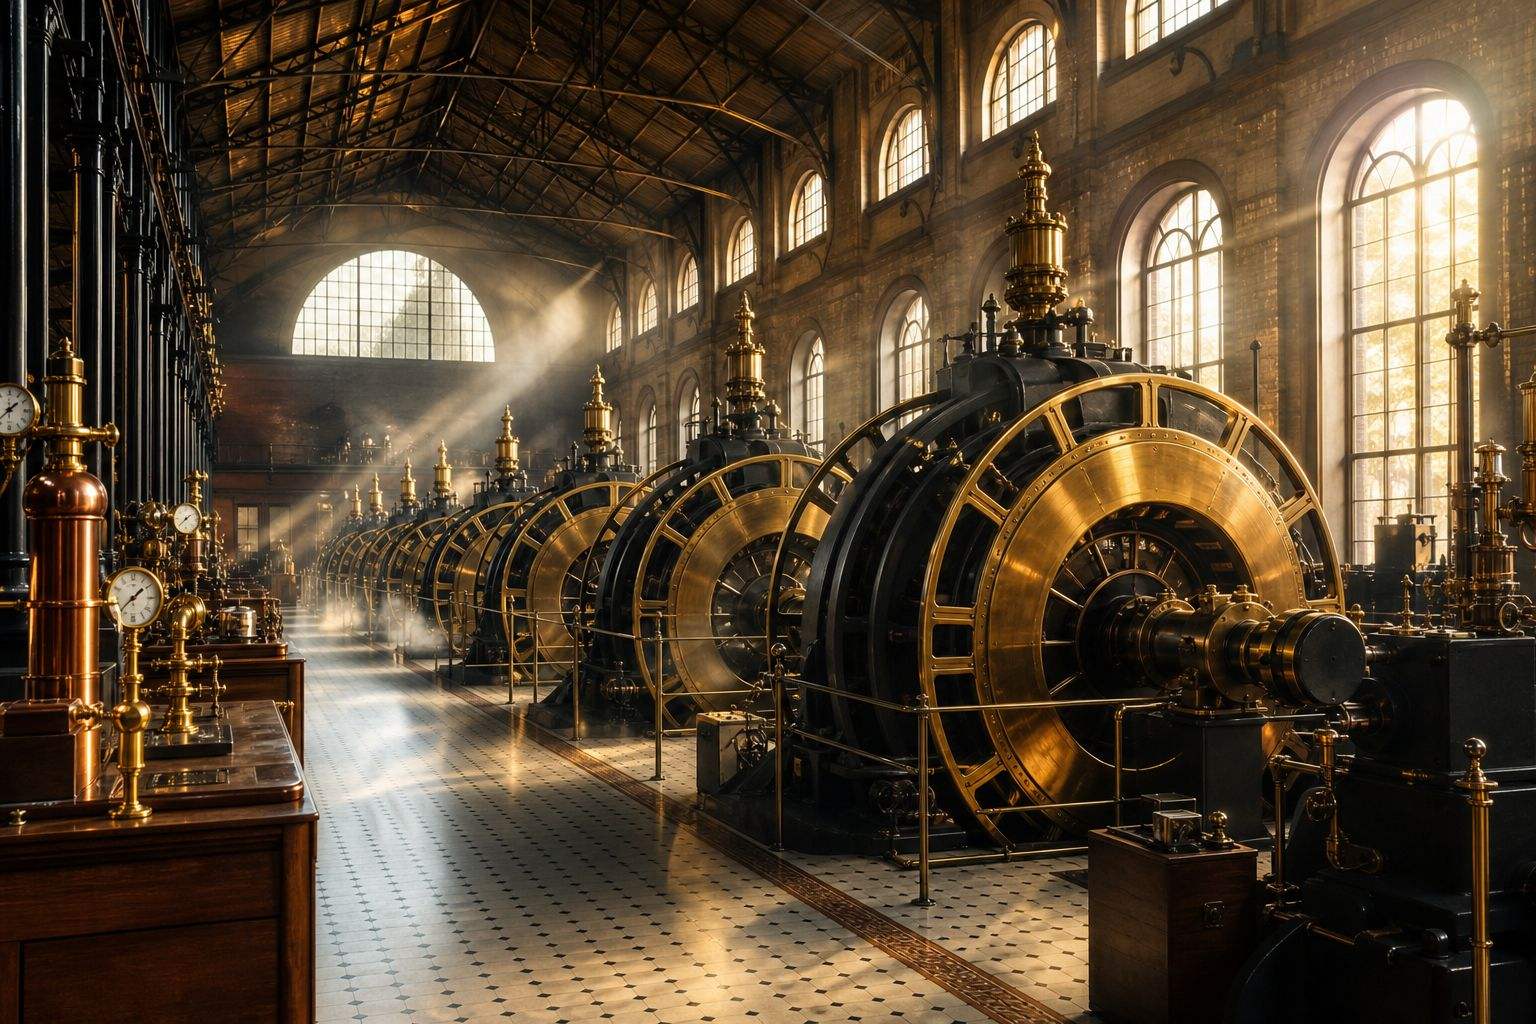
A direct-current dynamo A 19th-century dynamo in a brick station. AI-generated still.
1882
one of the first central power stations (ETHW calls it the first commercial plant)
~1 sq mile
of lower Manhattan served, by direct current
Pearl Street Station
  • Low voltage means a large current
  • A large current heats long wires
  • So stations had to sit near their customers
Direct current’s limit, in the 1880s
Chapter I · From one street to a continent

Edison’s station

IEEE Engineering and Technology History Wiki: Edison’s Pearl Street Station in New York City, opened in 1882, was the world’s first commercial power plant; it used direct current and served only about one square mile of lower Manhattan, and Edison remained committed to direct current.

The 3D ring marks a one-mile reach around the station, as an illustration.

The 3D grid is a simplified teaching model: distances, heights and the number of towers are not to scale, and the flowing lights show the direction of power, not real electrons.

Sources: Engineering and Technology History Wiki (IEEE): light and power

The answer was alternating current, which reverses direction many times a second. Nikola Tesla invented a practical motor for it, and George Westinghouse bought his patents.

Alternating current can pass through a transformer, which raises or lowers its voltage. So power can travel far at high voltage and be stepped down near the people who use it.

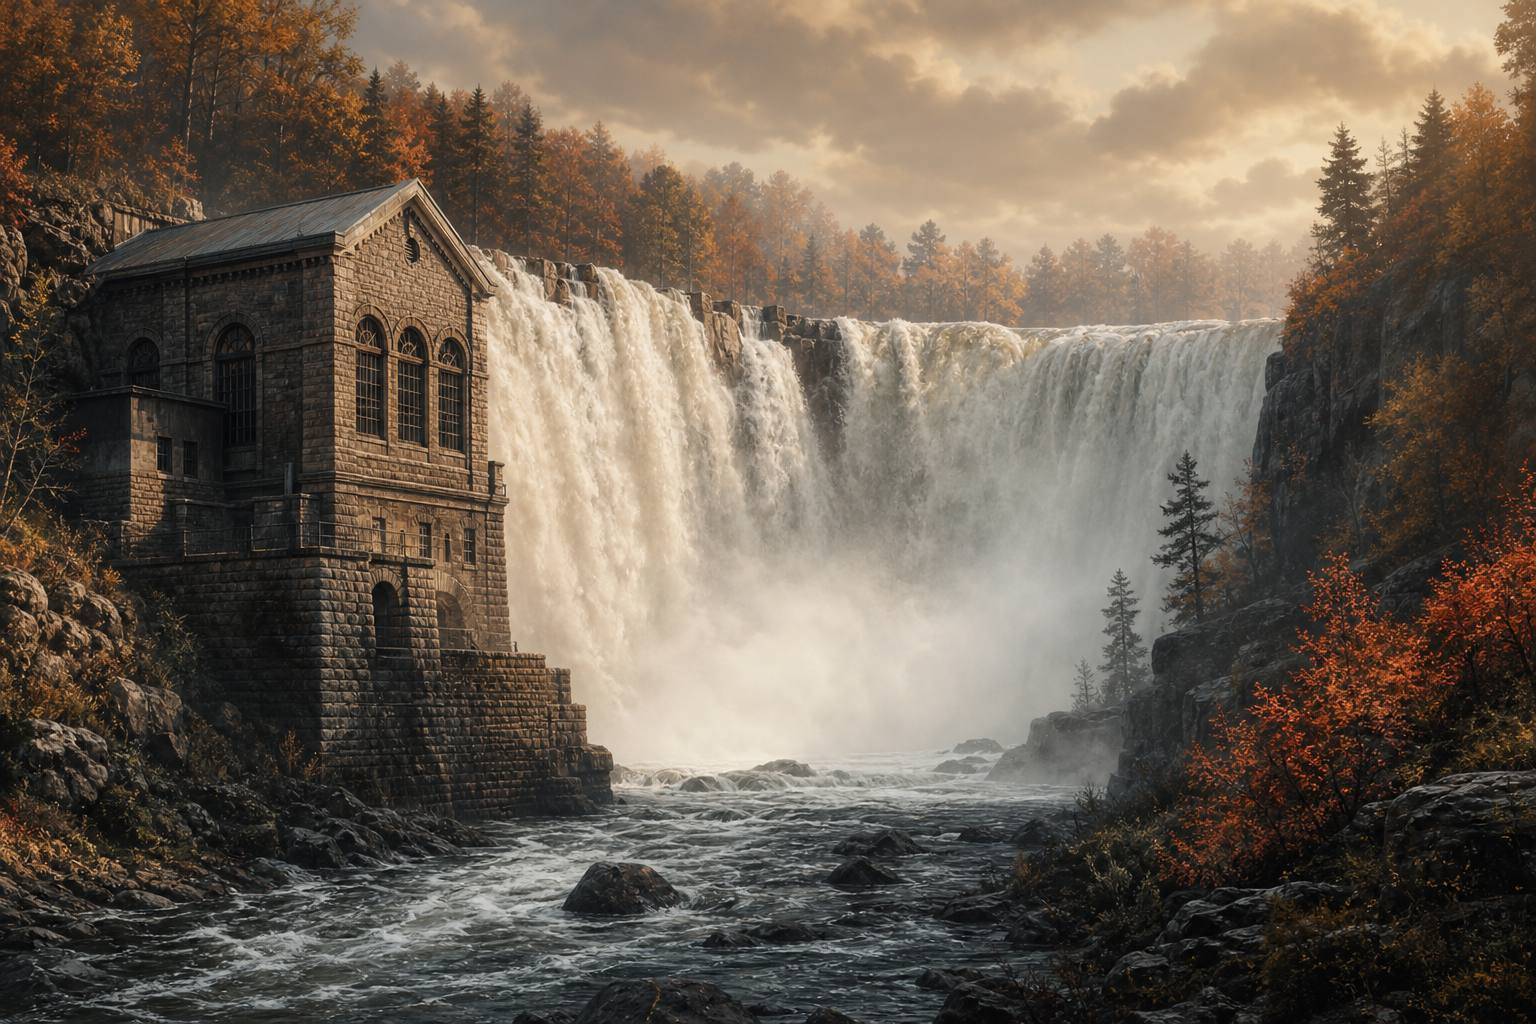
At midnight on the sixteenth of November 1896, power from Westinghouse generators at Niagara Falls reached Buffalo, about twenty-five miles away. Ten turbines sat a hundred and forty feet below the falls. Alternating current had won.

  • Direct current (DC): flows one way
  • Alternating current (AC): 50 or 60 back-and-forth cycles a second
  • Only AC works through a simple transformer
Two kinds of current
Niagara Falls An 1890s power house at the edge of the falls. AI-generated still.
16 Nov 1896
first power reaches Buffalo, at midnight
~25 miles
about 40 km, from the falls
10
turbines, 140 feet below the falls
Niagara to Buffalo
The power house Generators in an 1890s power house. AI-generated still.
Chapter I · From one street to a continent

Alternating current wins

IEEE ETHW: Tesla invented a practical AC motor in 1883; several years later Westinghouse bought the Tesla motor patents and set up an AC power system; the success of the Niagara Falls plant in sending large amounts of power to distant places decided the contest between AC and DC. EBSCO: Westinghouse built the plant, transformers raised the voltage for the line and lowered it again in Buffalo, about 25 miles from the falls; ten turbines sat 140 feet below the level of the falls; the first electricity reached Buffalo at midnight on 16 November 1896.

The 3D grid is a simplified teaching model: distances, heights and the number of towers are not to scale, and the flowing lights show the direction of power, not real electrons.

Sources: Engineering and Technology History Wiki (IEEE): light and power; EBSCO Research Starters: first US hydroelectric plant opens at Niagara Falls

Chapter II · Why high voltage

Chapter II

Why high voltage

Same power, less current, far less heat.

Why does voltage matter so much? The power a line carries is its voltage times its current. A wire wastes energy as heat, and that waste grows with the square of the current.

So if you send the same power at ten times the voltage, the current falls ten times, and the heat lost in the wire falls a hundred times. That is why long-distance lines run at hundreds of thousands of volts.

Try it: raise the voltage on this line and watch the glow of wasted heat fade. Even so, about five percent of the electricity sent through American wires is lost on the way.

P=V×IP = V \times IPloss=I2RP_{\text{loss}} = I^{2} R
PP
power carried
VV
voltage
II
current
RR
resistance of the wire
Power, and the heat lost in the wire
÷10
current
÷100
heat lost in the wire
Ten times the voltage
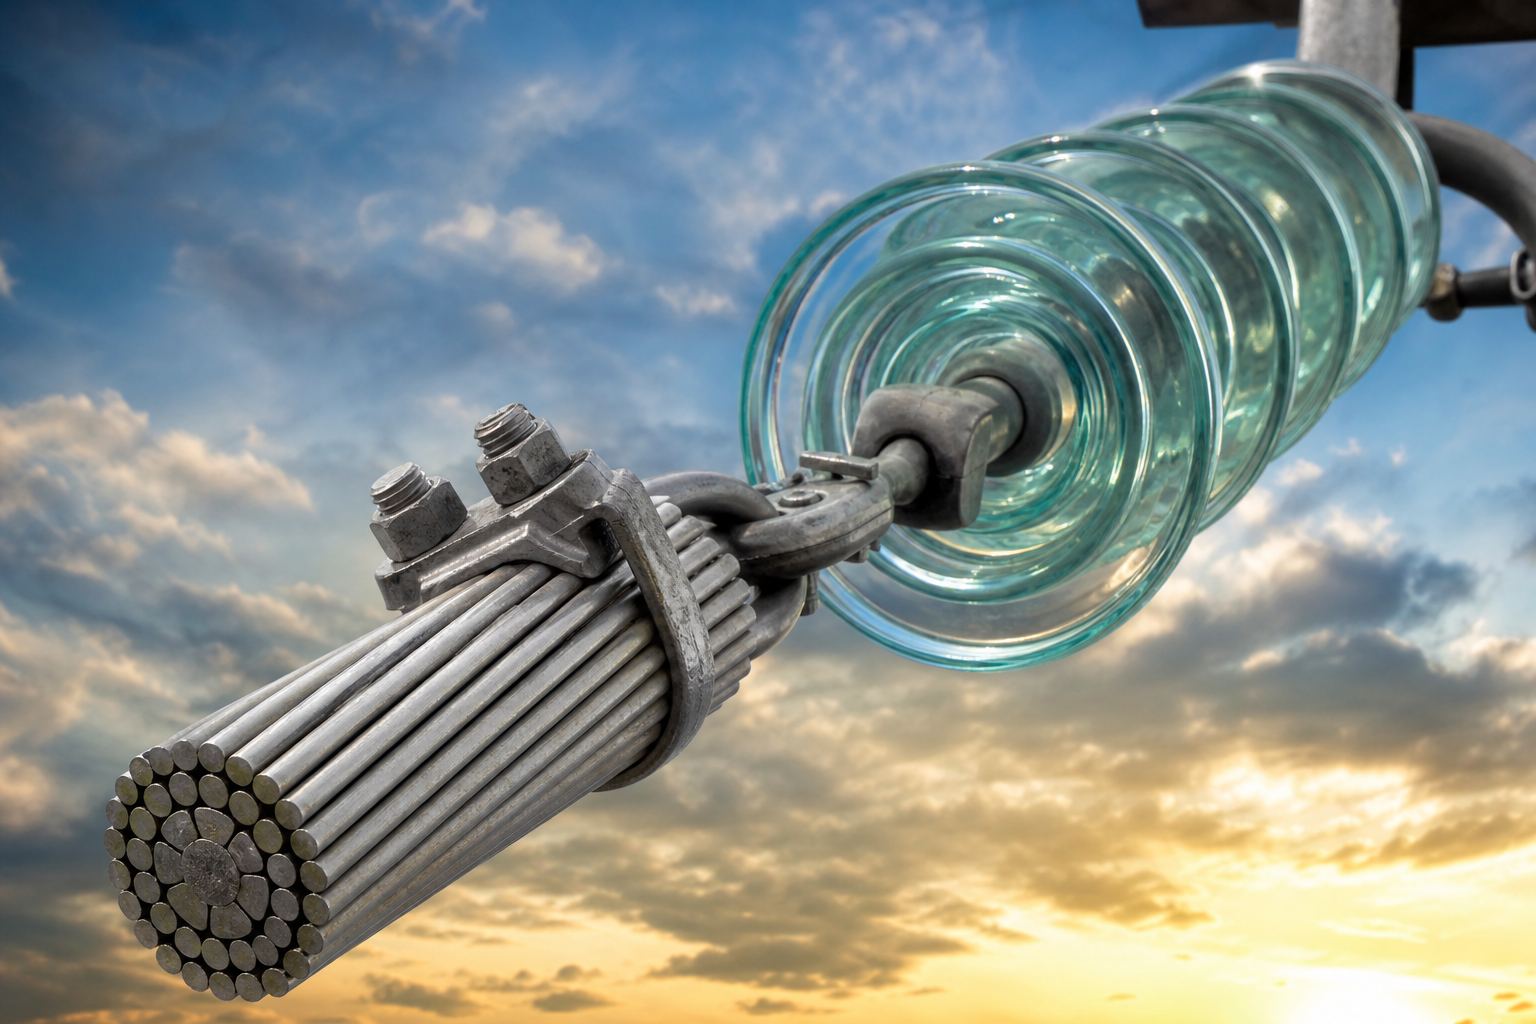
The conductor Stranded aluminium-and-steel cable on glass insulators. AI-generated still.
~5%
of electricity transmitted and distributed, 2018–2022 average
Lost on the way, USA (EIA)
Chapter II · Why high voltage

Why high voltage

Institute of Physics: the power delivered is current times voltage, and the energy dissipated in a cable goes as I²R; for a fixed power, a step-up transformer raises the voltage and reduces the current, which dramatically reduces the heat lost. Ten times the voltage means a tenth of the current and a hundredth of the loss. US Energy Information Administration: about 5% of the electricity transmitted and distributed in the United States was lost, on average, in 2018–2022.

Try it: the readout keeps the power fixed and uses an invented line resistance, so the loss percentages show the I²R rule, not any real line.

The 3D grid is a simplified teaching model: distances, heights and the number of towers are not to scale, and the flowing lights show the direction of power, not real electrons.

Sources: Institute of Physics, Spark: an AC power line at high voltage; US Energy Information Administration: how much electricity is lost in transmission and distribution?; PJM fact sheet: how transmission works

Follow the power today. Generators make it at a few thousand to twenty-four thousand volts. A step-up transformer raises it to transmission voltage, a hundred thousand volts and more.

At substations near towns, transformers step it down for local distribution lines, and a final transformer on a pole or in a box brings it down to the voltage of your sockets. The lines are linked into a network, so if one fails, others can carry its load.

In Thailand, the Electricity Generating Authority runs about forty thousand circuit-kilometres of lines at five hundred, two hundred and thirty, and a hundred and fifteen thousand volts.

  • Generator: ~2,300–24,000 V
  • Transmission: 100,000 V and up
  • Distribution: ~4,160–34,500 V
  • Homes in the US: 120 or 240 V
Voltages along the way (PJM)
The last step down A pole transformer feeding a street of houses. AI-generated still.
≈ 40,352
circuit-km (a two-circuit line counts twice)
240
substations
500 · 230 · 115 kV
voltage levels
Thailand’s transmission grid (EGAT, Dec 2025)
Chapter II · Why high voltage

Step up, step down

PJM: generators produce electricity at about 2,300 to 24,000 volts; step-up transformers raise it to transmission levels of 100 kV and higher; substations step it down for distribution feeders at about 4,160 to 34,500 volts; distribution transformers reduce it to the standard 120 or 240 volts for homes and businesses in the US. Most North American transmission is three-phase AC on stranded aluminium and steel conductors, in a network where other lines can carry the load if one fails. EGAT (December 2025): about 40,352 circuit-kilometres of transmission lines, 240 substations, at 500, 230 and 115 kV.

Try it: step along the path from the power station to a home.

The 3D grid is a simplified teaching model: distances, heights and the number of towers are not to scale, and the flowing lights show the direction of power, not real electrons.

Sources: PJM fact sheet: how transmission works; EGAT: EGAT at a glance (transmission system, December 2025)

Chapter III · Always in balance

Chapter III

Always in balance

Made the moment it is used.

Electricity is hard to store in large amounts, so a grid has to produce, every second, almost exactly what its customers are using.

Operators forecast demand hour by hour. They call on the cheapest power stations first and add more as people wake up, switch on air conditioning, and come home in the evening. That was PJM's problem this October: air conditioners running while plants were down for maintenance.

Electricity moves almost instantly and can barely be stored, so PJM's operators must respond to every change at once, with reserves ready, and can even pay customers to cut their use.

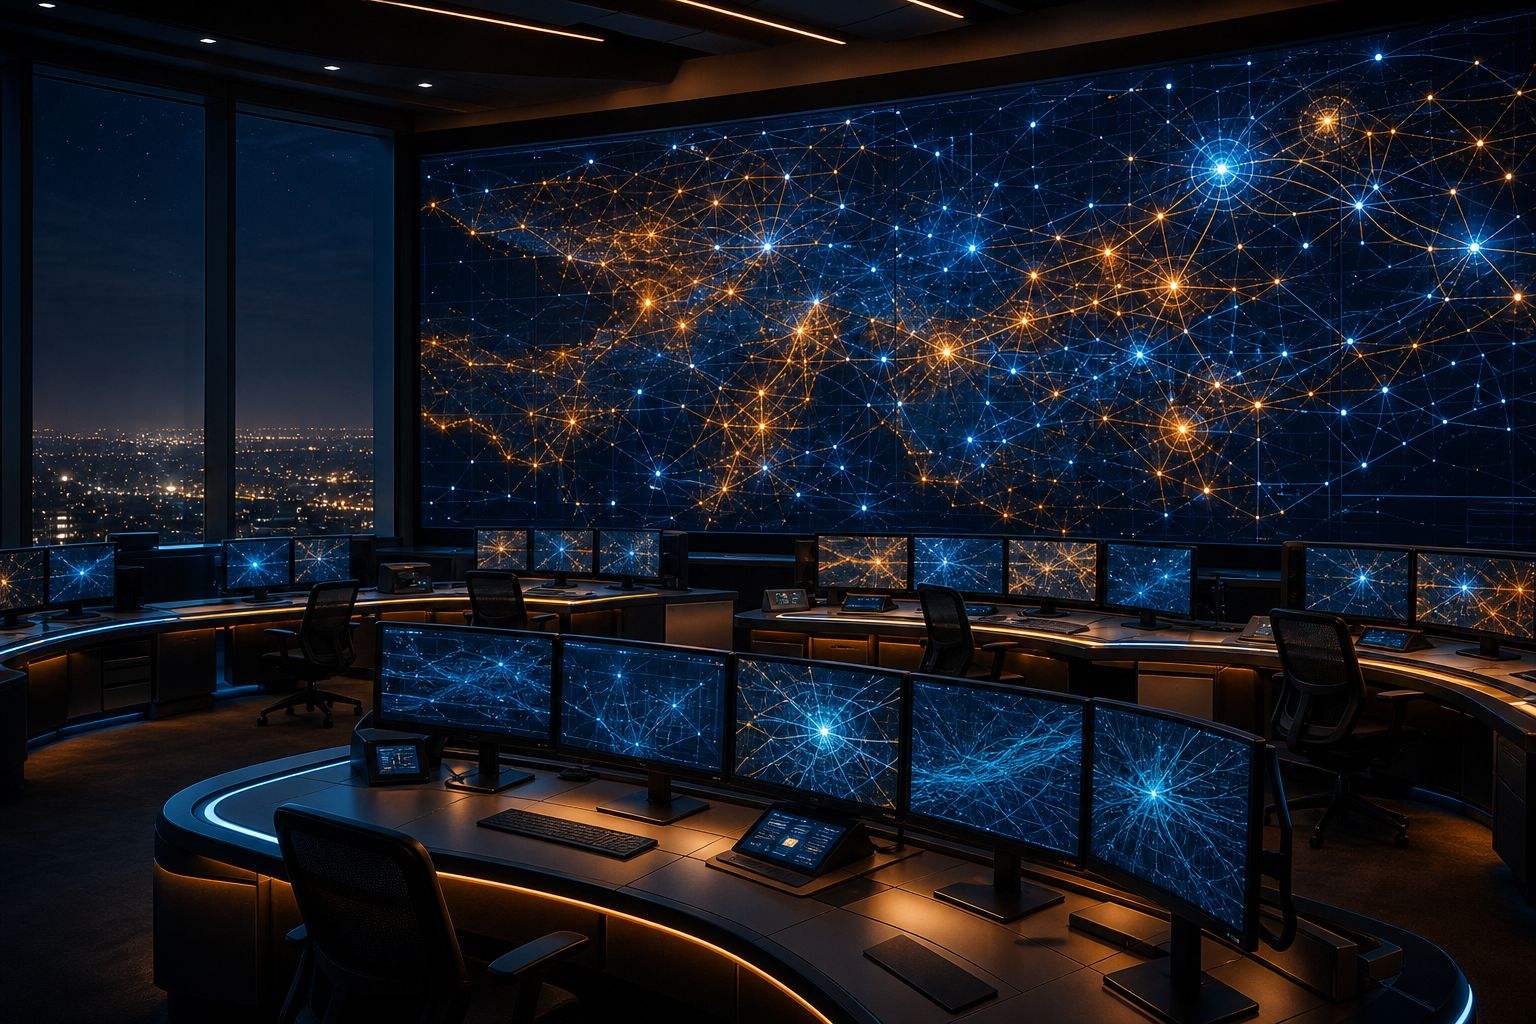
The control room A grid control room at night. AI-generated still.
  • Forecast demand for each hour
  • Dispatch the lowest-cost generators first
  • Pay customers who cut use when needed
  • Keep reserves ready
How PJM balances (PJM fact sheet)
185,989 MW
generating capacity
165,563 MW
peak demand
88,417 mi
of bulk transmission lines
PJM in numbers (end of 2025)
Chapter III · Always in balance

A speed-of-light product

PJM, “Power in balance”: PJM forecasts how much electricity will be needed each hour; electricity “is a speed-of-light product that has a limited ability to be stored”, so PJM “must respond instantaneously to changes in demand and operating conditions”; it calls on the lowest-cost generation first, can pay customers who reduce demand, and keeps reserves for emergencies. PJM by the numbers (31 December 2025): 185,989 MW of generating capacity, peak demand of 165,563 MW, 88,417 miles of bulk electric system lines.

The daily curve on screen is an illustration of a typical shape, not PJM data.

The 3D grid is a simplified teaching model: distances, heights and the number of towers are not to scale, and the flowing lights show the direction of power, not real electrons.

Sources: PJM fact sheet: power in balance; PJM annual report 2025: PJM by the numbers
How do operators know the balance is right? They watch the frequency. Alternating current completes fifty back-and-forth cycles a second in most of the world, including Thailand, and sixty in most of the Americas. Japan is split in two: fifty in the east, sixty in the west.

Every big generator spins in step with that rhythm. When people use more than is being made, the extra load drags on the spinning machines and the frequency falls. When there is too much power, it rises.

The heavy spinning turbines resist sudden change, like a truck riding over a bump. That resistance is called inertia. Try adding load or generation.

50 Hz
most of the world, including Thailand
60 Hz
most of the Americas, a few Asian countries
50 | 60
Japan: east | west
The rhythm of the grid
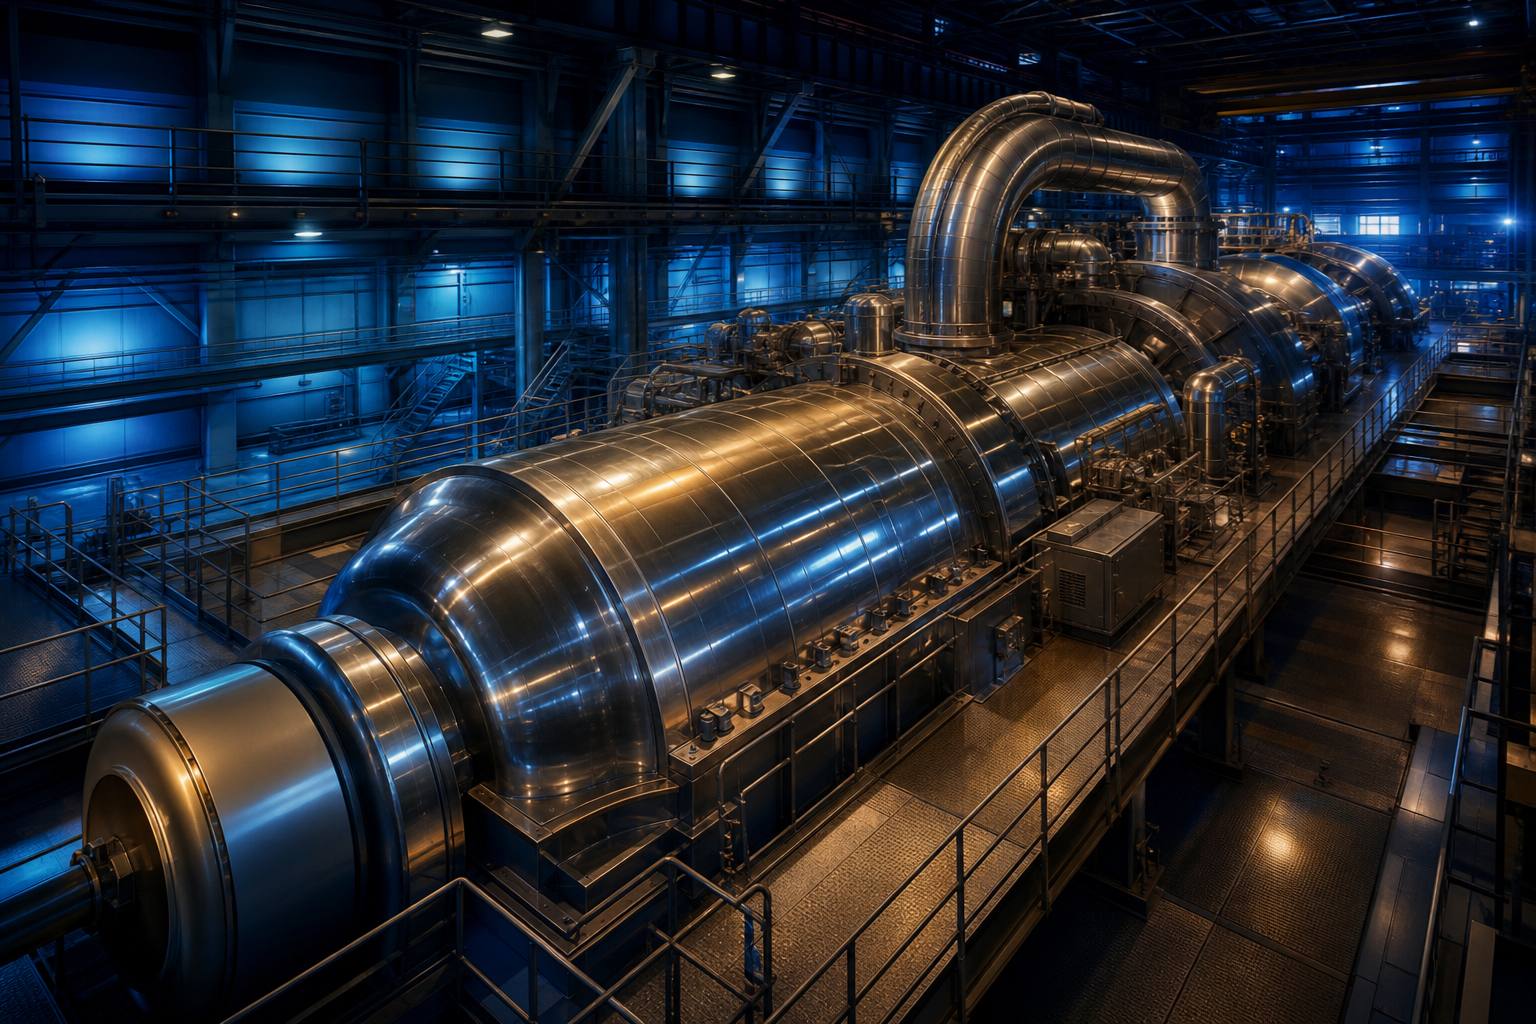
Spinning mass A large turbine-generator in a power station hall. AI-generated still.
  • Demand > supply: frequency falls
  • Supply > demand: frequency rises
  • Automatic controls nudge generators back
Reading the frequency
  • Heavy turbines in gas and nuclear plants spin at a steady rate
  • Their spin resists sudden swings in frequency
  • A shock absorber while the balance is restored
Inertia (NESO, Great Britain)
Chapter III · Always in balance

Frequency and inertia

Wikipedia (utility frequency): about 50 Hz is used across most of the world, while most of the Americas and a handful of Asian countries use 60 Hz; Japan is split, 50 Hz in Tokyo and the east, 60 Hz in Nagoya and the west, joined by converter stations. Frequency reflects the balance between generation and load: excess load draws down the generators’ rotational energy and lowers frequency, excess generation raises it, and automatic generation control adjusts generators to counter the change. Great Britain’s National Energy System Operator: heavy spinning turbines provide inertia that resists sudden changes in frequency, like a heavy truck taking a bump better than a light car.

Try it: the dial uses a 50 Hz grid and an invented sensitivity, to show the direction of change, not real magnitudes.

The 3D grid is a simplified teaching model: distances, heights and the number of towers are not to scale, and the flowing lights show the direction of power, not real electrons.

Sources: Wikipedia: utility frequency; World Standards: plugs, voltage and frequency in Thailand (230 V, 50 Hz); National Energy System Operator (Great Britain): how inertia keeps the lights on

Now suppose a large power station suddenly trips off the grid. The frequency starts to fall within seconds. Inertia slows the fall, and reserve plants and batteries rush to fill the gap.

If the frequency keeps falling, protective relays cut off whole neighbourhoods on purpose. Shedding some load saves the rest of the grid from collapse. Try tripping a station yourself.

In February 2021, during a winter storm, the Texas grid fell to about fifty-nine point three hertz. Had it stayed below fifty-nine point four for nine minutes, a cascading failure would have collapsed it. It recovered with four minutes and thirty-seven seconds to spare, after rolling blackouts had been ordered half an hour earlier.

  • Frequency falls
  • Inertia slows the fall
  • Reserves and batteries respond
  • If not enough: load is shed
The first seconds after a trip
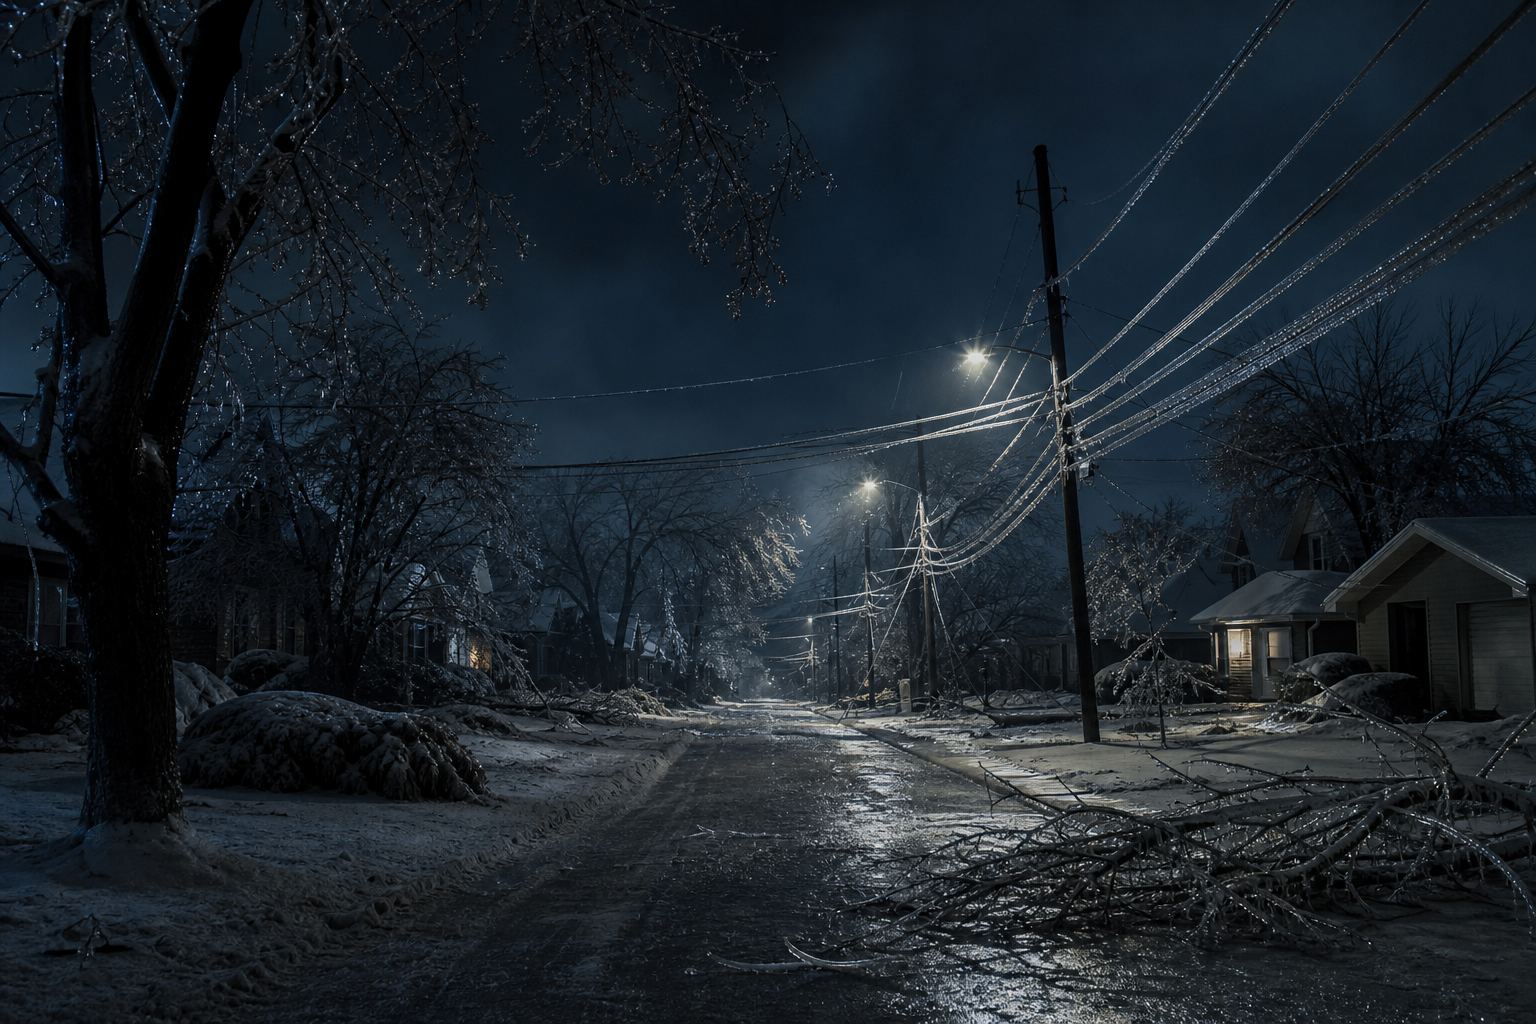
Load shedding A snowy street with its lights cut. AI-generated still.
≈ 59.3 Hz
lowest frequency
9 min
below 59.4 Hz would trigger collapse
4 min 37 s
to spare
Texas, early on 15 Feb 2021 (60 Hz grid)
  1. 01:23 Rolling blackouts ordered
  2. 01:51 Frequency drops below 59.4 Hz
  3. +4 min 23 s Frequency starts to rise again
Texas, night of 14–15 Feb 2021 (KUT)
Chapter III · Always in balance

Shedding load to save the grid

NESO: the sudden loss of a power station can make frequency drop quickly; inertia acts as a shock absorber and frequency response services hold it while the balance is restored. Wikipedia (utility frequency): when frequency drops severely, protective relays trigger load shedding, typically at about 0.5 to 2 Hz below nominal depending on the system. KUT: early on 15 February 2021 the frequency of the Texas grid dropped below 59.4 Hz at about 1:51 a.m. and fell to about 59.3 Hz; staying below 59.4 Hz for nine minutes would have triggered a cascading failure, and the grid was 4 minutes and 37 seconds away from it; rolling blackouts had been ordered at 1:23 a.m.

Try it: trip a power station and watch the dial; the timings and the shedding threshold are illustrative.

The 3D grid is a simplified teaching model: distances, heights and the number of towers are not to scale, and the flowing lights show the direction of power, not real electrons.

Sources: National Energy System Operator (Great Britain): how inertia keeps the lights on; Wikipedia: utility frequency; KUT (24 Feb 2021): the Texas power grid was 4 minutes and 37 seconds away from collapsing

Chapter IV · Blackout

Chapter IV

Blackout

A peninsula goes dark in seconds.

Sometimes the protections cannot stop a cascade. At thirty-three minutes past noon on the twenty-eighth of April 2025, mainland Spain and Portugal lost power.

This time the trouble was voltage, the electrical pressure in the lines. In a little over a minute, voltages surged, more than two and a half gigawatts of generation disconnected, and the Iberian grid fell out of step with the rest of Europe. Automatic load shedding could not save it.

Trains and metros stopped, some thirty-five thousand passengers had to be rescued, and most areas were dark for about ten hours. At least eight people died, in incidents linked to the outage.

Solar plants were among those that dropped out, but Europe's grid operators later found many interacting causes, above all gaps in voltage control. As their board chair put it, the problem was not renewable energy, but voltage control.

12:33
CEST: the lights go out
2
countries dark: Spain and Portugal
Iberia, 28 April 2025
  1. 12:32:00 Large renewable output in Spain falls ~500 MW
  2. 12:33:16 727 MW of solar disconnects near Badajoz
  3. 12:33:18 928 MW more drops in five provinces
  4. 12:33:19 Iberia loses synchronism with Europe
28 April 2025, CEST (ENTSO-E, via pv magazine)
~10 h
without power in most areas
35,000
passengers rescued from trains and metros
8
deaths linked to the outage (7 Spain, 1 Portugal)
The cost
“The problem is not renewable energy, but voltage control, regardless of the type of generation.”ENTSO-E board chair
ENTSO-E, presenting its final report (Mar 2026)
Chapter IV · Blackout

The Iberian blackout

pv magazine, on the ENTSO-E final report: between 12:32:00 and 12:32:48 CEST large renewable output in Spain fell by about 500 MW; by 12:33:16 disconnections near Badajoz removed 727 MW, and another 928 MW dropped across five provinces within two seconds; more than 2.5 GW was lost, voltages exceeded 435 kV, and at 12:33:19 Spain and Portugal lost synchronism with the European grid; automatic load shedding from 12:33:19 to 12:33:22 could not prevent collapse. Wikipedia: most areas were without power for about ten hours; about 35,000 passengers were rescued from trains and metros; at least seven deaths in Spain and one in Portugal were linked to the outage. The final report (20 March 2026) identified many interacting factors, including gaps in voltage and reactive power control and some renewable plants running in fixed power-factor mode; it found that higher inertia would not have prevented the loss of synchronism.

The map is simplified: regions go dark together for illustration, not in the real order.

Sources: pv magazine (23 Mar 2026): ENTSO-E report finds systemic failures behind the 2025 Iberian blackout; Wikipedia: 2025 Iberian Peninsula blackout

Chapter V · The new grid

Chapter V

The new grid

Sunshine, batteries and new demand.

Solar power is changing the shape of the day. Subtract solar output from demand, and what is left for other plants dips at midday and climbs steeply at sunset.

In California the curve looks like a duck, and it gets deeper as more panels are built. Batteries help: they soak up midday sun and give it back in the evening.

Solar panels and wind turbines connect through electronics rather than spinning machines, so they add little natural inertia. Grid operators make up for it with fast batteries, synchronous compensators, which are heavy spinning machines that burn no fuel, and new grid-forming inverters.

demand − solar − wind
what other power plants must still supply
Net load
20180.2
April 20234.9
Battery storage on California’s grid (EIA) Another 4.5 GW was planned by the end of 2023.
  • Fast batteries, so less inertia is needed
  • Fifteen synchronous compensators: spinning machines with no fuel
  • Grid-forming inverters with synthetic inertia
Putting inertia back (NESO, Great Britain)
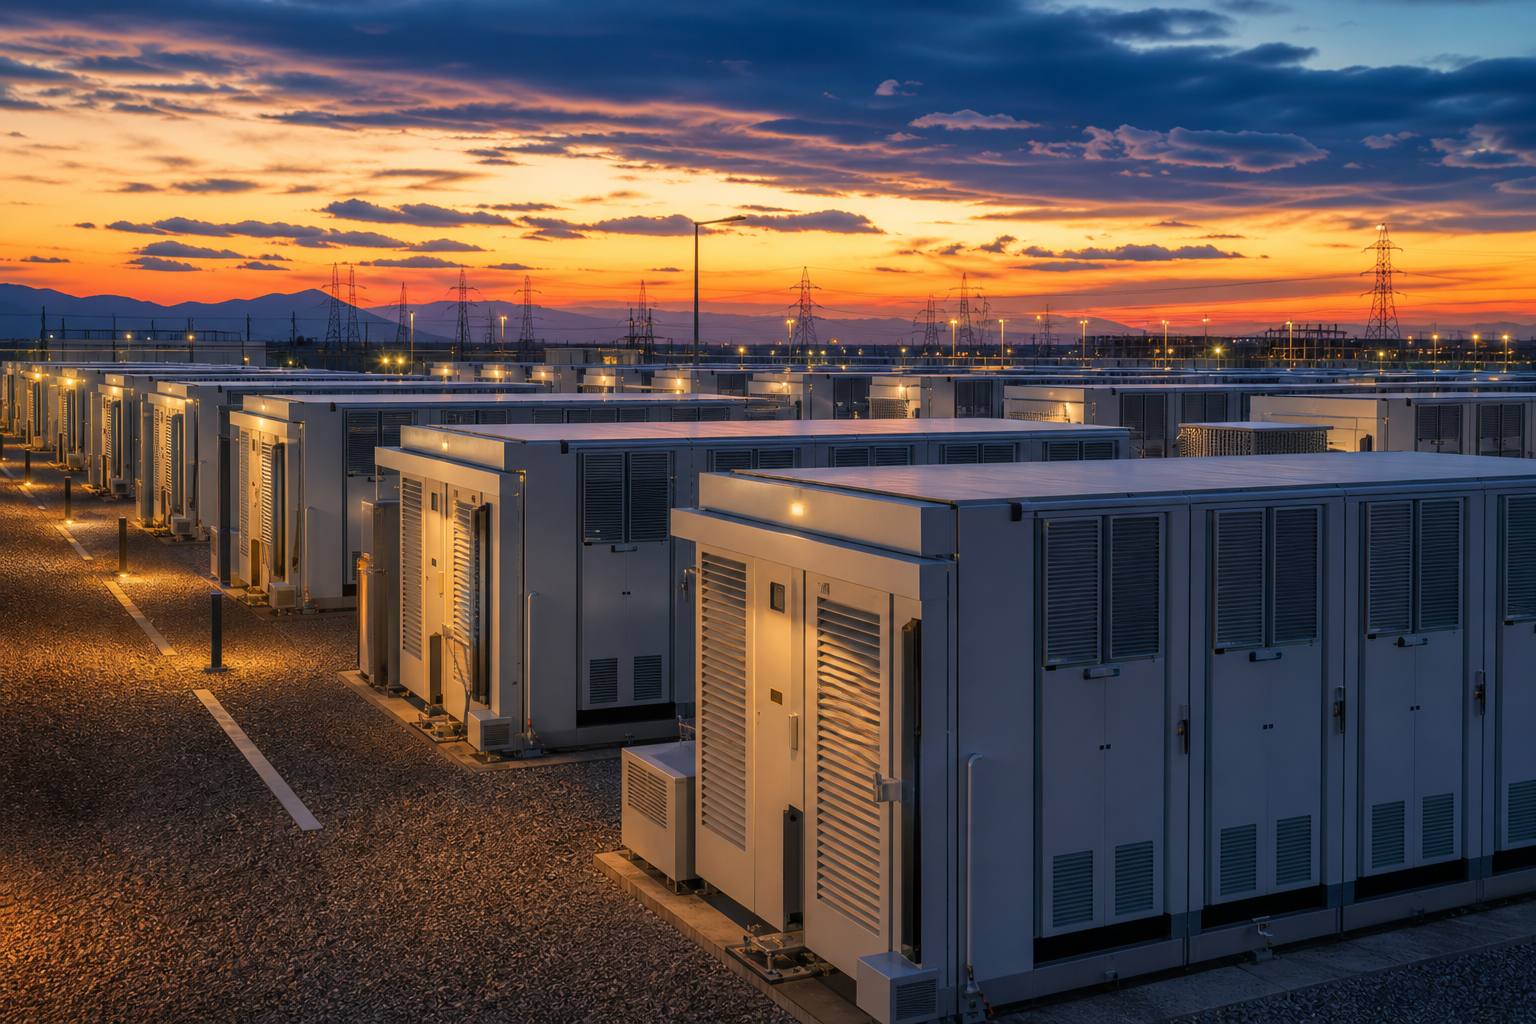
Grid batteries Battery storage containers at dusk. AI-generated still.
Chapter V · The new grid

The duck curve

US Energy Information Administration: California’s net load, demand minus variable renewable generation, dips at midday as solar output peaks and rises steeply in the evening as solar falls off, a shape that resembles a duck and is getting deeper as solar grows; battery storage on the grid rose from 0.2 GW in 2018 to 4.9 GW by April 2023, with 4.5 GW more planned by the end of 2023, absorbing midday solar and releasing it in the evening. NESO: wind and solar connect through inverters and add little natural inertia; Great Britain compensates with batteries, fifteen synchronous compensators and grid-forming inverters that provide synthetic inertia.

Try it: the three curves are an illustration of the typical shape, not measured data.

Sources: US Energy Information Administration, Today in Energy: as solar capacity grows, duck curves are getting deeper in California; National Energy System Operator (Great Britain): how inertia keeps the lights on

Demand is growing again. The International Energy Agency estimates that data centres used about four hundred and fifteen terawatt-hours in 2024, roughly one and a half percent of the world's electricity.

By 2030 it projects about nine hundred and forty-five, about as much as Japan uses today, with the United States and China making up nearly eighty percent of the growth.

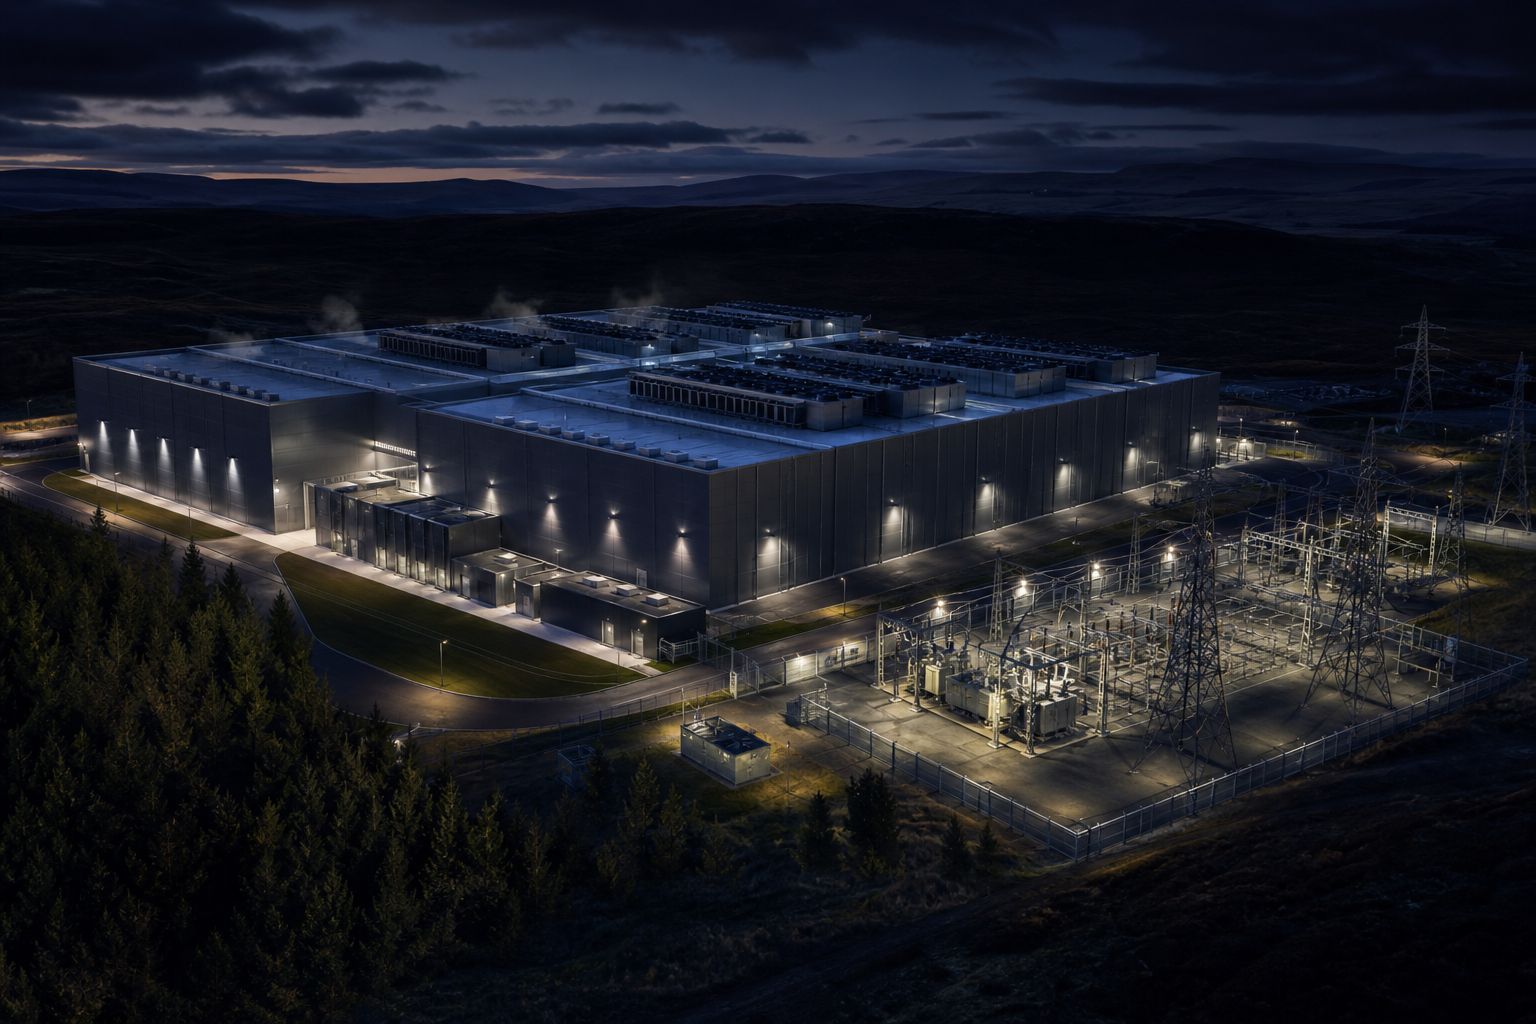
This October's order also let PJM ask data centres to switch to their own backup generators. The Department of Energy counts thirty-five gigawatts of idle backup generation across the country.

A data centre A data centre campus beside a substation. AI-generated still.
2024≈ 415
2030 (projection)≈ 945
Data centre electricity use (IEA) 2024: about 1.5% of world electricity.
35 GW
of unused backup generation nationwide
13–14 Oct
PJM maximum generation alert
The October order (DOE)
Chapter V · The new grid

New demand

Scientific American, reporting the International Energy Agency’s “Energy and AI” report: data centres used about 415 TWh in 2024, roughly 1.5% of global electricity, projected to reach about 945 TWh by 2030, roughly Japan’s current annual use; the United States and China account for nearly 80% of the projected growth. The National: the October 2026 order let PJM tell data centres and other large customers to switch to back-up generation if necessary; the Energy Department said the US has 35 GW of unused back-up generation nationwide.

PlanetPast’s film on data centres explains what happens inside them.

The 3D grid is a simplified teaching model: distances, heights and the number of towers are not to scale, and the flowing lights show the direction of power, not real electrons.

Sources: Scientific American (2025): AI will drive a doubling of data centre energy demand by 2030 (IEA figures); The National (13 Oct 2026): emergency order by US to “prevent blackouts” could affect data centres

Epilogue

A power grid is one machine the size of a continent. Its parts are thousands of kilometres apart, yet they spin in step, many times every second.

It works because people watch the balance every second of every day, and because protections act in a fraction of a second when the balance slips. Whether in Pennsylvania, Portugal or Bangkok, the physics is the same.

How to keep that balance with more sunshine, more batteries and more data centres is the open question for the grids of the next decade.

  1. 1882 Pearl Street: direct current, one square mile
  2. 1896 Niagara’s AC reaches Buffalo
  3. 2021 Texas, minutes from collapse
  4. 2025 The Iberian blackout
  5. 2026 PJM’s October emergency
The grid, step by step
  • Stills are AI-generated
  • The 3D grid is a simplified model
  • Dials and curves are illustrations
About this film
  • How much storage will grids need?
  • Who pays for new lines?
  • Can supply keep up with data centres?
Still open
Epilogue · Sources

Sources

Every fact in this film comes from the sources below. The chapter stills and pictures are AI-generated illustrations. The 3D grid, the frequency dial, the loss calculator and the daily curves are simplified teaching models with invented values where marked; the Iberian map uses simplified Natural Earth outlines (public domain).

Sources: Potomac Local (13 Oct 2026): Energy Secretary issues emergency order for the Mid-Atlantic grid; The National (13 Oct 2026): emergency order by US to “prevent blackouts” could affect data centres; PJM annual report 2025: PJM by the numbers; Engineering and Technology History Wiki (IEEE): light and power; EBSCO Research Starters: first US hydroelectric plant opens at Niagara Falls; Institute of Physics, Spark: an AC power line at high voltage; US Energy Information Administration: how much electricity is lost in transmission and distribution?; PJM fact sheet: how transmission works; EGAT: EGAT at a glance (transmission system, December 2025); PJM fact sheet: power in balance; Wikipedia: utility frequency; World Standards: plugs, voltage and frequency in Thailand (230 V, 50 Hz); National Energy System Operator (Great Britain): how inertia keeps the lights on; KUT (24 Feb 2021): the Texas power grid was 4 minutes and 37 seconds away from collapsing; pv magazine (23 Mar 2026): ENTSO-E report finds systemic failures behind the 2025 Iberian blackout; Wikipedia: 2025 Iberian Peninsula blackout; US Energy Information Administration, Today in Energy: as solar capacity grows, duck curves are getting deeper in California; Scientific American (2025): AI will drive a doubling of data centre energy demand by 2030 (IEA figures)