In October 2026 China's commerce and science ministries proposed adding some solar-manufacturing technologies to the country's catalogue of technologies prohibited or restricted from export. To see why that know-how matters, this film goes inside a panel: photons and their energy, the silicon crystal and its band gap, doping with phosphorus and boron, the p-n junction whose built-in field turns light into current, cells, modules and inverters, the Shockley–Queisser limit, and the five-stage chain from polysilicon to module. Pick a photon colour, dope the silicon, close the circuit, move the Sun and explore the supply chain.
Interactive 3D film9 min1839 to 2026Published 20 October 2026
A solar panel has no moving parts, burns no fuel. Yet put it in sunlight, and electricity flows. How?
In October 2026, China's ministries proposed restricting exports of some solar-manufacturing technology.
Officials cite national security. To see why that know-how matters, start inside one cell.
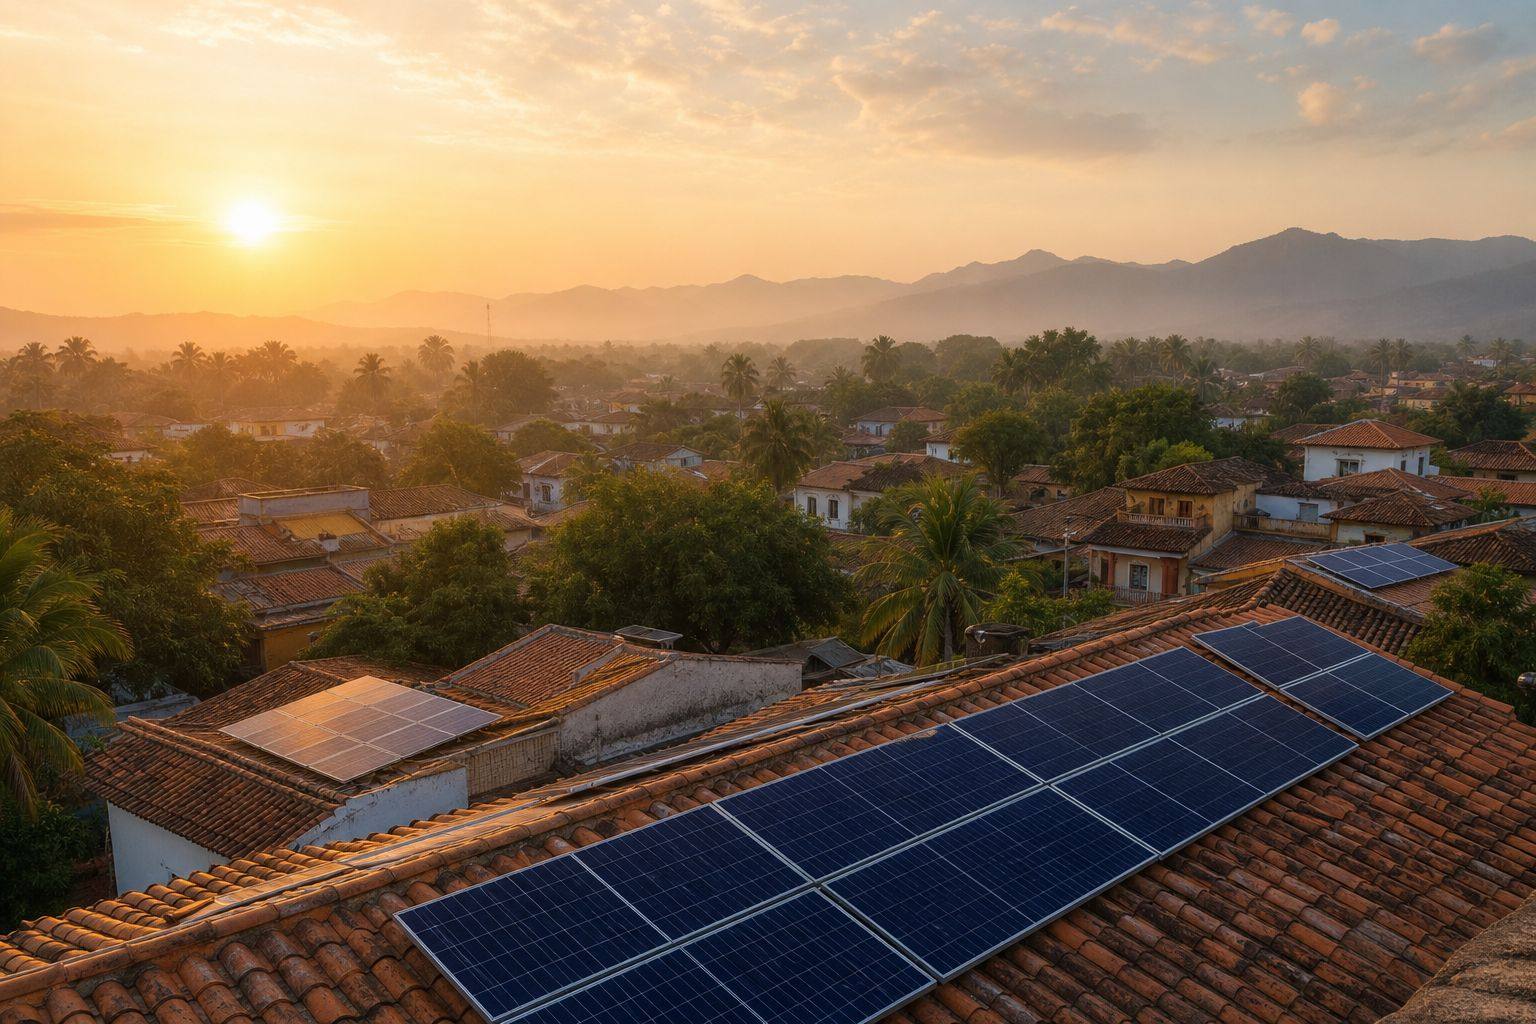
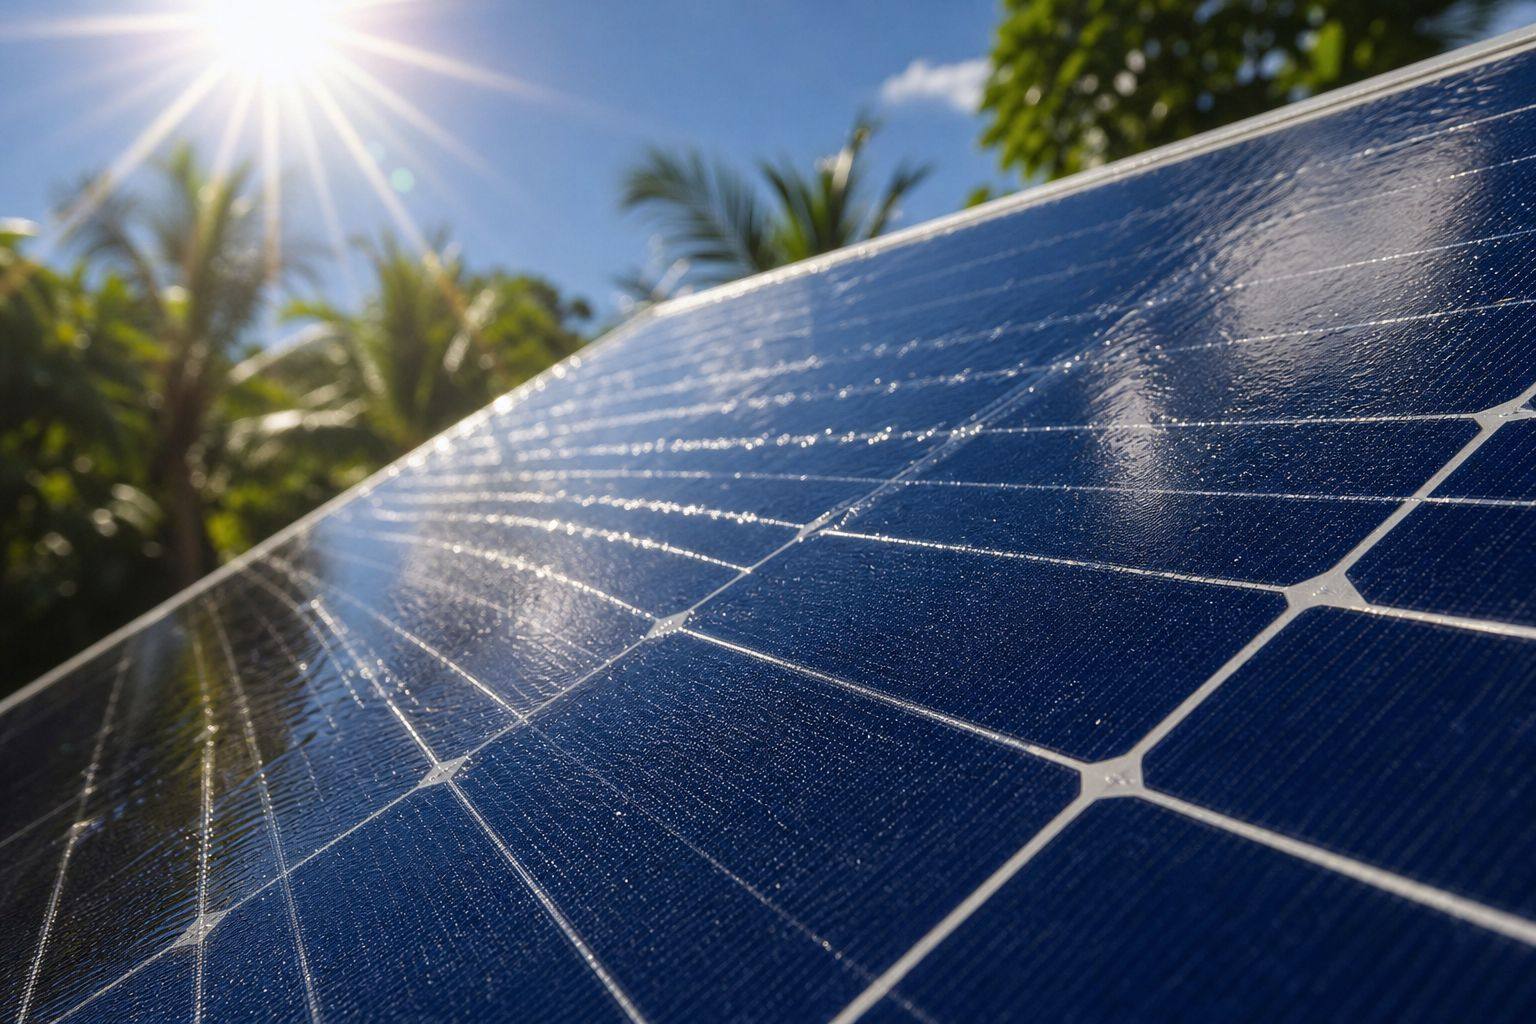
Panels on the roofs Each dark blue rectangle holds dozens of silicon cells. AI-generated still.
40 technologies in AI, biomedicine and solar; 12 of them solar
solar items: polysilicon, wafer, cell and module processes and equipment
comments until 15 November; registration before export starts now
The draft (MOFCOM and MOST, 16 Oct 2026)
PV is used more in aerospace, defence and secure infrastructure
only technology above set thresholds is covered
panels made with it are not controlled
What the ministries say
Prologue · The news
A draft export catalogue
On 16 October 2026 China’s Ministry of Commerce (MOFCOM) and Ministry of Science and Technology (MOST) published a proposed revision of the Catalogue of Technologies Prohibited or Restricted from Export, covering 40 technologies in artificial intelligence, biomedicine and photovoltaics, open for comment until 15 November 2026 (SCMP, CGTN, MLex). According to a summary of the notice by Geopolitechs, 12 of the items are photovoltaic: processes and equipment for polysilicon, thin wafers, several cell designs and perovskite and perovskite–silicon tandem modules; the scope also includes the key and core equipment that carries the listed technologies; and exporters must register listed technologies before export while the revision is pending. The ministries cite national security, pointing to the growing use of photovoltaics in aerospace, defence, unmanned systems and high-security infrastructure, and say controls apply only above set thresholds and not to products made with the technologies.
This film does not judge the policy. It explains the physics and the manufacturing the draft is about.
How to use: pick a chapter or press ← →; drag to rotate. Several steps have buttons to press.
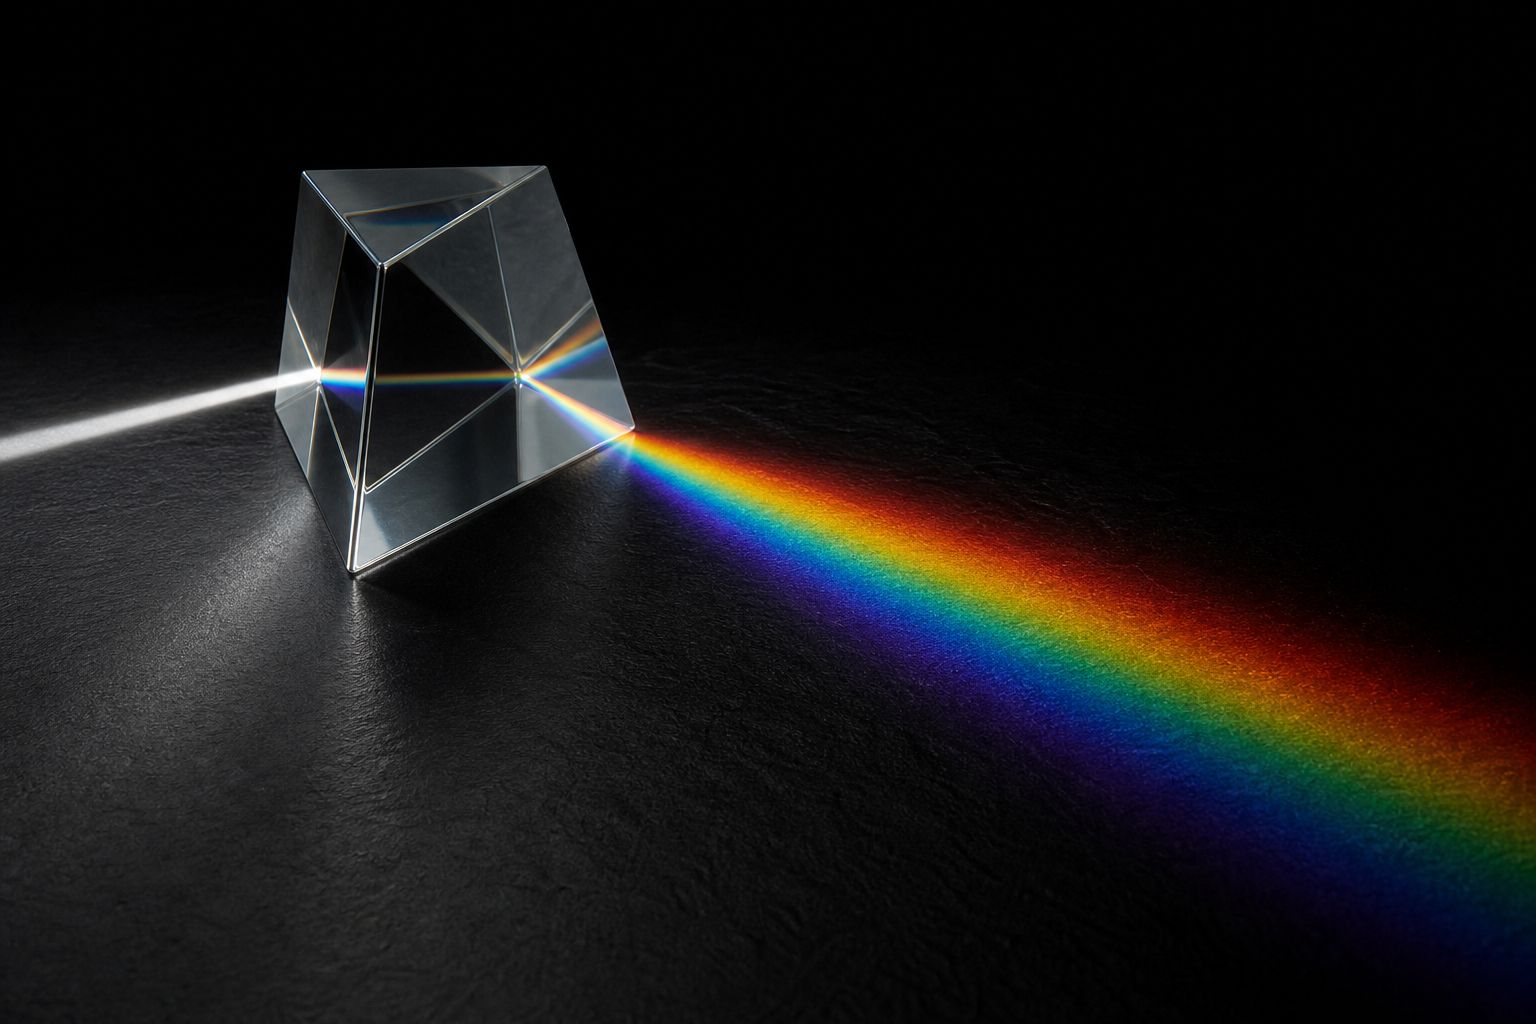
Sunlight arrives in tiny packets of energy called photons. How much energy each one carries depends on its colour.
Blue light comes in high-energy photons, red light in weaker ones, and infrared, which our eyes cannot see, in weaker ones still.
A red photon carries about one point eight electron volts; a blue one about two point eight.
Pick a colour and compare.
White light, split A prism spreads sunlight by wavelength, from red to violet. AI-generated still.
2.8
eV · blue, 450 nm
1.8
eV · red, 700 nm
0.9
eV · infrared, 1,400 nm
Energy per photonE=λhc≈λ[μm]1.24eV
h
Planck’s constant
c
speed of light
λ
wavelength
eV
electron volt: the energy one electron gains across one volt
1 eV
a photon of 1,240 nm
2 eV
a photon of 620 nm
Rule of thumb (PVEducation)
Chapter I · Light
Photons and their energy
Light is absorbed and emitted in packets, photons. PVEducation gives the energy of a photon as E = hc/λ, or in convenient units E (eV) = 1.24 / λ (µm): the shorter the wavelength, the higher the energy. Blue light at 0.45 µm gives about 2.8 eV per photon, red at 0.70 µm about 1.8 eV, and infrared at 1.4 µm about 0.9 eV. One electron volt is the energy an electron gains crossing a potential difference of one volt.
The numbers on screen are worked out from the PVEducation formula.
The 3D crystal, cell, photons and charges are simplified teaching models, not to scale.
Seen in 1839, explained later, made practical in 1954.
That light can make electricity was first seen in 1839, when the French physicist Edmond Becquerel noticed small currents from metal electrodes in a liquid, exposed to light.
Later, Einstein's law of the photoelectric effect, a close cousin of what happens in a solar cell, won the 1921 Nobel Prize in Physics.
Then, on the twenty-fifth of April 1954, Bell Labs showed a silicon cell about six percent efficient: the first practical solar cell.
1839 Becquerel: lit electrodes in an electrolyte give a current
1883 Fritts: selenium cells, under 1%
1921 Nobel Prize to Einstein
1954 Bell Labs: Chapin, Fuller and Pearson’s silicon cell, ~6%
The photovoltaic effect
for his services to Theoretical Physics, and especially for his discovery of the law of the photoelectric effectNobel citation, 1921 prize (awarded 1922)
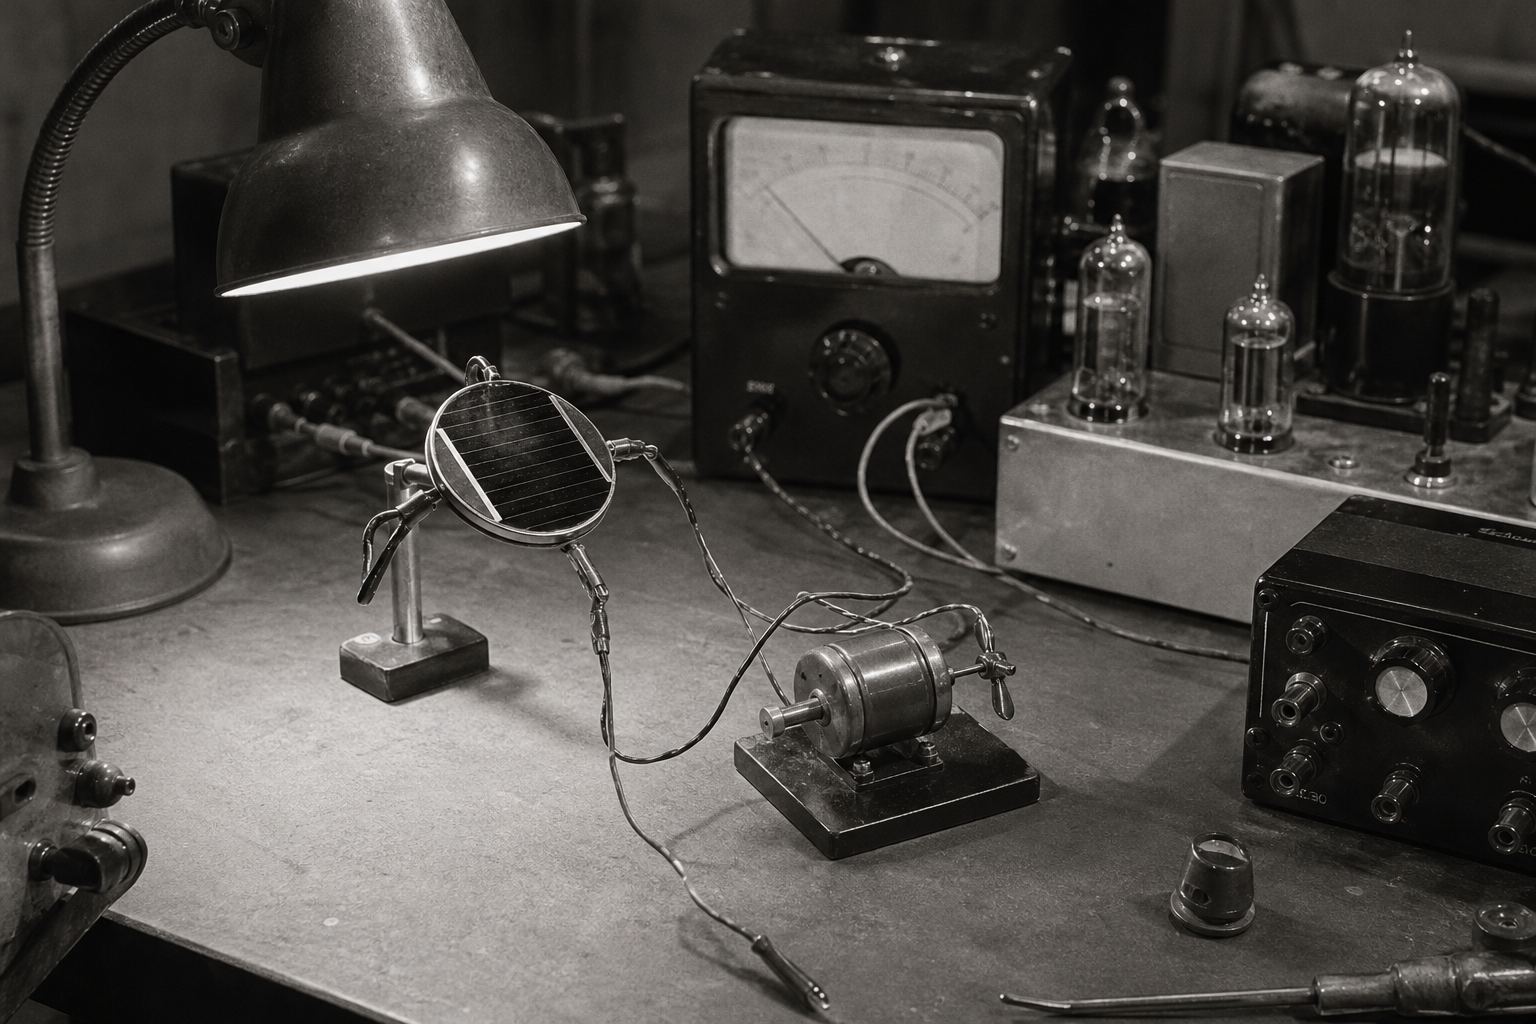
A 1950s laboratory bench Within a few years silicon cells were powering satellites. AI-generated illustration.
Chapter I · Light
Discovering the photovoltaic effect
APS News: Becquerel observed the photovoltaic effect in 1839, seeing small currents when metal electrodes were exposed to light, but could not explain it. In 1883 Charles Fritts made the first solar cells from selenium, less than one percent efficient. On 25 April 1954 Bell Labs in Murray Hill, New Jersey, announced the silicon solar cell developed by Daryl Chapin, Calvin Fuller and Gerald Pearson, about six percent efficient; within a few years solar cells were commonly used to power satellites. Einstein received the 1921 Nobel Prize in Physics, awarded in 1922, “especially for his discovery of the law of the photoelectric effect”.
The 3D crystal, cell, photons and charges are simplified teaching models, not to scale.
Almost every panel today is made of silicon, the element in ordinary sand. In a silicon crystal, each atom shares its four outer electrons with four neighbours, and these bonds hold them in place.
That makes silicon a semiconductor: a material that barely conducts electricity until its electrons are given enough energy to break loose.
That minimum energy is called the band gap, and for silicon it is about one point one electron volts.
A photon with at least that much frees one electron, leaving an empty place in the bond called a hole. So red and blue photons can do it; the weakest infrared cannot.
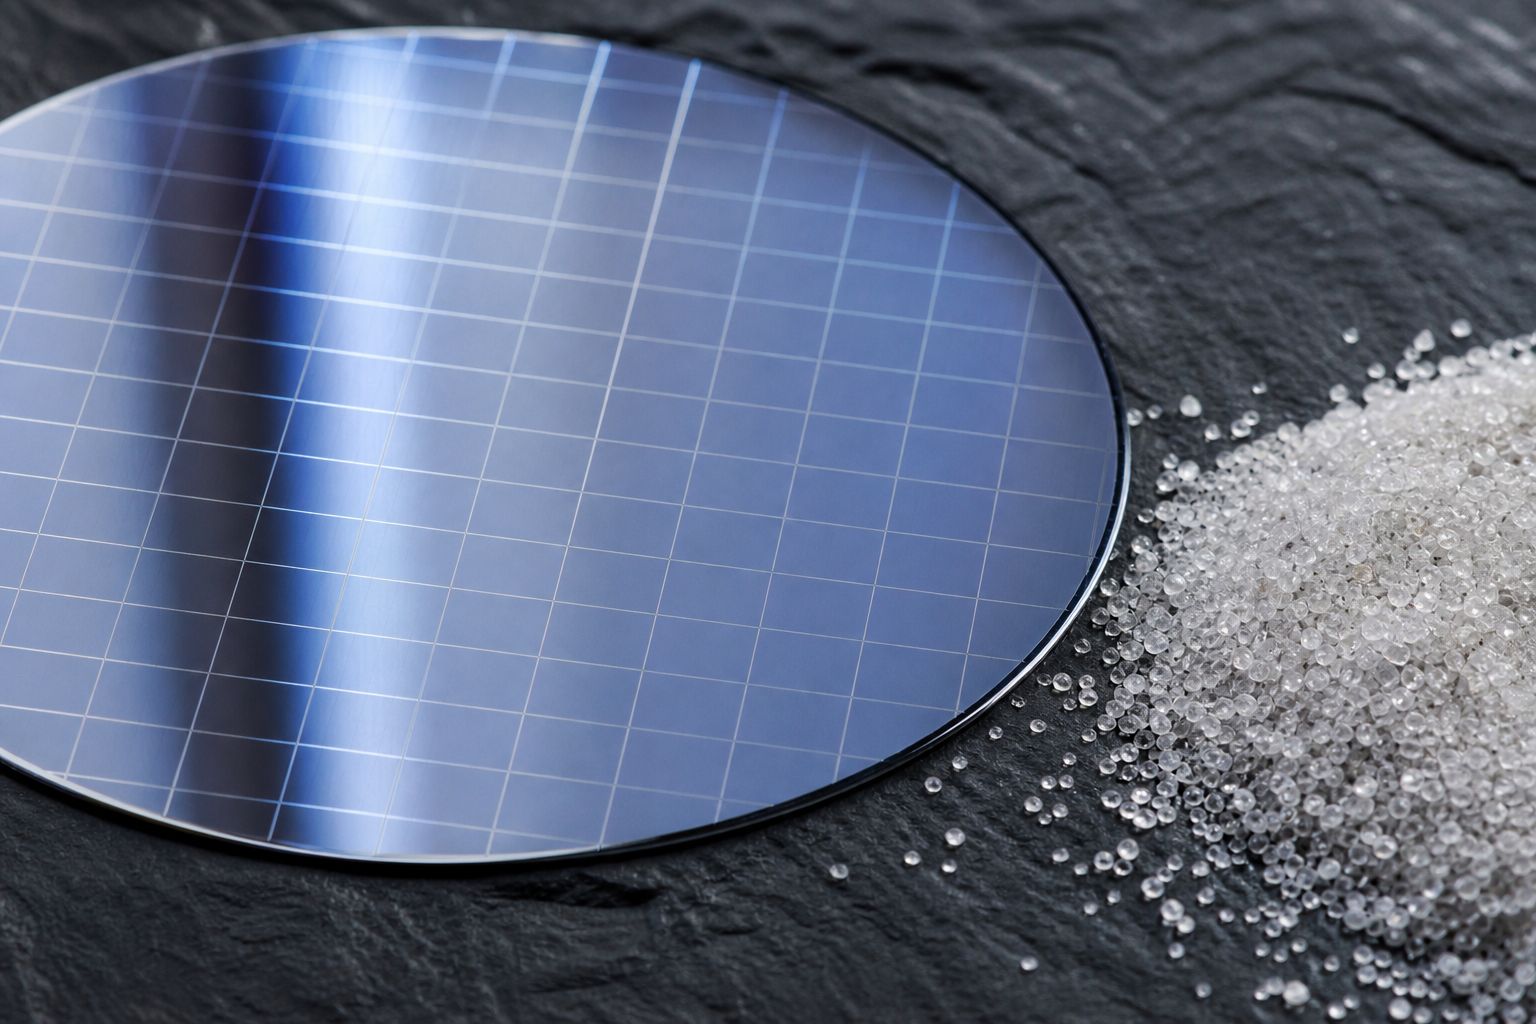
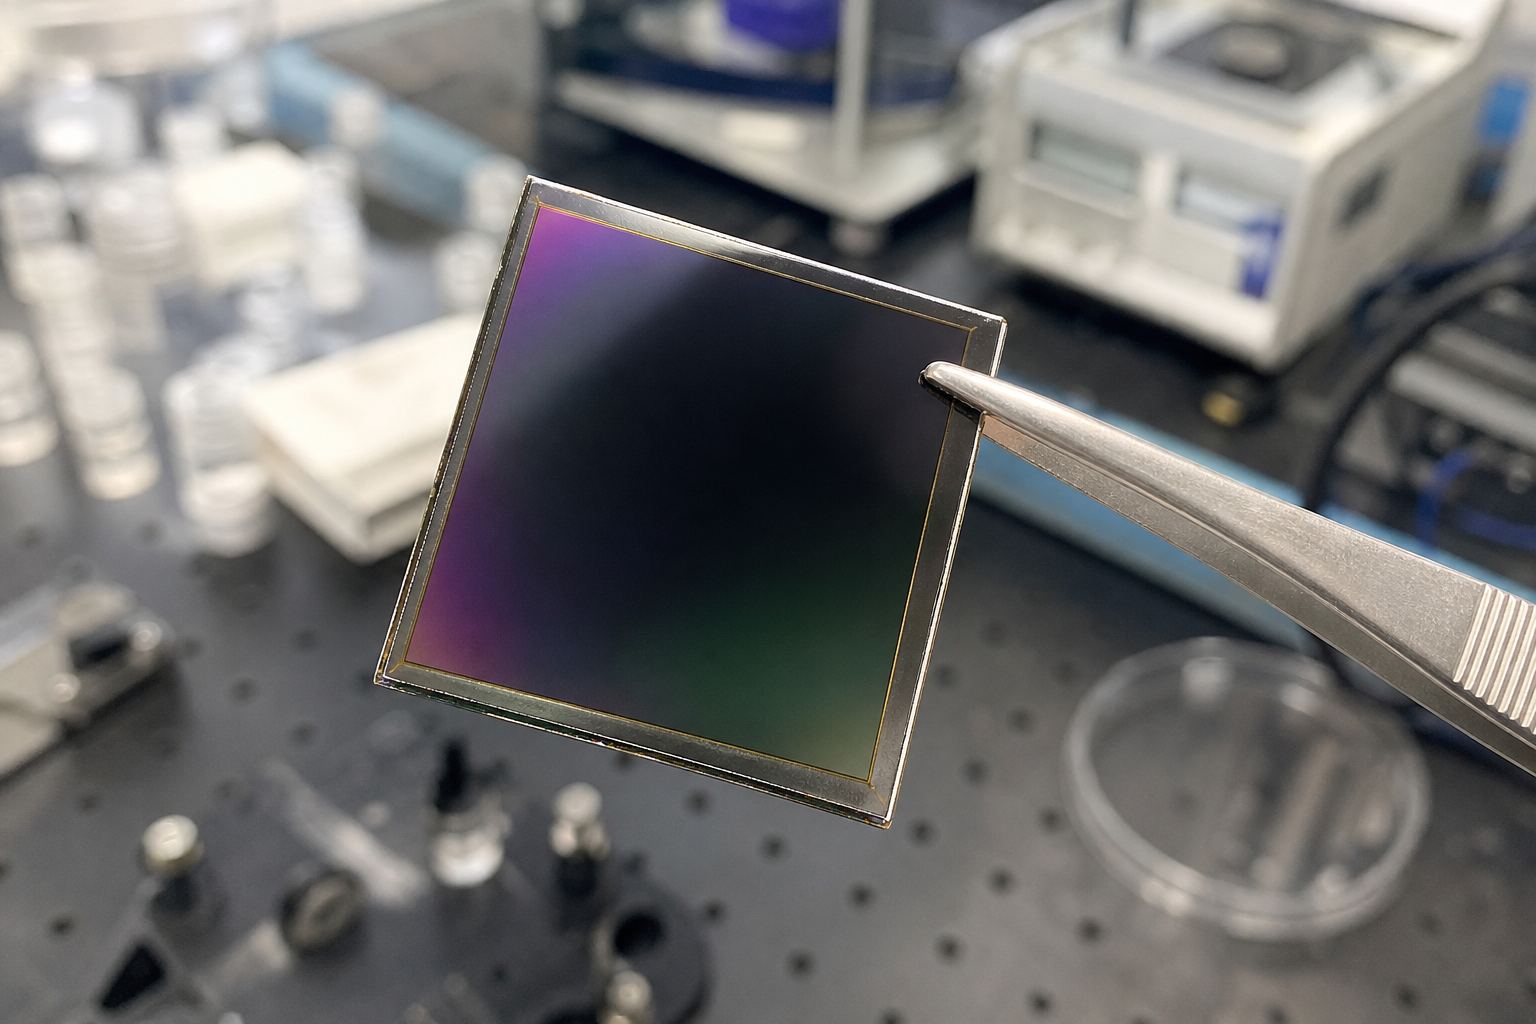
From sand to wafer Quartz sand is silicon dioxide; after purification it becomes a mirror-bright wafer. AI-generated still.
each atom bonds to four neighbours
each bond holds two shared electrons
electrons locked in place: conducts poorly
Inside the crystal (University of Bristol)
1.12
eV · band gap
1,100
nm · longest wavelength it can use
Silicon (Energy Education)
an electron, free to move: negative
a hole, an empty bond: acts as positive
together: an electron–hole pair
One photon absorbed
Chapter II · Silicon
A semiconductor and its band gap
In pure silicon each atom bonds with four neighbours, so its electrons are mostly locked in place and it conducts poorly (University of Bristol). Energy Education gives silicon’s band gap as 1.12 eV: an absorbed photon with at least that energy excites an electron into the conduction band, where it can move, leaving a hole behind. By the PVEducation formula, 1.12 eV corresponds to a wavelength of about 1.1 µm (1,100 nm), in the infrared. The US Department of Energy notes that silicon is by far the most common material in solar cells and the second most abundant element in Earth’s crust after oxygen.
The 3D crystal, cell, photons and charges are simplified teaching models, not to scale.
Freed electrons on their own soon fall back into holes. To pull them apart, engineers first add a tiny amount of other atoms, a step called doping.
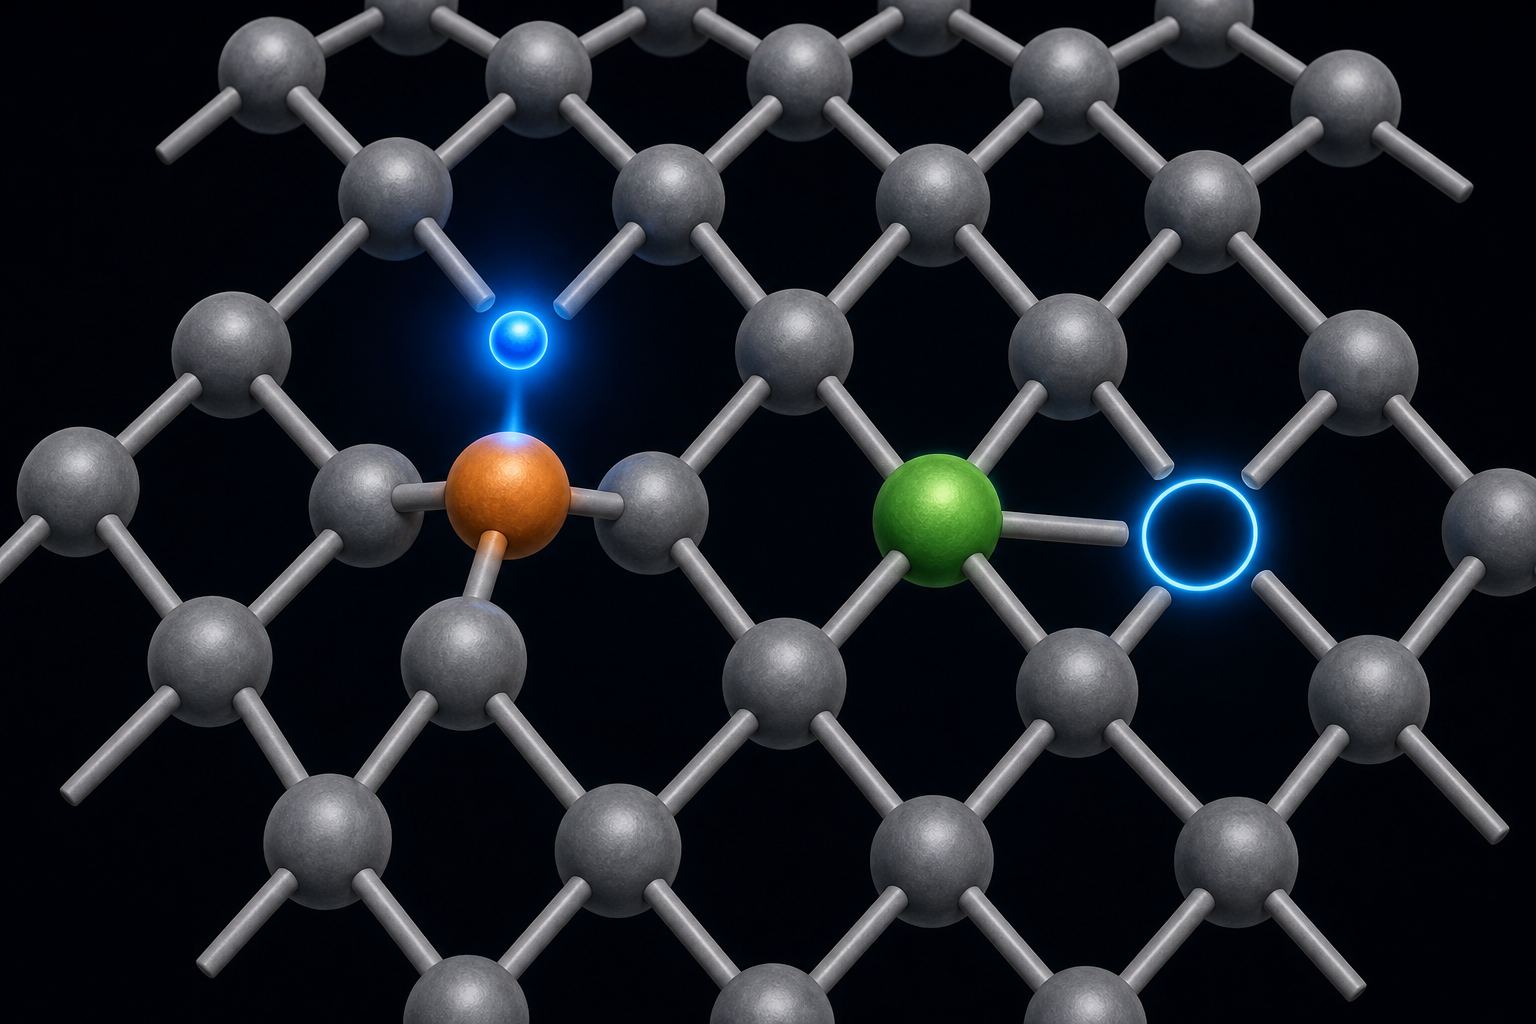
Phosphorus has five outer electrons, one more than the bonds need, so phosphorus-doped silicon has spare electrons that move freely. This is called n-type, for negative.
Boron has only three, so boron-doped silicon is full of holes that act like positive charges. That is p-type, for positive. Try each one.
Impurities on purpose Orange: an atom with an electron to spare. Green: one with an electron missing. AI-generated illustration.
4
silicon
5
phosphorus → n-type
3
boron → p-type
Outer electrons
n-type: spare electrons carry the current
p-type: holes hop from bond to bond
both stay electrically neutral overall
What moves
Chapter II · Silicon
Doping: n-type and p-type
University of Bristol: adding phosphorus, which has five outer electrons, leaves spare electrons that move freely and improve conductivity (n-type silicon); adding boron, which has three, creates holes, places where an electron is missing, which act as positive charge carriers (p-type silicon). The DOE describes the doping step in manufacturing as exposing the wafer to a gas containing an electrically active dopant. A doped wafer as a whole carries no net charge: each extra electron is balanced by the extra proton in its phosphorus nucleus, and each hole by boron’s missing one.
The 3D crystal, cell, photons and charges are simplified teaching models, not to scale.
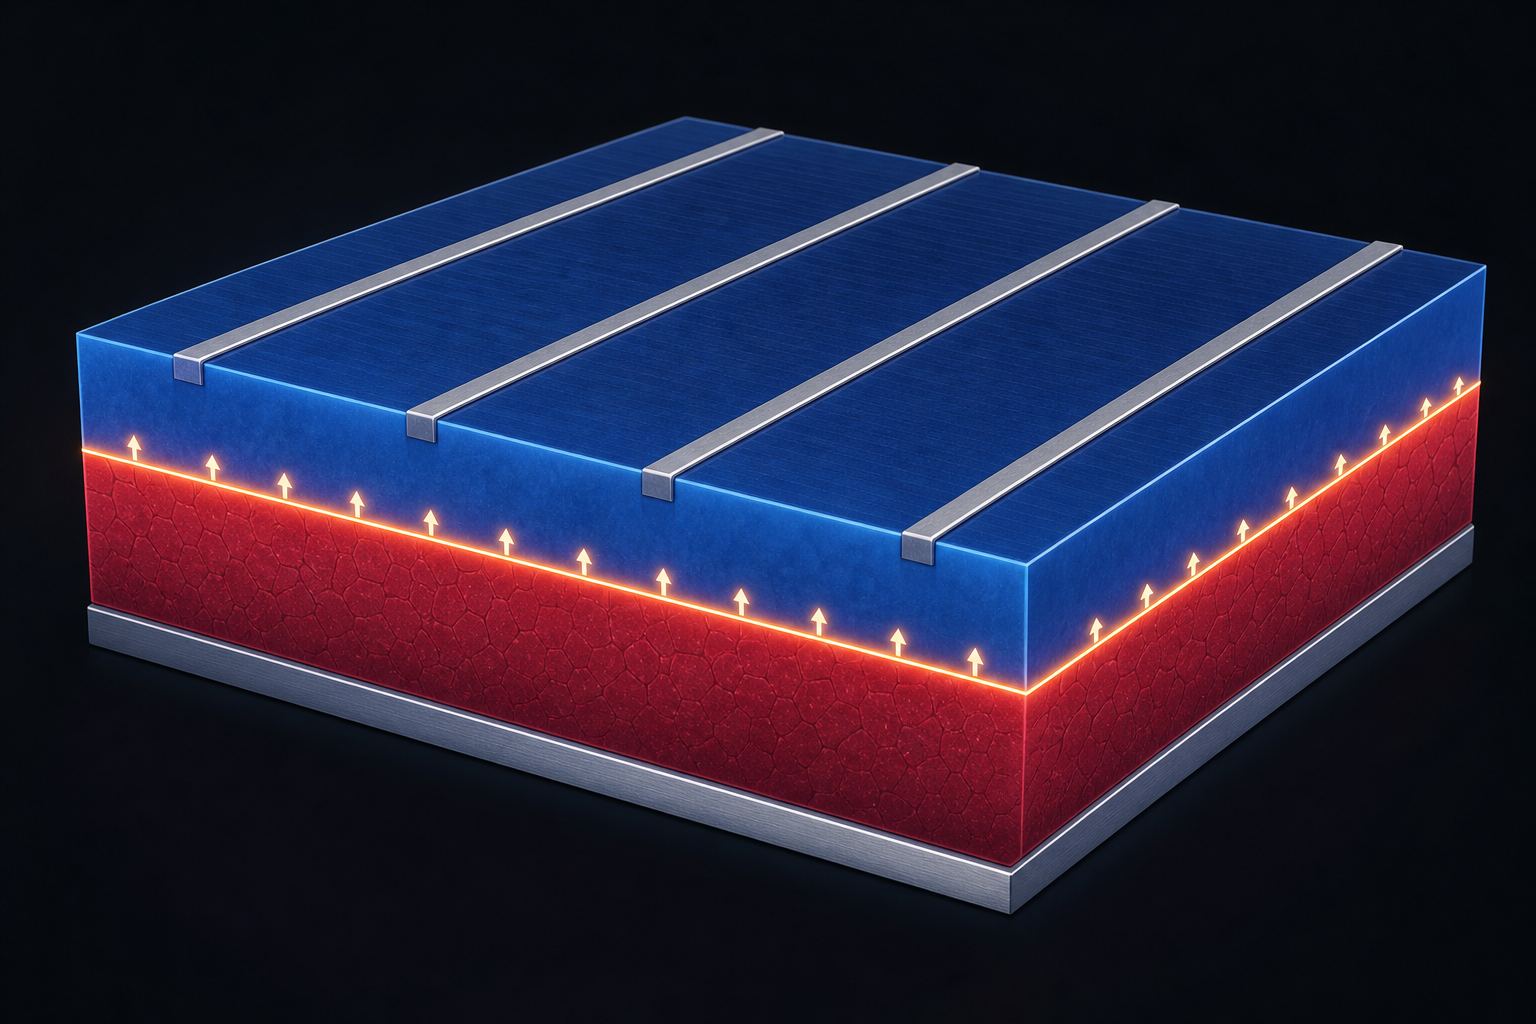
A solar cell is a thin wafer with a layer of n-type silicon on top of p-type silicon. The boundary between them is called the p-n junction.
Both sides start out neutral. Near the boundary, spare electrons drift across and fill holes. The n side has lost electrons, so it ends up slightly positive; the p side has gained them, so slightly negative. That builds a permanent electric field across the junction.
That field works like a one-way slope: it pushes electrons toward the n side, and holes toward the p side.
A cell in cross-section Blue: the thin n-type top layer. Red: the thicker p-type base. Schematic, AI-generated.
before: both layers neutral
electrons cross from n into p and fill holes
How the field forms
n side: fixed + charges
p side: fixed − charges
the field points from + to −
Left behind
electrons → pushed up, to the n side
holes → pushed down, to the p side
The one-way slope
Chapter III · The junction
The p-n junction and its built-in field
APS News describes how doping creates positively and negatively charged regions that meet at a p-n junction, building an electric field. Energy Education: when p-type and n-type semiconductors are joined, charge carriers move and an electric field forms in the region of the junction, driving negative and positive charges in opposite directions. University of Bristol: where the layers meet, electrons and holes recombine, forming a barrier and an electric field; the field pushes light-freed electrons toward the n side and holes toward the p side.
In the model the junction is drawn thick so it can be seen; in a real cell the field region is a tiny fraction of the wafer.
The 3D crystal, cell, photons and charges are simplified teaching models, not to scale.
Now shine light on the cell. Each absorbed photon frees an electron and a hole, close enough for the field to catch them.
The field sweeps the electrons up to the metal lines on top, and the holes down to the metal at the back. The two faces charge up, like the two ends of a battery.
Connect a wire, and the electrons flow round through the bulb to meet the holes at the back. That flow is electric current, made by light alone. Open and close the circuit.
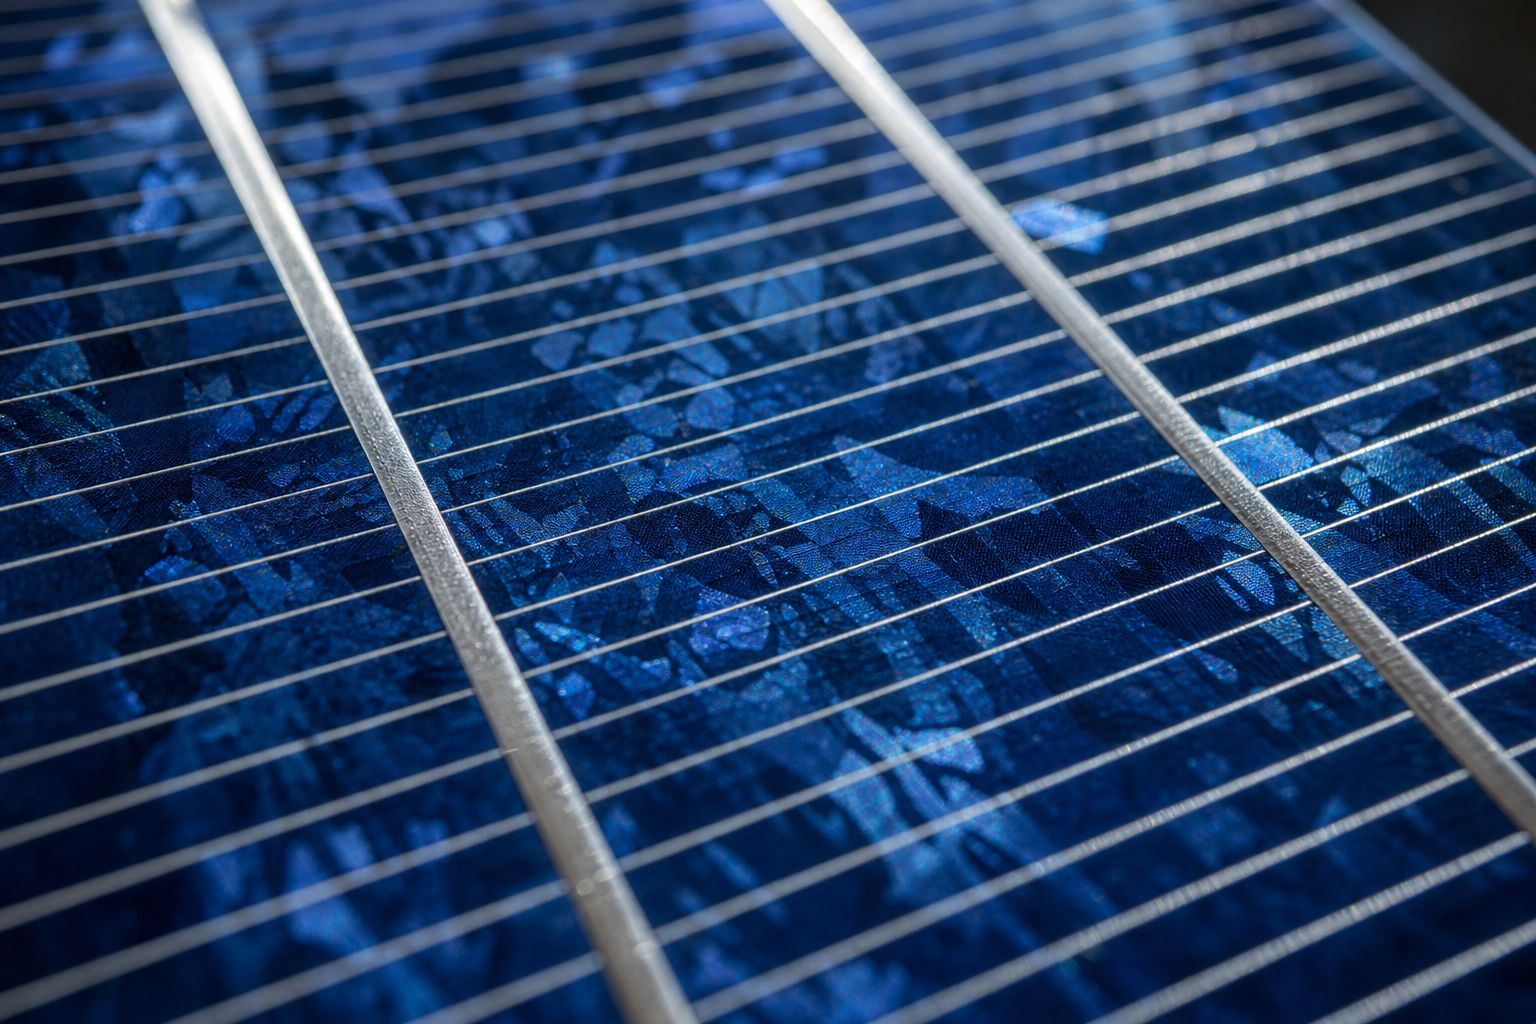
The top of a cell Thin silver lines collect electrons while letting most light through. AI-generated still.
absorb: a photon makes an electron–hole pair
separate: the field pulls them apart
collect: metal contacts take them to the wire
Three steps, every photon
electrons leave from the top contact
they do work in the bulb
they return through the back and fill holes
In the wire
Chapter III · The junction
From light to current
University of Bristol: photons with enough energy free electrons and leave holes behind; the junction’s field pushes electrons toward the n side and holes toward the p side; when an external circuit connects the two sides, electrons flow through it, producing current, and the cell’s electric field provides the voltage. The DOE: the current is collected through metal contacts, the grid-like lines on the cell, typically screen-printed silver.
Arrows of electron flow are shown; by convention, “current” is drawn the other way.
The 3D crystal, cell, photons and charges are simplified teaching models, not to scale.
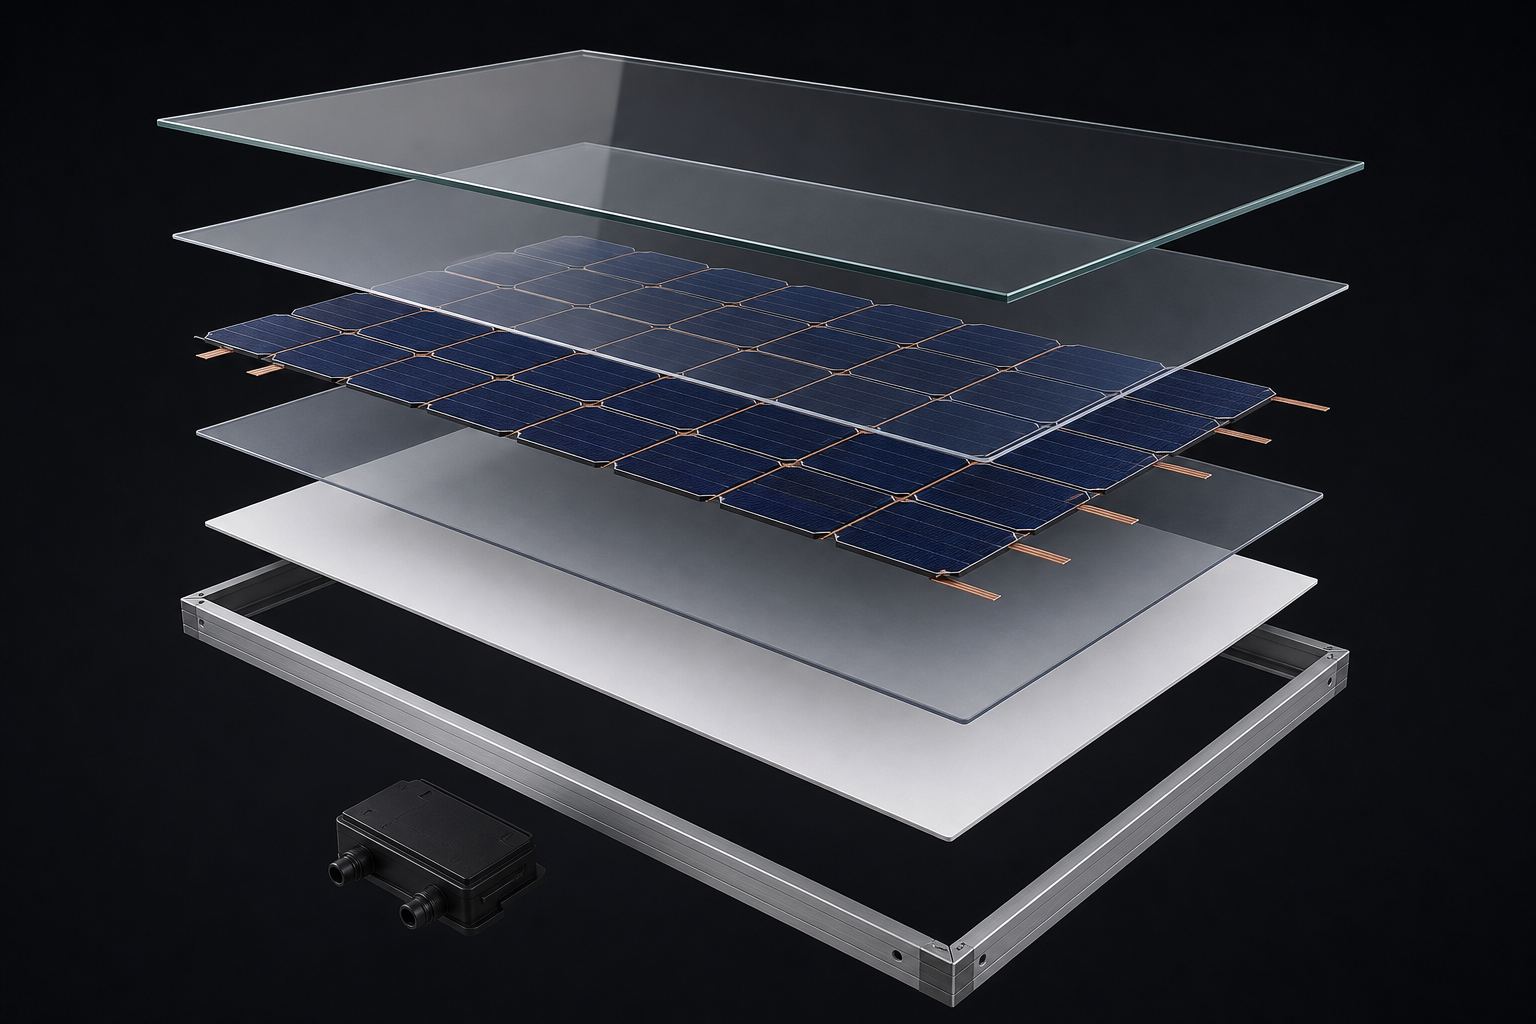
One cell gives only a small voltage, so dozens are wired together, sealed under glass and framed. That is a module, what most people call a panel.
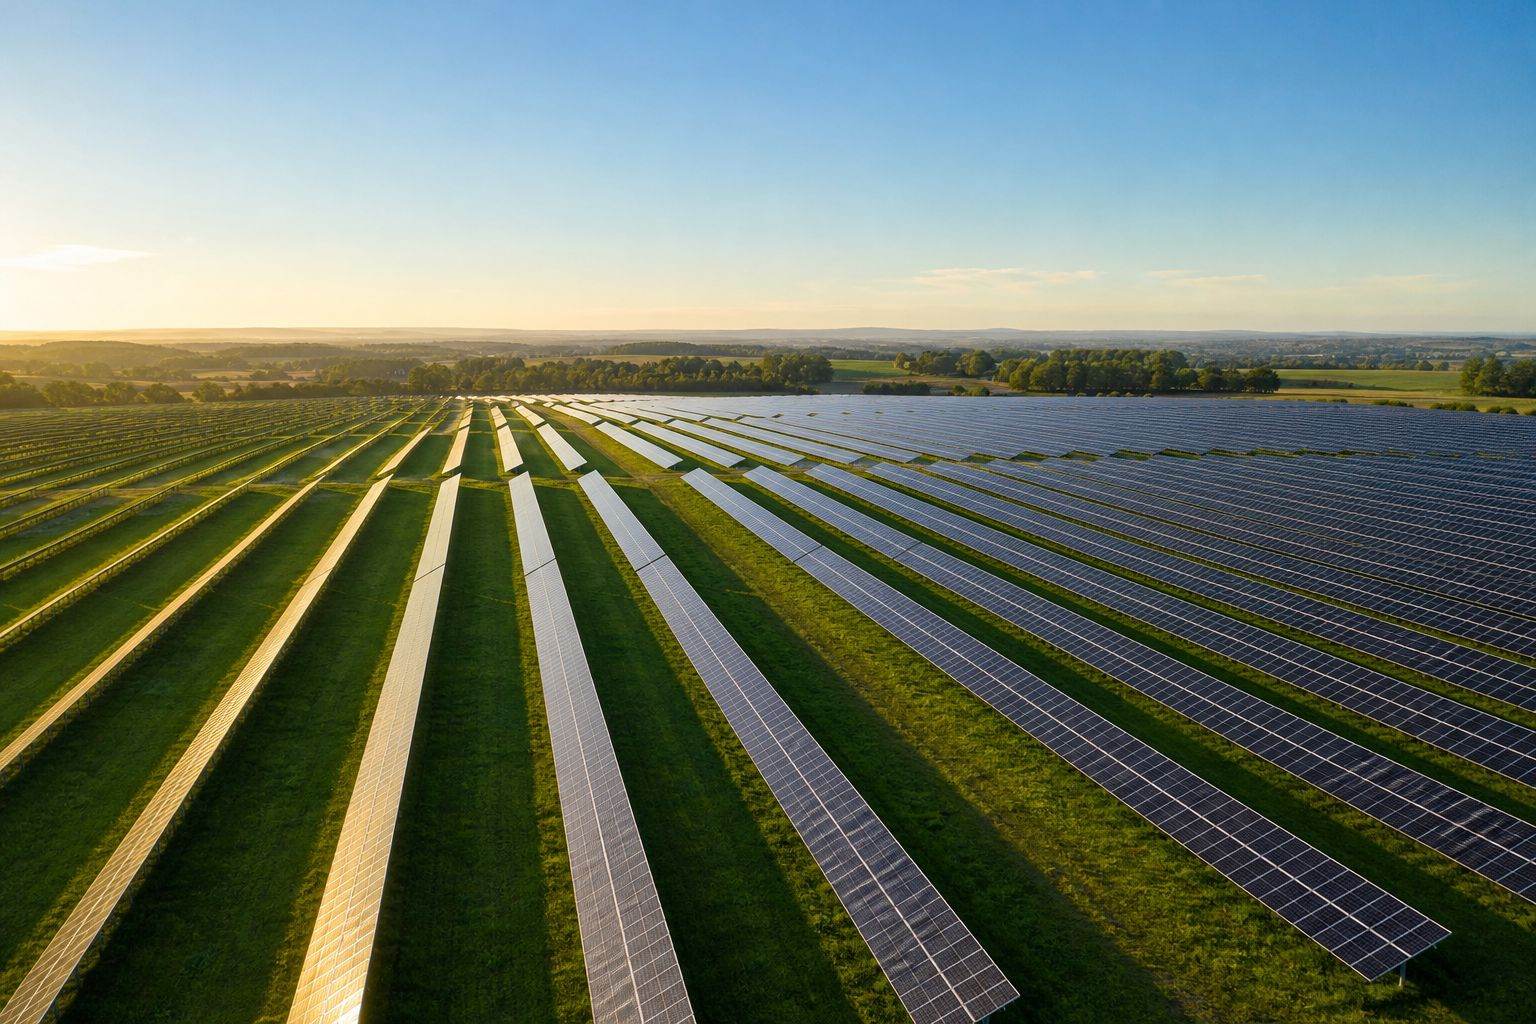
Modules joined together make an array, on a roof or across a field.
Silicon modules are expected to last twenty-five years or more, still giving over eighty percent of their original power.
Inside a module Glass, encapsulant, cells on copper ribbons, encapsulant, backsheet, frame, junction box. AI-generated illustration.An array A large solar farm can cover many square kilometres. AI-generated still.
25+
years expected life
>80%
of original power after that
Silicon modules (US DOE)
Chapter IV · From cell to grid
Cells, modules and arrays
DOE manufacturing basics: solder-coated copper ribbons connect the cells (tabbing and stringing); the cells are laid between sheets of encapsulant and glass or a backsheet and laminated in an oven to make the module waterproof; the module then gets an aluminium frame, edge sealant and a junction box with diodes. Modules are joined into arrays. The DOE says silicon modules are expected to last 25 years or more and to keep more than 80% of their original power after that time.
The 3D crystal, cell, photons and charges are simplified teaching models, not to scale.
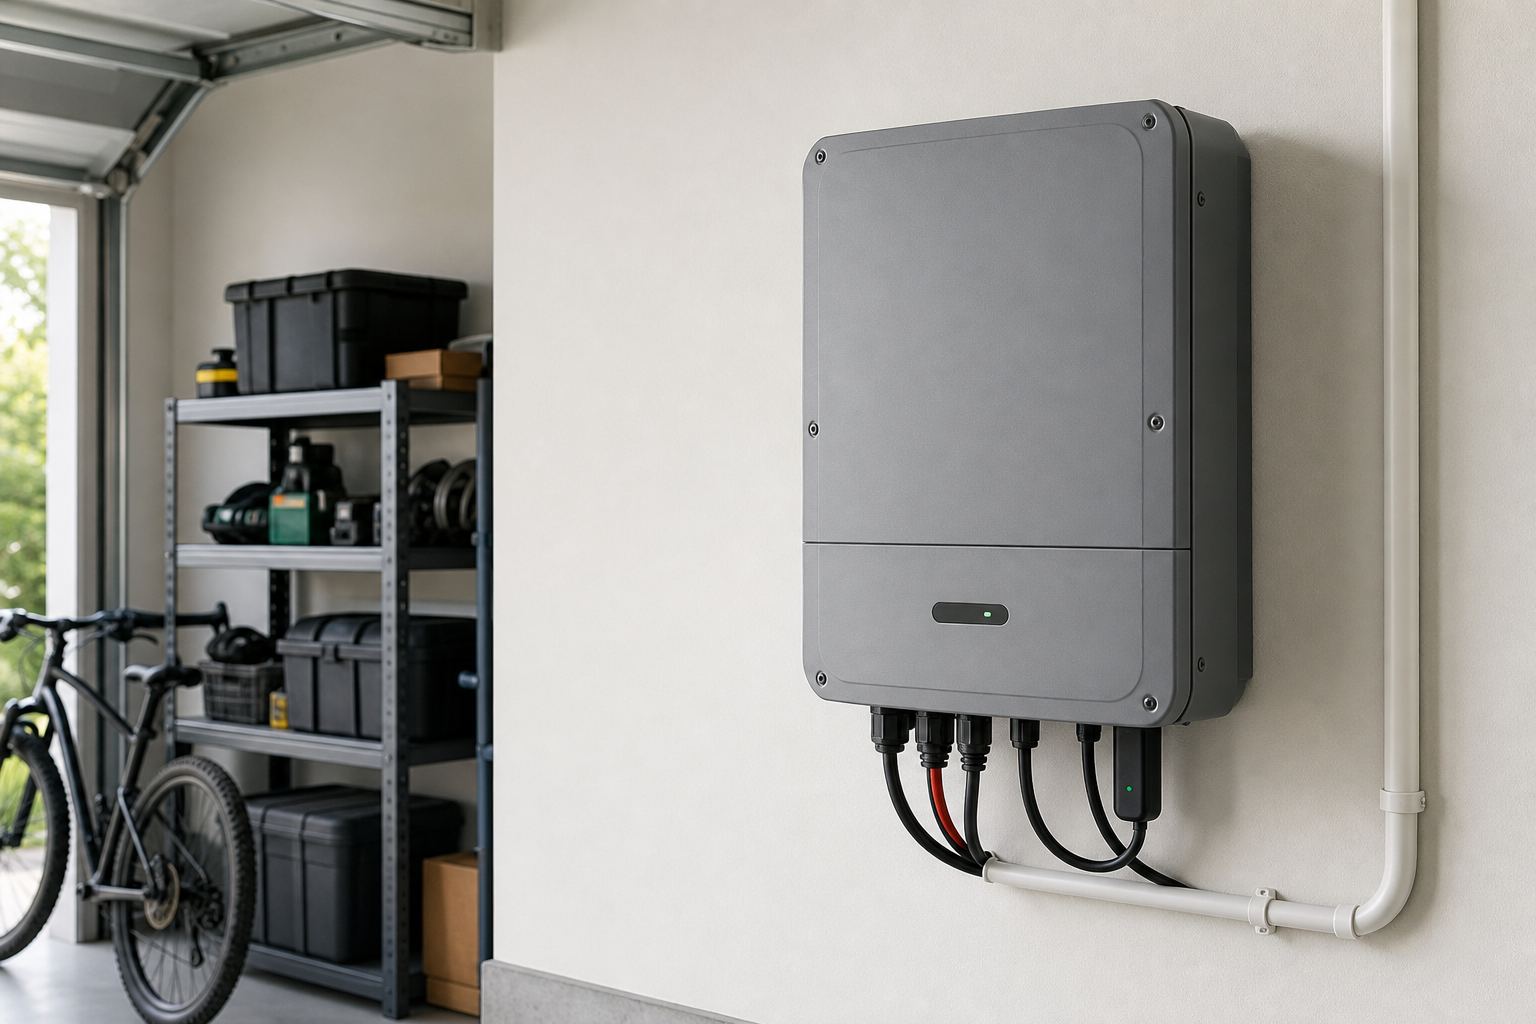
A panel makes direct current, DC, which flows one way only. Homes and the power grid run on alternating current, AC, which reverses direction many times every second.
So a box called an inverter switches the DC back and forth, and shapes it into a smooth wave the grid can use.
Some systems give each panel its own microinverter, so one shaded panel does not drag down the rest.
A home inverter Usually mounted near the meter, where the panels’ cables come in. AI-generated still.
DC: a steady push in one direction
AC: a push that reverses, as a sine wave
the inverter matches the grid’s wave
Two kinds of current
string inverter: cheaper; shading one panel lowers the string
microinverters: each panel independent; can cost more
String or micro? (US DOE)
Chapter IV · From cell to grid
Inverters: DC to AC
US DOE: an inverter converts the direct current (DC) produced by solar panels into alternating current (AC), the form the grid uses, shaping its output into a clean, repeating sine wave the grid can use without damaging electrical equipment. A string inverter serves a whole string of panels and is cost-effective, but output can drop if one panel is shaded or faulty; microinverters sit on each panel, so a problem with one does not affect the others, but they can cost more.
The 3D crystal, cell, photons and charges are simplified teaching models, not to scale.
Above the atmosphere, sunlight brings about thirteen hundred and sixty watts on every square metre. At sea level on a clear day, about a thousand reach the ground.
When the Sun is low, the same beam is spread over a wider area, so each square metre gets less: the power falls with the cosine of the angle away from straight overhead.
Low sunlight also crosses more air on the way. Move the Sun and watch the output.
1,361
W · top of the atmosphere
~1,000
W · sea level, clear day, at most
Sunlight, per square metre (Wikipedia)P≈Pmaxcosθ
θ
angle between the Sun and the line perpendicular to the panel
Pmax
power when facing the Sun squarely
Low Sun Long shadows: the light grazes the panels and arrives through more air. AI-generated still.
Chapter IV · From cell to grid
Sunlight and angle
Wikipedia, Solar irradiance: the average solar radiation at the top of Earth’s atmosphere is about 1361 W/m²; atmospheric attenuation leaves a maximum normal surface irradiance of about 1000 W/m² at sea level on a clear day. Insolation on a surface is reduced in proportion to the cosine of the angle between the Sun and the surface’s perpendicular, and at a lower angle the light also travels through more atmosphere.
The model shows only the cosine effect, for a flat panel; real output also depends on air, temperature and the panel itself.
The 3D crystal, cell, photons and charges are simplified teaching models, not to scale.
No cell can use all of sunlight. Photons with less energy than the band gap, including much of the infrared, pass straight through.
Photons with more free an electron too, but the extra energy is lost as heat almost at once. That is the biggest loss of all.
In 1961 William Shockley and Hans-Joachim Queisser calculated the ceiling this sets for one junction. Later work puts it near thirty-three percent, and thirty-two for silicon.
Pick a photon and see where its energy goes.
A hot panel Unused energy warms the panel, and a hotter cell gives a lower voltage. AI-generated still.
excess lost as heat
~33
too weak: passes through
~19
radiated by the warm cell
~7
left as electricity, at most
~32
Where sunlight’s energy goes in a silicon cell (Wikipedia) Rounded; smaller losses take the remaining ~9%. The 7% is the black-body glow any room-temperature cell gives off.
~33%
best band gap, 1.34 eV
~32%
silicon, 1.1 eV
Shockley–Queisser limit, one junction
infrared, 0.9 eV: passes through
red, 1.8 eV: about 0.7 eV becomes heat
blue, 2.8 eV: about 1.7 eV becomes heat
Three photons in silicon (gap 1.12 eV)
Chapter V · The limits
The Shockley–Queisser limit
PVEducation: photons with less energy than the band gap pass through the semiconductor as if it were transparent; those with more are strongly absorbed, but the extra energy is wasted as heat when the electron drops back to the band edge. Wikipedia: William Shockley and Hans-Joachim Queisser published their limit in 1961; later calculations with measured sunlight give about 33–34% for a single junction with a 1.34 eV band gap, and about 32% for silicon’s 1.1 eV (about 29.4% once a further internal loss, Auger recombination, is included). For silicon, roughly 19% of sunlight’s energy is below the gap, and the excess-energy loss is about a third of incoming sunlight; the black-body radiation that a cell at room temperature gives off takes about 7%.
The 3D crystal, cell, photons and charges are simplified teaching models, not to scale.
Real cells lose a little more: some light bounces off the surface, the metal lines cast small shadows, and a hot cell gives a lower voltage.
According to Germany's Fraunhofer Institute, commercial modules have risen from about seventeen percent to just under twenty-five; the best lab silicon cells reach almost twenty-eight.
To beat that ceiling, researchers stack two materials with different band gaps. Cells stacking silicon with a newer crystal, perovskite, first passed the ceiling in 2023, and by July 2026 a lab cell reached thirty-five and a half percent.
reflection from the surface
shading by the metal lines
heat lowers the voltage
Extra losses in a real cell
Bell Labs, 1954
~6
modules, earlier
~17
modules, now
<25
best lab silicon cell
27.9
tandem, 2023
33.9
tandem, 2026
35.5
Efficiency (APS; Fraunhofer ISE; Wikipedia; pv magazine) Tandem: perovskite on silicon, lab cells. The 2026 record is LONGi’s, certified by the EU’s ESTI lab.
two stacked band gaps: about 42% in theory
three: about 49%
each layer takes its own slice of the spectrum
Beyond one junction (Wikipedia)A tandem cell Top layer takes the blue end of sunlight; silicon below takes the red and near-infrared. AI-generated still.
Chapter V · The limits
Efficiency today
Fraunhofer ISE’s Photovoltaics Report (version of 14 July 2026): commercial silicon modules have improved in efficiency from about 17% to just under 25%; laboratory cells reach up to 27.9% for monocrystalline silicon and 26.9% for perovskite. Wikipedia: stacking cells with different band gaps (multijunction or tandem cells) can exceed the single-junction limit, with a theoretical limit of about 42% for two layers; in 2023 a silicon–perovskite tandem cell reached 33.9%, the first silicon-based cell to exceed the Shockley–Queisser limit. pv magazine reported on 15 July 2026 that LONGi had announced a two-terminal perovskite–silicon tandem cell with 35.5% efficiency, independently certified by the European Solar Test Installation (ESTI) of the European Commission’s Joint Research Centre. Reflection, contact shading and heating are further practical losses. The 1954 figure is from APS News.
In the model, some photons bounce off the top surface to show reflection.
The 3D crystal, cell, photons and charges are simplified teaching models, not to scale.
This is the know-how in China's draft: making a panel takes five stages. First, silicon from quartz sand is purified into polysilicon: extremely pure silicon made of many small crystals.
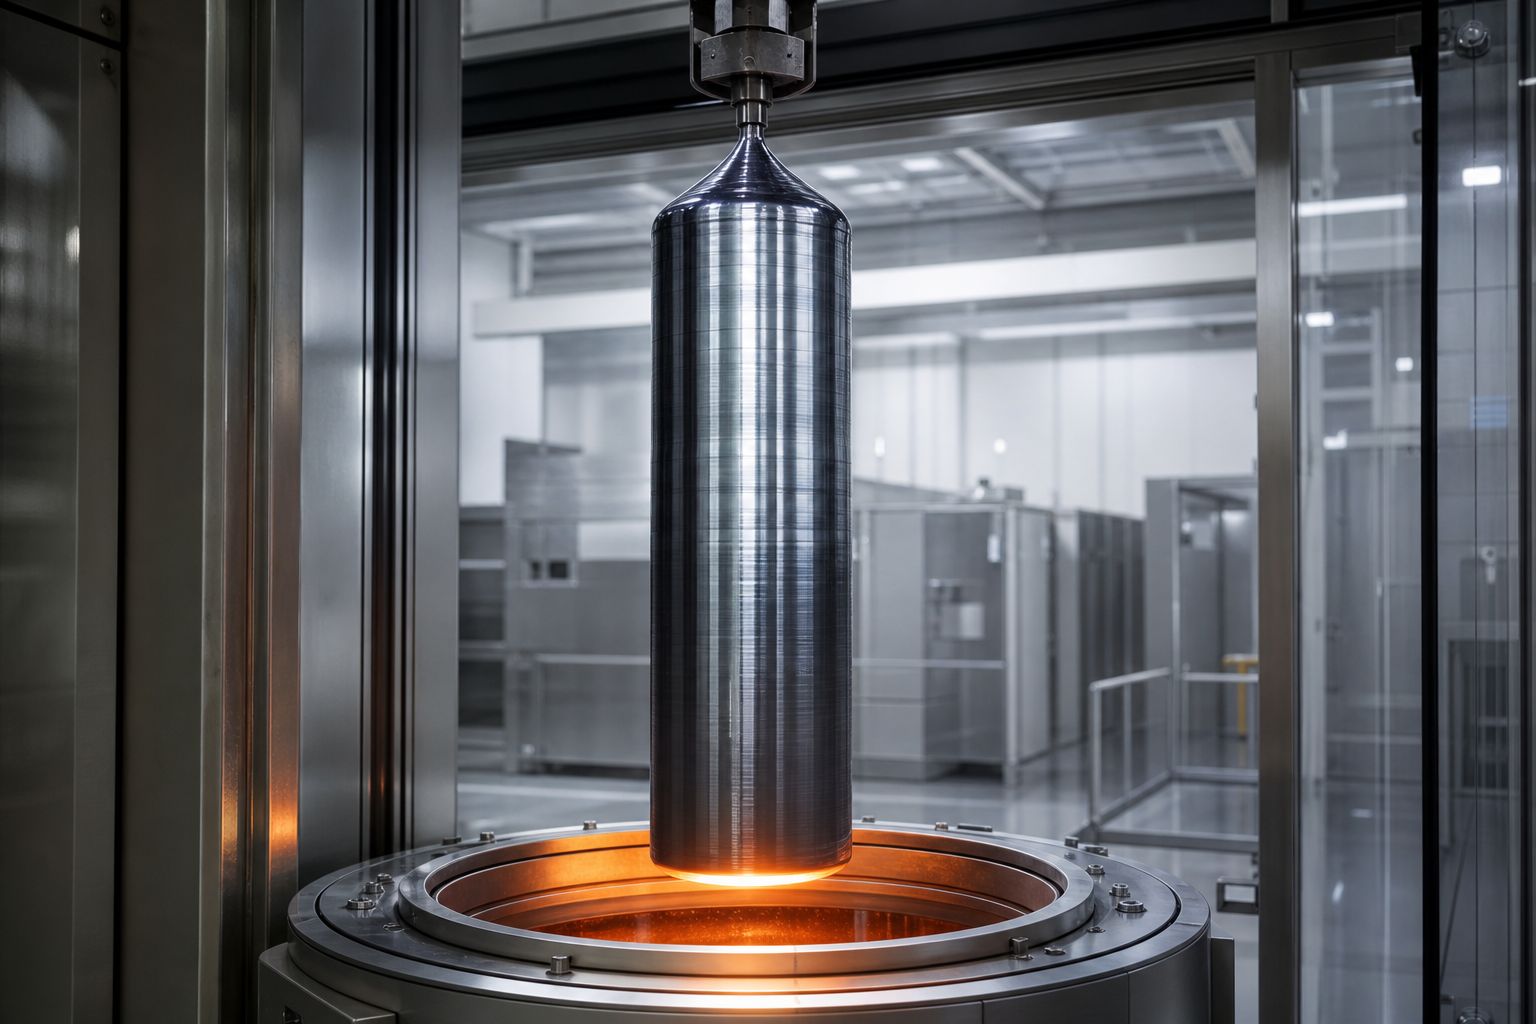
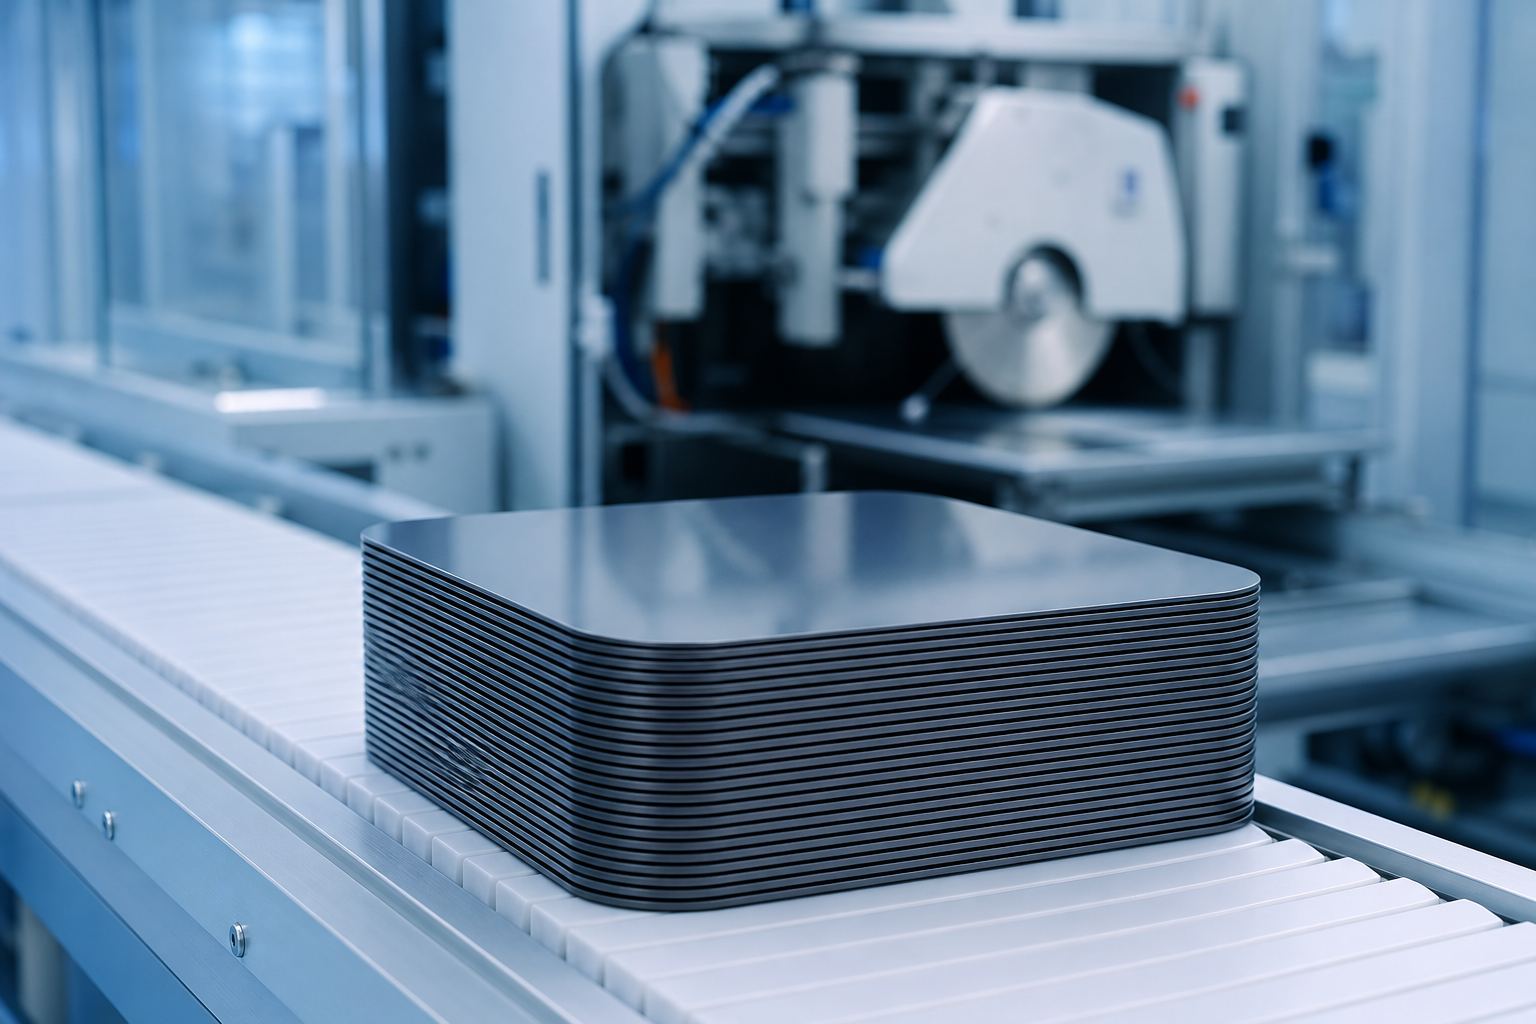
It is melted, and one large crystal, an ingot, is pulled from the melt. Diamond wire saws slice it into thin wafers, which become cells, then modules.
According to the IEA, at the end of 2021 China held most of the world's capacity at every stage: about 79% of polysilicon, 97% of wafers, 85% of cells and 75% of modules. Pick a stage.
Growing an ingot A seed crystal touches molten silicon and is drawn slowly upward (the Czochralski method). AI-generated still.Wafers The sawdust of the cut, called kerf, is a loss of costly silicon. AI-generated still.
polysilicon
79 %
wafers
97 %
cells
85 %
modules
75 %
China’s share of world capacity, end of 2021 (IEA)
Chapter VI · Making panels
The manufacturing chain
US DOE: metallurgical-grade silicon made from quartz sand is turned into gases with hydrogen and chlorine, and silicon is deposited on heated filaments or beads to make polysilicon, “a high-purity, fine-grained crystalline silicon product”. Polysilicon is melted and a monocrystalline ingot is grown by touching a small seed crystal to the melt and pulling it slowly upward (the Czochralski method); diamond-coated wire saws slice the ingot into wafers, the sawdust being called kerf. Wafers are textured, doped and given contacts to make cells; cells are assembled into modules. Two measures appear in the sources. The IEA’s 2022 executive summary says China’s share in all the manufacturing stages of solar panels exceeds 80%, describing the situation in 2022; Canary Media’s chart of the report’s capacity data for the end of 2021 shows, by stage, 79% of polysilicon, 97% of wafer, 85% of cell and 75% of module capacity. The IEA’s 2024 report says China alone has more than 80% of module manufacturing capacity and 95% for wafers.
The IEA figures are shares of manufacturing capacity, not of output, and the ingot stage has no separate figure in the chart used here.
The 3D crystal, cell, photons and charges are simplified teaching models, not to scale.
Scale brought prices down. IRENA, the International Renewable Energy Agency, says building a large solar plant cost eighty-seven percent less in 2024 than in 2010.
The IEA has warned that having most of the chain in one country is a risk, and urged making panels in more places. China's ministries say their draft covers only technology above set thresholds, not the panels themselves.
In Thailand, a government programme's first phase aims to help half a million households put panels on their roofs.
−87%
installed cost, 2010–2024
$691
per kW installed, 2024
41%
cheaper than cheapest new fossil option
Utility-scale solar (IRENA, via pv magazine)
IEA (2022): concentration is a risk; diversify
China’s ministries (2026): national security; only above thresholds
the draft is open for comment
Two framings, four years apartRooftops in Thailand First phase: 500,000 households; equipment must meet IEC or Thai Industrial Standards. AI-generated still.
Chapter VI · Making panels
Costs, concentration and Thailand
pv magazine, reporting IRENA’s Renewable Power Generation Costs in 2024: the global weighted-average total installed cost of utility-scale solar fell 87% from 2010 to USD 691 per kW, and solar was 41% cheaper than the lowest-cost fossil-fuel alternatives in 2024. The IEA’s 2022 supply-chain report found China’s share in all manufacturing stages above 80%, called that level of concentration “a considerable vulnerability”, and said that “diversification can reduce supply chain vulnerabilities”. China’s ministries say the 2026 draft applies only above set thresholds and not to products made with the listed technologies (Geopolitechs). For Thailand, pv magazine reported on 5 August 2026 that the Metropolitan and Provincial Electricity Authorities were registering solar vendors and equipment for a THB 200 billion energy-transition programme whose first phase aims to enable 500,000 households to install rooftop solar. IEA PVPS lists 3,310 MWp of rooftop PV in Thailand for 2024.
The 3D crystal, cell, photons and charges are simplified teaching models, not to scale.
So a solar panel is a trap for light, and one junction can catch only about a third of it. Stacked tandem cells could, in theory, reach about forty-two percent.
The know-how to make such cells and panels, not the sunlight, is what China's October draft proposes to control.
1839 Becquerel: light makes a current
1954 Bell Labs silicon cell, ~6%
1961 Shockley–Queisser limit
2023 tandem cell passes the ceiling, 33.9%
Jul 2026 tandem cell record, 35.5%
Oct 2026 China’s draft export catalogue
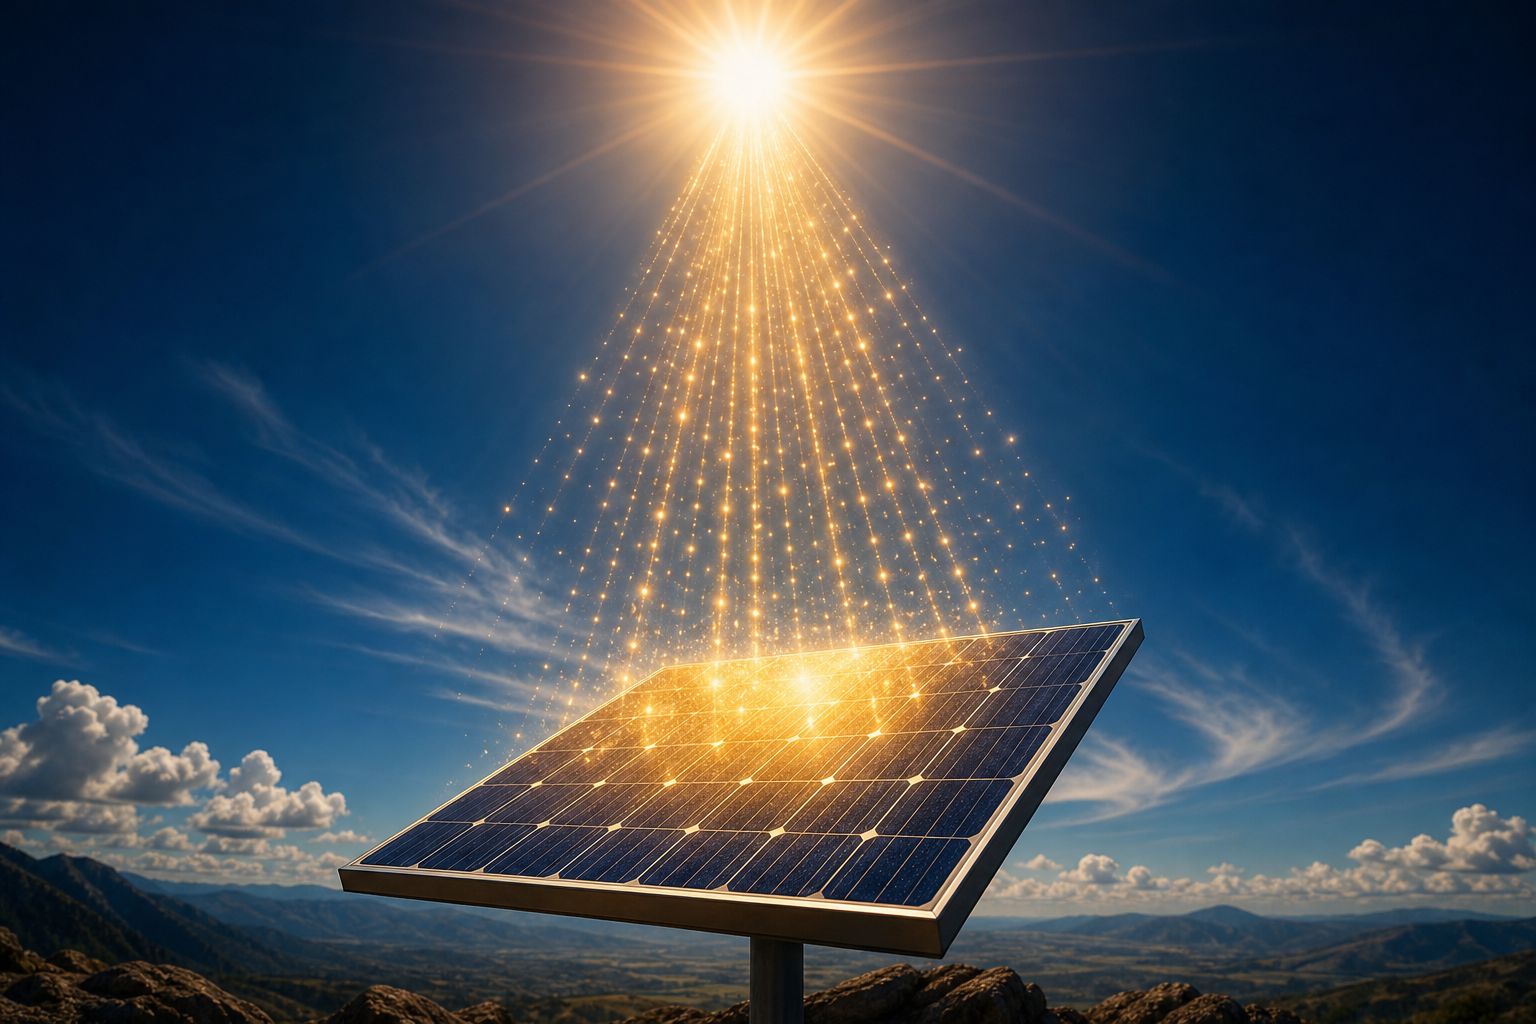
MilestonesSunlight on a panel All stills and illustrations in this film are AI-generated.
Epilogue · Sources
How solar panels work
Photons, the band gap, doping, the p-n junction, inverters and the Shockley–Queisser limit are established physics and engineering, found in textbooks and the sources below. Market figures are attributed to the agencies that published them, with their dates. The October 2026 Chinese draft is a proposal open for comment, described here as reported.
The 3D crystal, cell, photons and charges are simplified teaching models, not to scale. All stills are AI-generated.