In October 2026 Indonesia fought its worst forest fires in more than a decade, and smoke covered parts of Malaysia, Singapore and beyond. This film explains where that haze comes from: tropical peat, a soil made of plants that never rotted; the canals that drain it; fire used to clear land; why peat smoulders underground for weeks and is so hard to put out; how El Niño and the monsoon decide how bad a year is and where the smoke goes; what fine particles do in the lungs; and what keeping peat wet can do.
Interactive 3D film11 min1996 to 2026Published 24 October 2026
Most of the smoke that has covered Southeast Asia this autumn does not come from burning trees. It comes from the ground itself.
In mid-October 2026, Indonesia was fighting its worst forest fires in more than a decade, most of them on Sumatra and Borneo. On the fifteenth of October, four people fighting a separate fire on a mountain in East Java died in the flames.
For weeks the haze had drifted over Malaysia, Singapore and Brunei, and as far as the Philippines, southern Vietnam and Thailand. Where does so much smoke come from, and why is it so hard to stop?
most
of Indonesia’s haze comes from peatland (Greenpeace, via AFP)
< 1/3
of its fires burn on peat
Where the smoke comes from
799
hotspots in one night: satellite pixels flagged as burning (Forestry Ministry)
1 fire ≠ 1
one fire can show up as several hotspots
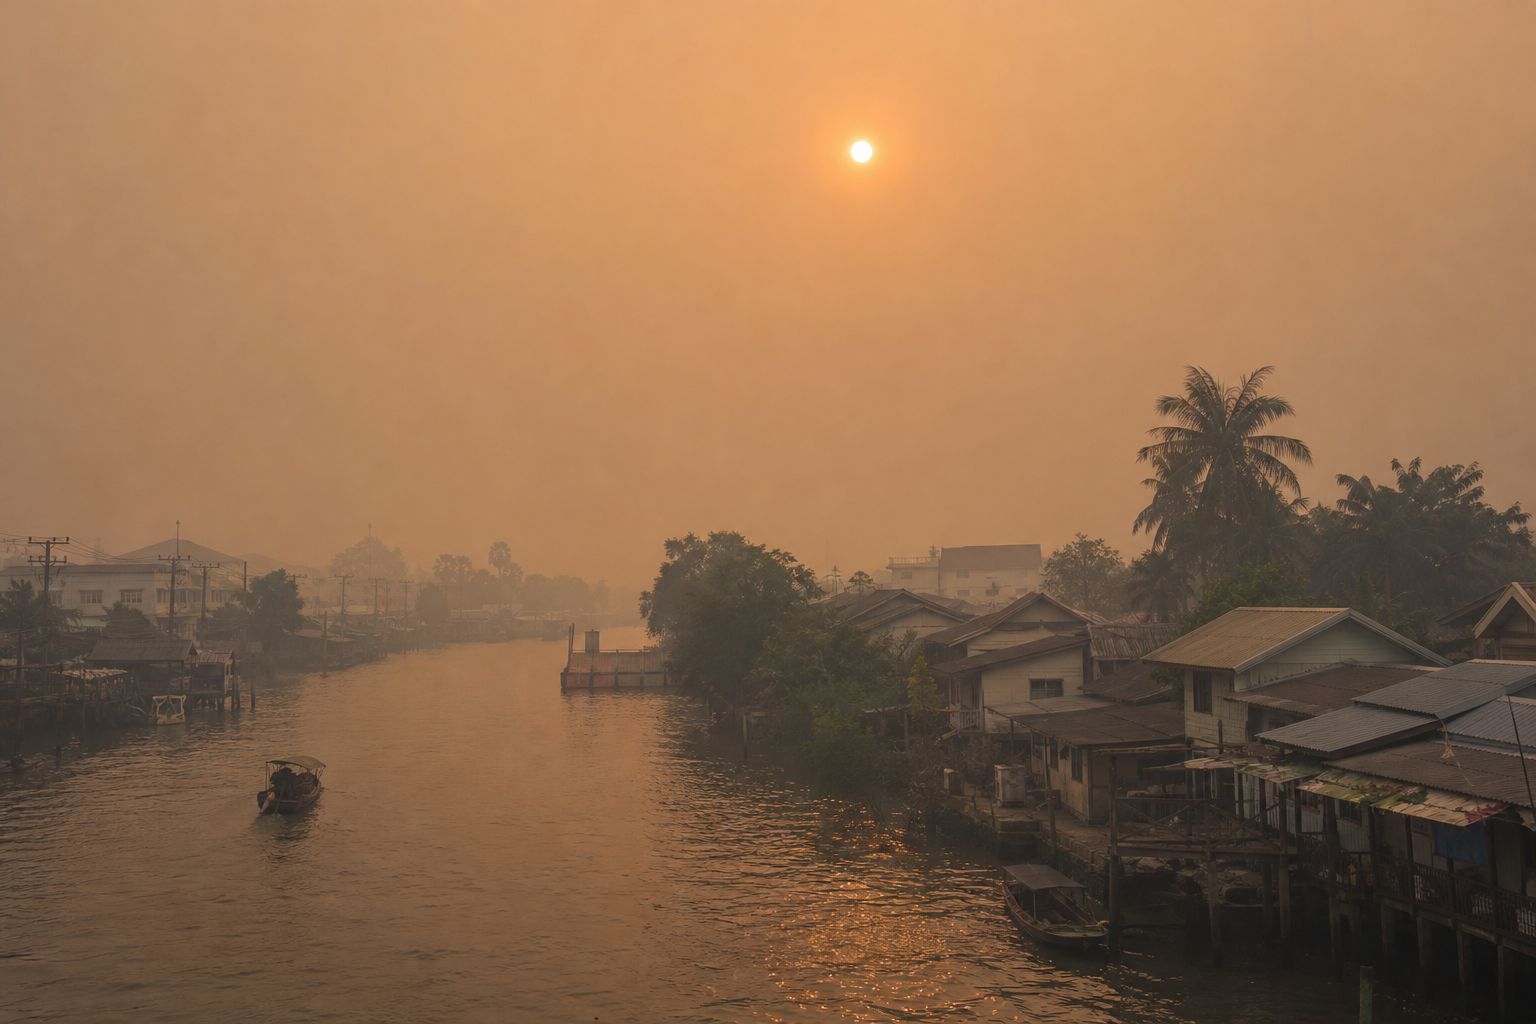
Indonesia, 15 October 2026A town in the haze Midday, with the sun reduced to a pale disc. AI-generated still.
Indonesia, Malaysia, Singapore, Brunei
The Philippines and southern Vietnam
Thailand
Reached by the 2026 haze
Prologue
The worst fires in a decade
Al Jazeera (16 October 2026): Indonesia is battling its worst forest fires in more than a decade, with Sumatra and Borneo worst affected. Satellites detected 799 high-confidence hotspots nationwide on the night of 15 October, 427 more than the day before; the Forestry Ministry notes that one fire can show up as several hotspots. Four people fighting a fire in Bromo Tengger Semeru National Park, East Java, died on 15 October. Toxic haze has covered parts of Indonesia, Malaysia and Singapore for weeks. Wikipedia’s summary of the 2026 haze lists Brunei, the Philippines, Vietnam and Thailand among the countries affected.
AFP (13 October 2026), citing Greenpeace research: peatlands produce most of Indonesia’s haze, though they account for less than a third of its wildfires.
Map: Natural Earth coastlines and borders.
The 3D map, soil block and particles are simplified teaching models, not to scale; hotspots and smoke on the map are schematic, not real data.
Much of the low, flat land of Sumatra and Borneo was once peat swamp forest. The ground is waterlogged most of the year, so fallen leaves and wood sink into water with almost no oxygen, and they barely rot.
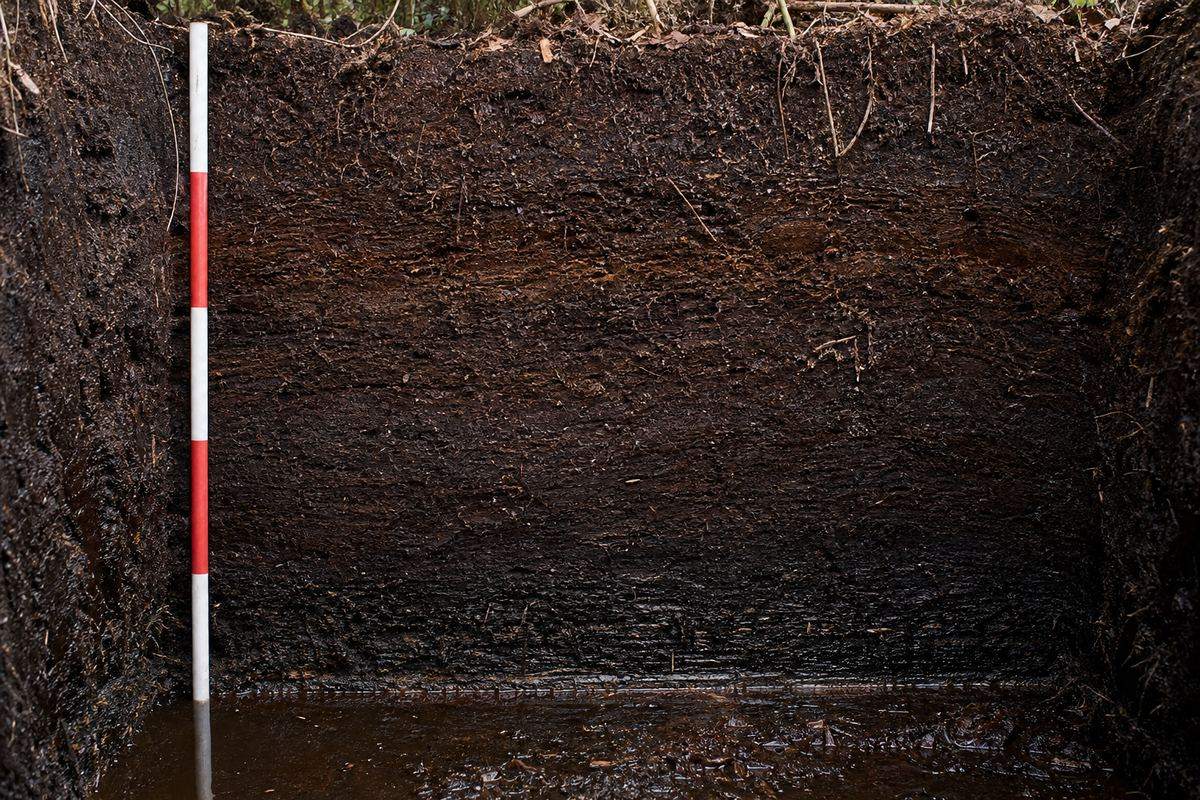
Instead they pile up, layer on layer, into peat: a dark, spongy soil made mostly of plant matter. It is very acidic, and in places it is up to twenty metres deep.
Some of it began to form eight thousand years ago. And in a healthy swamp, even in the dry season, the water lies only about twenty centimetres below the surface.
Waterlogged soil slows the decay of leaves and wood
The remains build up into a thick, acidic layer
Inland, the peat can rise into a dome up to 18 m high
Why the leaves do not rotInside the peat Leaves, roots and wood, compressed but still recognisable. AI-generated still.
~2.9–4
pH: as acidic as vinegar to tomato juice
≤ 20 m
deep
70–99%
organic matter
Tropical peat
~8,000 yr
coastal peat began
> 26,000 yr
some inland peat
~20 cm
below the surface: the dry-season water level
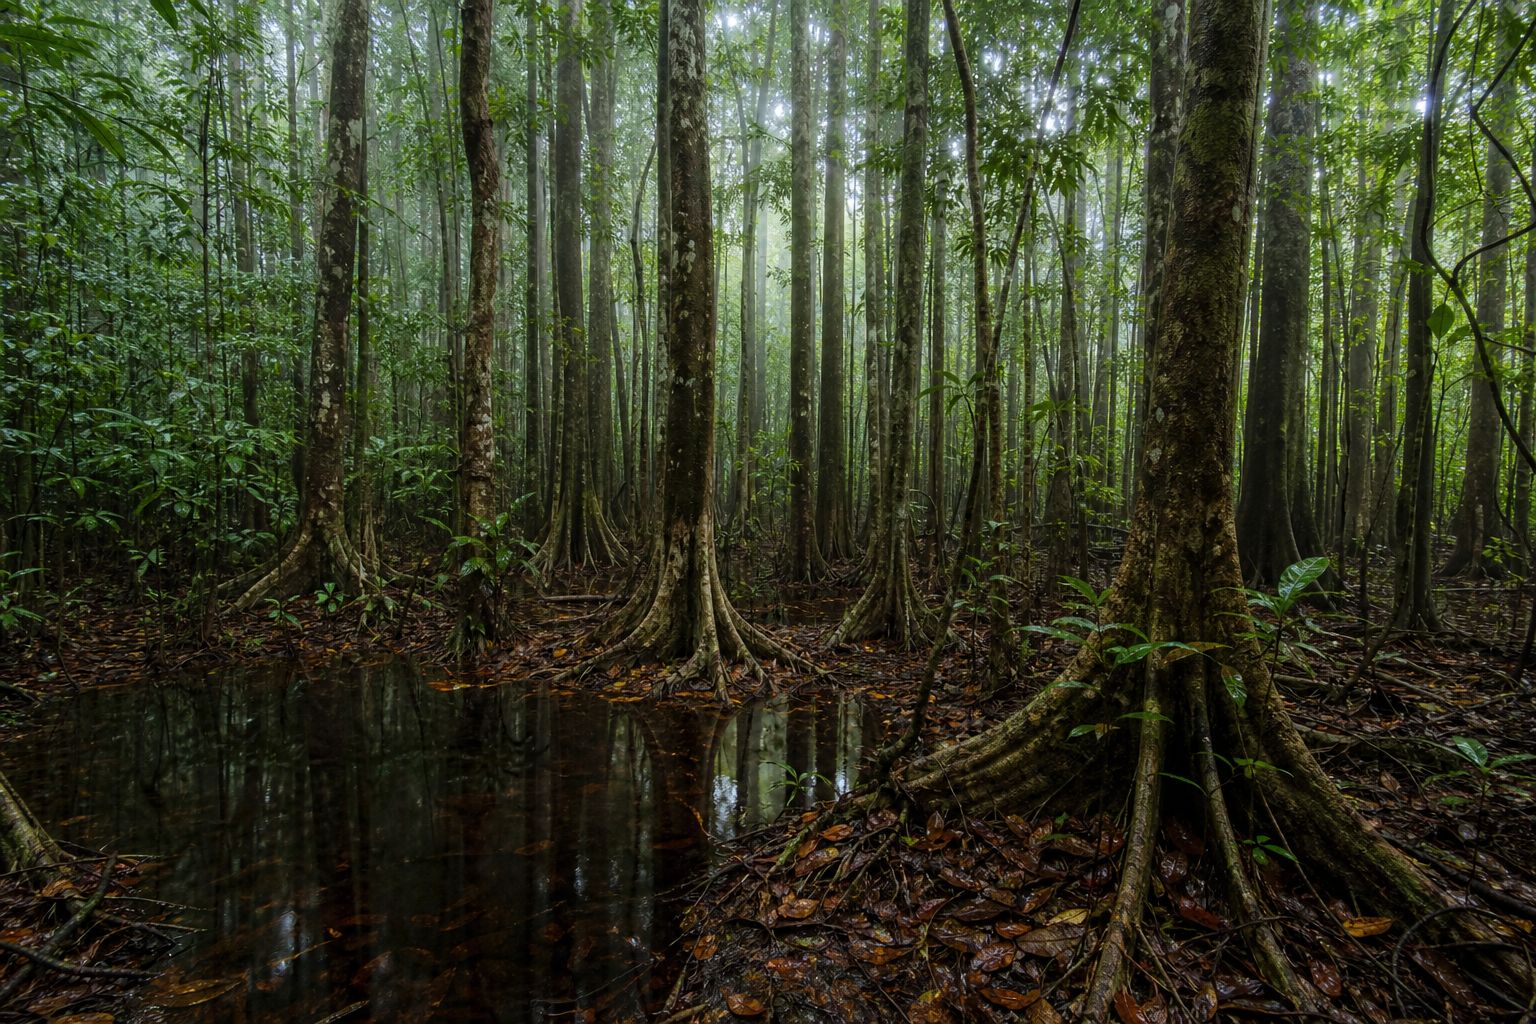
Age and waterPeat swamp forest Black, tea-coloured water: stained by the tannins of plants that do not decay. AI-generated still.
Chapter I · A forest standing on water
How peat forms
Wikipedia, Peat swamp forest: waterlogged soil slows the decomposition of dead leaves and wood, building a thick, acidic layer of peat, typically 70–99% organic material with a pH of about 2.9 to 4. Peat beds can be up to 20 m deep. Coastal peat in Southeast Asia formed mainly in the mid-Holocene, about 8,000 years ago; inland peat dates to the Late Pleistocene, more than 26,000 years ago. In the dry season the water level is usually about 20 cm below the surface, but in a severe El Niño it can fall to about 40 cm.
Vinegar has a pH of about 2.5 to 3 and tomato juice about 4; the comparison is a rough guide.
The 3D map, soil block and particles are simplified teaching models, not to scale; hotspots and smoke on the map are schematic, not real data.
Because the plants never rotted, their carbon never went back into the air. Peatlands cover only about three percent of the world's land, yet they hold roughly a third of its soil carbon, about twice as much as all its forests.
Indonesia alone has about a third of the world's tropical peatland, roughly twenty-four million hectares, mostly on Sumatra, Kalimantan and Papua.
As long as the peat stays wet, that carbon stays locked away. Dry it out, and the whole store becomes fuel.
Land covered by peat
~3%
Soil carbon held in peat
~33%
Share of the world (AFP)
50–88 Gt
estimated carbon (estimates vary)
Carbon in tropical peat
~24.2 M ha
estimated area (AFP)
8.3 M ha
on Sumatra
6.3 M ha
on Kalimantan
Indonesia’s peat
Wet: no oxygen, so no rot and no fire
Dry: oxygen gets in, the peat rots and can burn
Either way, the stored carbon returns to the air
Wet peat, dry peat
Chapter I · A forest standing on water
A third of the soil’s carbon
AFP (via The Star, 13 October 2026): peatlands cover about 3% of the world’s land but store about a third of its soil carbon, double the amount trapped by forests. Indonesia has an estimated 24.2 million hectares of peatland, about a third of the world’s tropical peatland. Wikipedia’s Peat swamp forest article gives Indonesia’s peat as concentrated on Sumatra (8.3 million ha), Kalimantan (6.3 million ha) and Papua (4.6 million ha); estimates differ between sources. Waterlogging keeps the carbon stored; drainage, fire or heat can release it.
The 3D map, soil block and particles are simplified teaching models, not to scale; hotspots and smoke on the map are schematic, not real data.
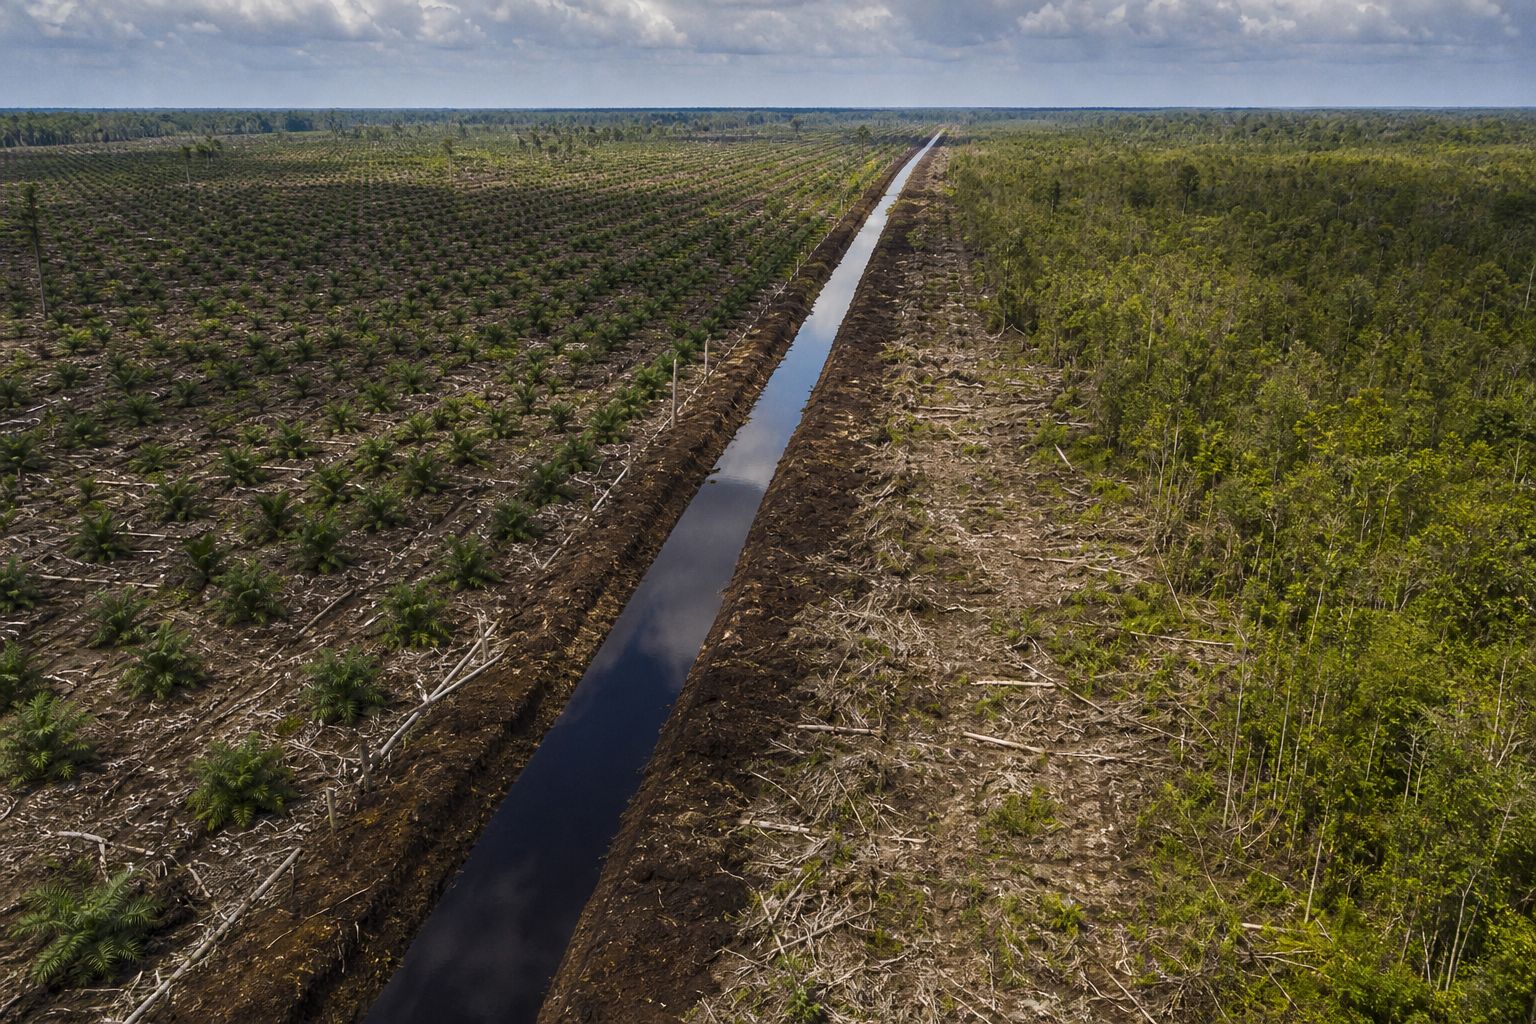
Crops such as oil palm and pulpwood trees do not grow in a swamp. To plant them, the peat has to be drained. Workers dig canals, and the water runs out.
One of the biggest drainage schemes began in 1996. Indonesia's Mega Rice Project dug more than four thousand kilometres of channels across over a million hectares of peat forest in Borneo, and left the peat dry all year round.
Today the monitoring group Pantau Gambut estimates there are about two hundred and eighty-five thousand kilometres of drainage canals in Indonesia's peat, about seven times around the Earth. Dig a canal in the model and watch the water table fall.
A drained peatland A straight canal; young plantation on one side, remnant forest on the other. AI-generated still.
> 1 M ha
of peat forest drained
> 4,000 km
of channels
Mega Rice Project, from 1996
1991
64.8%
2000
45.7%
Forest cover in the project area
~285,000 km
of drainage canals
~7×
around the Earth
16.4 M ha
degraded and fire-prone
Canals in Indonesia’s peat (Pantau Gambut, via AFP)
Water drains out of the peat into the canal
The top of the peat dries out
Dry peat can burn
What a canal does
Chapter II · Draining the swamp
Canals in the peat
Wikipedia, Peat swamp forest: starting in 1996, Indonesia’s Mega Rice Project drained over 1 million hectares of Borneo peat forest, with more than 4,000 km of channels dug. Forest cover in the project area fell from 64.8% (1991) to 45.7% (2000), and the drainage left the peat dry year-round, more vulnerable to fire. AFP (13 October 2026), citing research by the monitoring group Pantau Gambut: drainage canals in Indonesia’s peatlands span about 285,000 km, roughly seven times the Earth’s circumference, and 16.4 million hectares of peat are degraded and vulnerable to fire. Wikipedia’s haze article names industrial clearing for palm oil and pulpwood as a major cause of the fires.
Try it: the water level in the model is schematic; real drained peat dries from the top down, and the land itself slowly sinks. Blocking canals comes in Chapter VI.
The 3D map, soil block and particles are simplified teaching models, not to scale; hotspots and smoke on the map are schematic, not real data.
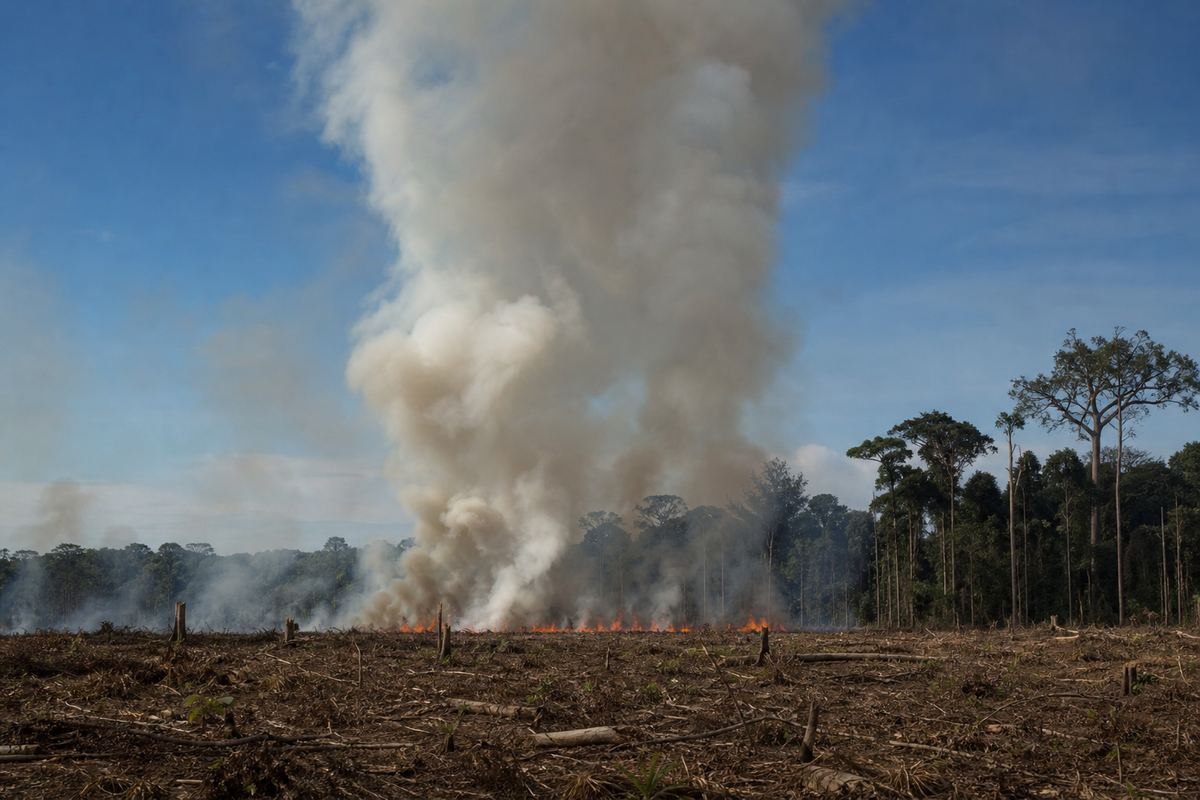
Drained peat is dry at the top, and the dry season makes it drier still. In this region, haze is usually worst from July to October. That is also when land is cleared, and fire is the cheapest way to clear it.
One estimate puts burning at about five US dollars a hectare, against up to two hundred for machines and chemicals. Who lights which fires, companies or small farmers, is disputed, and in 2026 Indonesian police were investigating ninety-five companies.
And a fire lit on the surface does not stay there. On drained peat, it can creep down into the ground itself.
Clearing by fire A low line of flame and a tall column of smoke in the dry season. AI-generated still.
Jul–Oct
when the haze is usually worst
The burning season
Fire
~$5
Machines and chemicals
≤ $200
Cost of clearing one hectare (estimates)
219
criminal investigations
162
suspects named
95
companies investigated
Indonesian police, by 17 September 2026
Fire burns the dry top layer
It creeps down into the dry peat
There it can smoulder out of sight
From the surface down
Chapter II · Draining the swamp
Why fire
Wikipedia, Southeast Asian haze: slash-and-burn land clearing is the main driver, and the haze is usually worst from July to October and in El Niño years. Burning is cheaper and faster than mechanical clearing; figures cited there (from Varkkey, 2013) put fire at about US$5 per hectare, against up to US$200 per hectare for machines and chemicals. Wikipedia’s summary of the 2026 haze: as of 17 September, Indonesian police had opened 219 criminal investigations, named 162 suspects and were investigating 95 companies. President Prabowo Subianto called slash-and-burn clearing “ecological terrorism” and promised zero tolerance.
The cost figures are rough estimates quoted in the literature, not a survey of today’s prices. Who lights which fires is disputed between companies, smallholders and the authorities.
The 3D map, soil block and particles are simplified teaching models, not to scale; hotspots and smoke on the map are schematic, not real data.
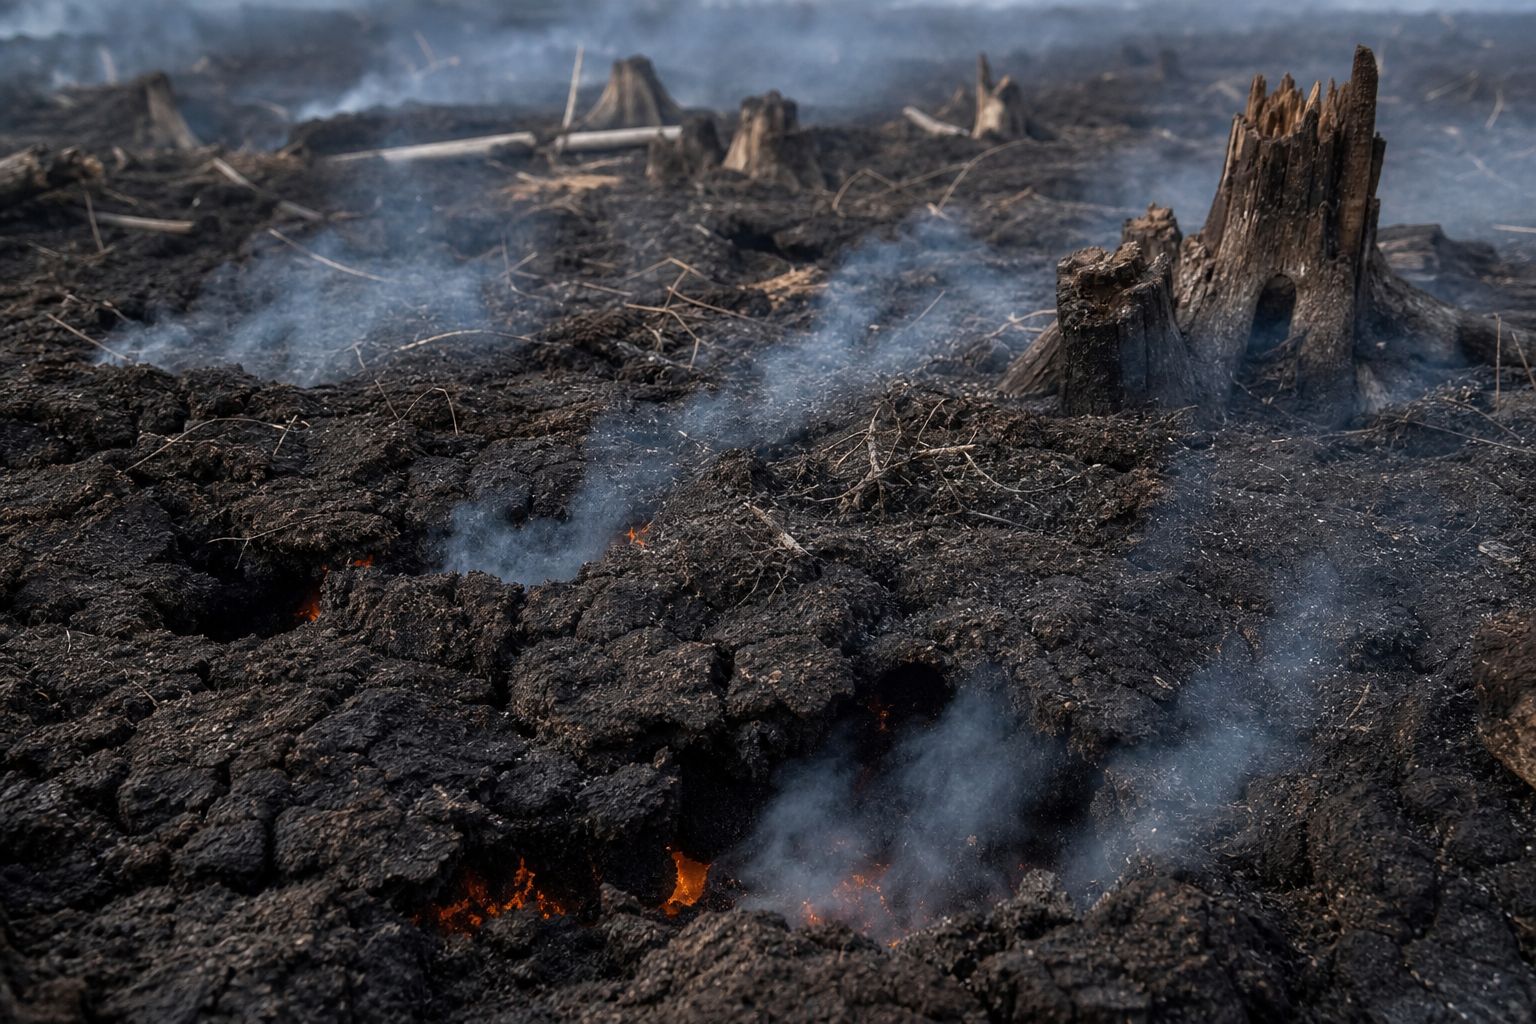
A flame is burning gas. Peat mostly burns another way. It smoulders: it glows and burns slowly, cooler than a flame and without one, the way charcoal glows in a stove.
In a field experiment, researchers from Imperial College London measured four hundred to six hundred degrees Celsius inside smouldering peat. Such a fire creeps at about a millimetre a minute, roughly a hundred times slower than a flame. But it does not stop.
It burns down and sideways beneath the surface, through rain, for weeks or months. Over that time it eats through far more fuel than a passing flame, which is why a few fires on peat can make most of the smoke. Switch between the two kinds of fire.
Flaming: hot, fast, above ground, minutes in one place
Smouldering: cooler, slow, underground, weeks to months
Smouldering survives rain and weather changes
Flaming vs smouldering
400–600 °C
measured in the soil
~1 mm/min
spread
~100×
slower than flame spread
Smouldering peat (Rein; Imperial College field test)
months
or even years, despite rain or firefighting
How long (Rein, IAWF)
~100×
more fuel burned by smouldering fires than by the flaming fires in the news
Fuel burned (Rein’s team, via Horizon)A smouldering peat fire Smoke seeps out of the soil itself; the glow is underground. AI-generated still.
Chapter III · The fire underground
Smouldering
International Association of Wildland Fire (Guillermo Rein): smouldering is cooler and less intense than flaming and creeps at about 1 mm per minute, roughly 100 times slower than flame spread; peat fires can smoulder for months or years despite rain, weather changes or firefighting. Horizon magazine, on an Imperial College field experiment: thermocouples measured 400–600 °C in the soil, and the 2018 test fire burned for three weeks, digging downward and spreading sideways; Rein’s team says smouldering fires burn about 100 times more fuel than the flaming fires usually in the news. Hu et al. (2018) describe smouldering peat fires as the largest fires on Earth by fuel consumption, and link them to regional haze.
Try it: the model shows the two regimes side by side; speeds and glow are exaggerated so they can be seen.
The 3D map, soil block and particles are simplified teaching models, not to scale; hotspots and smoke on the map are schematic, not real data.
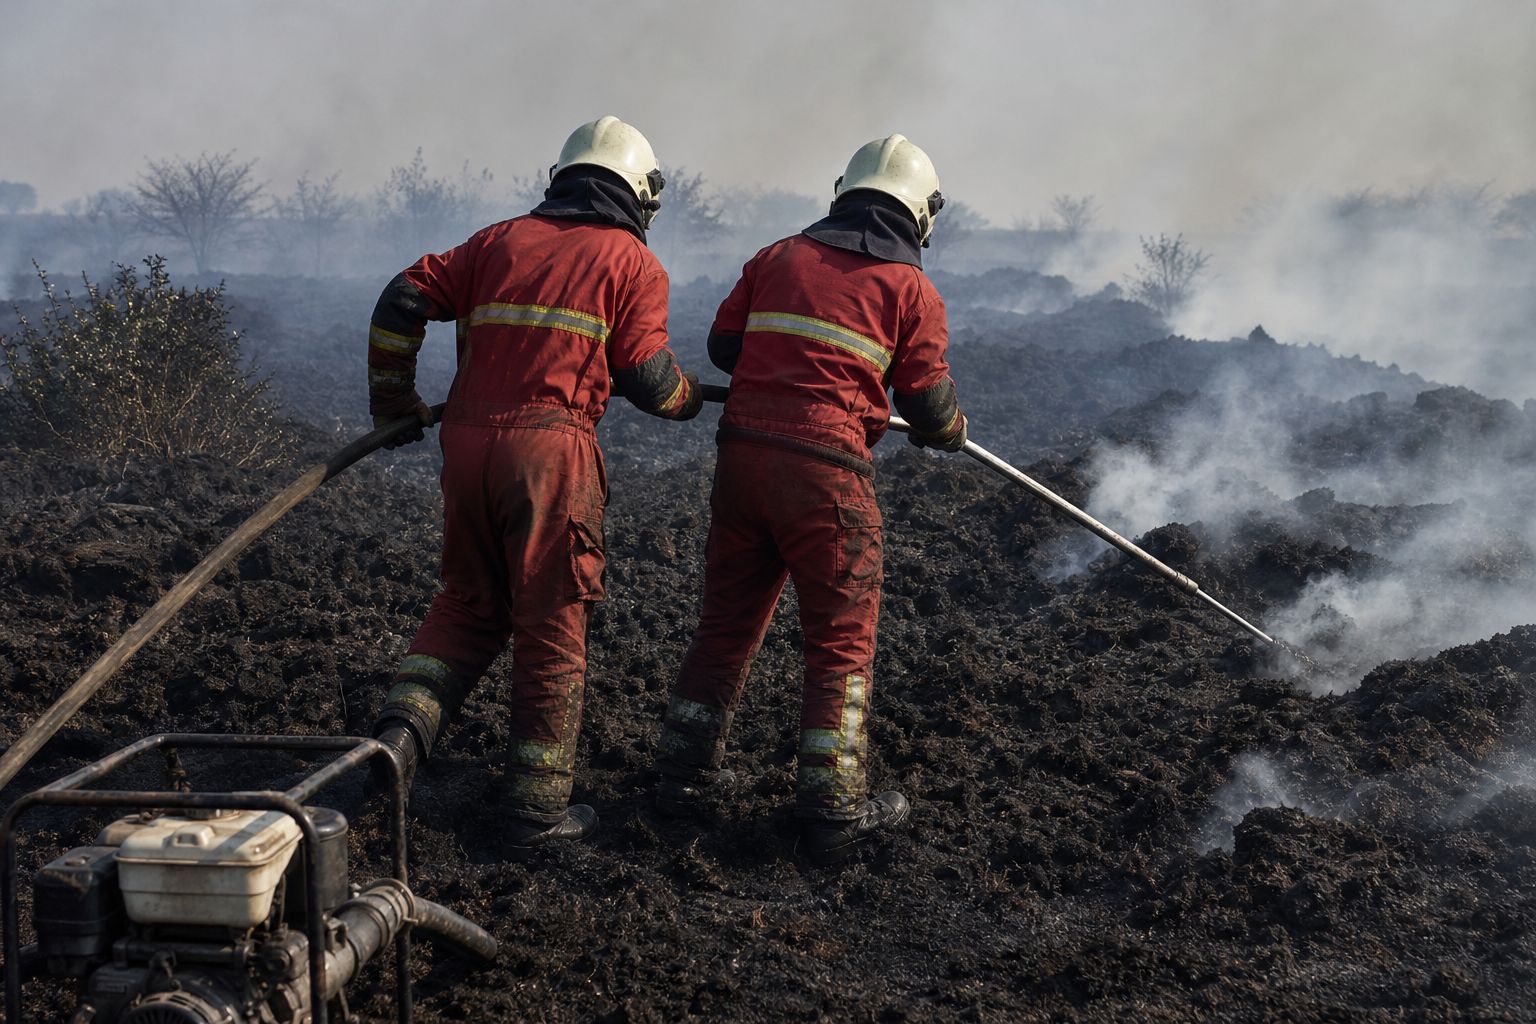
This is why peat fires are so hard to fight. Water dropped from the air soaks the surface, while the fire carries on below it. The same researchers found that air tankers do essentially nothing against a peat fire.
Firefighters instead push metal lances into the ground and pump water in at depth. In the field experiment, putting out one test fire this way took three days.
Across a whole province, that cannot be done everywhere. The only lasting defence is to stop the peat from drying out in the first place. Try water from the air, then the lance.
The fire is under the surface
Water wets the top layer only
The glow carries on below
Why water from above failsWater at depth A lance on a hose is pushed into the burning peat. AI-generated still.
3 weeks
burning
3 days
to put out with lances
One test fire (Imperial College)
Wet peat is hard to ignite
Dry peat catches easily
Earlier detection is still being developed
Prevention
Chapter III · The fire underground
Why water from the sky fails
Horizon magazine, on the Imperial College field experiment led by Guillermo Rein: firefighters use lances, pipes punched into the soil that deliver water at depth; putting out the experimental fire this way took three days. Air tankers do essentially nothing against peat fires. Peat becomes highly flammable once it dries, so keeping it wet helps prevent ignition, and the team is working on earlier detection using infrared and gas signatures.
Try it: in the model, water from above wets the top layer only; the lance reaches the glowing layer. Exaggerated for clarity.
The 3D map, soil block and particles are simplified teaching models, not to scale; hotspots and smoke on the map are schematic, not real data.
An ocean away, the Pacific decides how dry the peat gets.
How bad a year gets depends partly on the Pacific Ocean. Normally, the trade winds push warm surface water west, so it piles up near Indonesia. Moist air rises over that warm water and falls as rain. This loop of air across the Pacific is called the Walker circulation.
In an El Niño year, the warm water spreads east and the loop weakens. With cooler seas around Indonesia, less moist air rises there, the rain moves toward the central Pacific, and the dry season gets drier.
When the sea off Sumatra and Java also turns cool, called a positive Indian Ocean Dipole, Indonesia dries further. Both struck in 1997, the worst haze on record, and both were forecast again for 2026. Turn El Niño on and off.
Warm water piles up in the west Pacific
Air rises over Indonesia: clouds and rain
Air sinks over the east Pacific: dry
A normal year
~1½ ft
higher sea level near Indonesia than near Peru
Trade winds pile up the water (NOAA)
Warm water spreads east
Seas around Indonesia cool; the loop weakens
Rain shifts to the central Pacific
An El Niño year
1997 El Niño + positive Indian Ocean Dipole: worst haze on record
2015 Haze after the 2014–16 El Niño
2026 Strong El Niño and positive Indian Ocean Dipole forecast
Dry years and haze
Less rain in the dry season
Peat water table can drop to ~40 cm
More fuel dries out
Why it matters for fire
Chapter IV · Weather that feeds fire
El Niño dries Indonesia
NOAA: in normal conditions the trade winds blow from east to west along the equator and push warm water west, where it piles higher near Indonesia; in El Niño the western Pacific becomes relatively dry and rainfall increases in the central Pacific. NOAA Physical Sciences Laboratory (Hendon, 2003): Indonesian dry-season rainfall is strongly tied to El Niño. Drought typically occurs during El Niño, when sea surface temperatures around Indonesia are cool and the Walker circulation is weakened; a local feedback of stronger easterly winds cools the ocean further. Wikipedia, Southeast Asian haze: the 1997–98 El Niño and a positive Indian Ocean Dipole coincided with the 1997 haze, the most severe on record; the 2015 haze followed the 2014–16 El Niño. A positive Indian Ocean Dipole brings cooler sea-surface water along the coasts of Java and Sumatra (AGU abstract). In 2026, a forecast strong El Niño and a positive IOD were expected to make severe fires more likely in September and October.
Try it: the ocean slab and the loop of air are a schematic cross-section of the equatorial Pacific, not to scale.
The 3D map, soil block and particles are simplified teaching models, not to scale; hotspots and smoke on the map are schematic, not real data.
The smoke goes where the wind goes. In the fire season, the southwest monsoon blows across Sumatra and Borneo toward the north-east.
It carries smoke from Sumatra across the Strait of Malacca to Singapore and the Malay Peninsula, and smoke from Kalimantan toward Sarawak and Brunei. Climate researchers in Singapore say haze is most likely from July to October, and of greatest concern in August and September.
In the other monsoon, the wind blows from the north-east instead. Switch the wind, and see where the same smoke would go.
Blows from the south-west
Carries Sumatra’s smoke toward Singapore and Malaysia
Carries Kalimantan’s smoke toward Sarawak and Brunei
Southwest monsoon
5 / 5
regions “unhealthy” at once, first time since 2019
> 500
air-quality index in Sarawak, 4 September: emergency declared
Singapore, 15 September 2026
Quezon City (Metro Manila) and Cebu City: classes suspended
Southern Vietnam, 14 September
Sarawak: 591 schools closed, 20 August
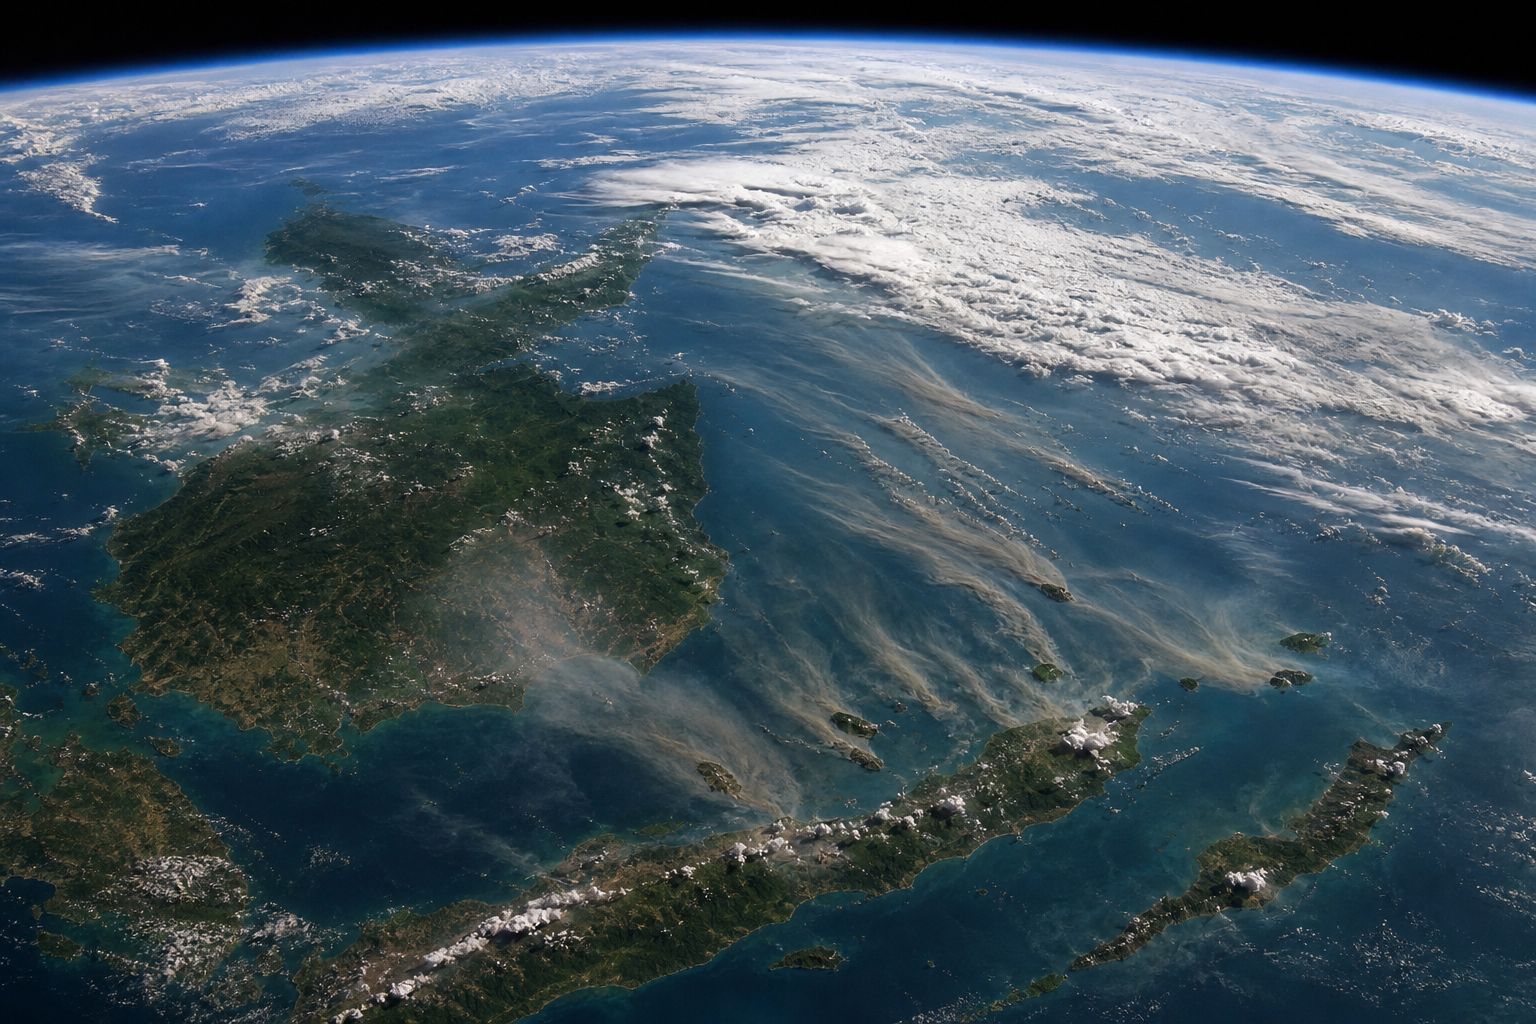
Reached in 2026Smoke from orbit Plumes drifting over islands and sea, as a satellite might see them; not a real image of the region. AI-generated still.
Chapter IV · Weather that feeds fire
The southwest monsoon
NTU Centre for Climate Change and Environmental Health (16 July 2026): prevailing southwest monsoon winds can carry smoke toward Singapore; haze episodes are more likely from July to October, with the greatest concern in August and September. Wikipedia’s summary of the 2026 haze: on 15 September all five of Singapore’s regions were in the unhealthy range at once, for the first time since September 2019; Sarawak declared an emergency on 4 September after air-quality readings exceeded 500; in May, Singapore’s NEA and Meteorological Service had warned of a higher chance of haze from June to October; all 591 schools in 10 Sarawak districts closed on 20 August; classes were suspended in parts of the Philippines, and haze reached southern Vietnam on 14 September.
Try it: wind arrows show the general direction of each monsoon, not a forecast; the smoke on the map is schematic.
Map: Natural Earth coastlines and borders.
The 3D map, soil block and particles are simplified teaching models, not to scale; hotspots and smoke on the map are schematic, not real data.
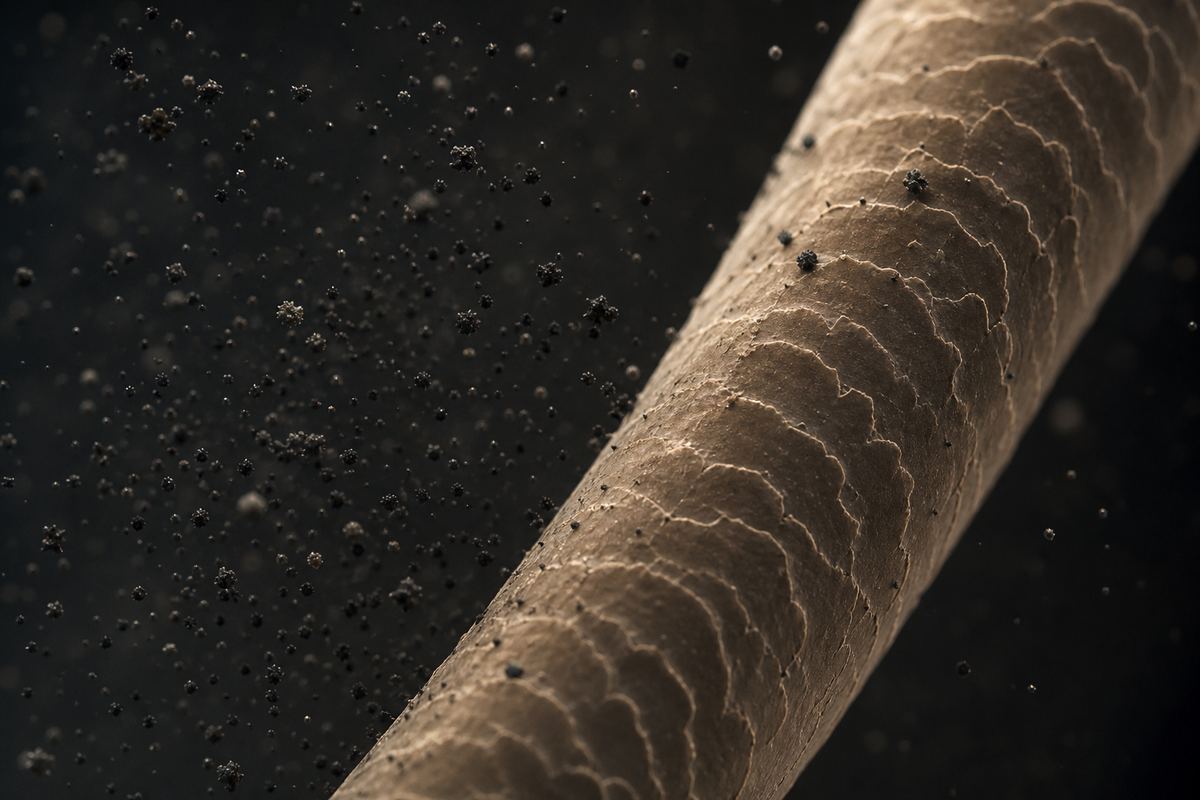
What makes haze harmful is the size of its particles. A micrometre is a thousandth of a millimetre. PM10 means particles ten micrometres across or smaller, and PM2.5, two and a half or smaller. A human hair is about seventy micrometres wide, so about thirty of the largest PM2.5 particles would fit across it.
Particles this small slip past the nose and throat and deep into the lungs, and some can even reach the bloodstream. The United States Environmental Protection Agency says they pose the greatest risk to health.
The World Health Organization's guideline is no more than fifteen micrograms of PM2.5 in each cubic metre of air, averaged over a day. The air-quality indexes on the news are a different scale: on Singapore's, above one hundred is unhealthy. Compare the sizes.
A hair and the smoke An illustration: smoke particles beside a single hair. AI-generated still.
Human hair
~70
PM10
≤ 10
PM2.5
≤ 2.5
Sizes (US EPA) 1 micrometre (µm) = 1/1000 of a millimetre.
Past the nose and throat
Deep into the lungs
Some into the bloodstream
Where fine particles go (US EPA)
15 µg/m³
PM2.5, 24-hour mean
5 µg/m³
PM2.5, annual mean
> 100 / > 300
Singapore’s index (PSI): unhealthy / hazardous
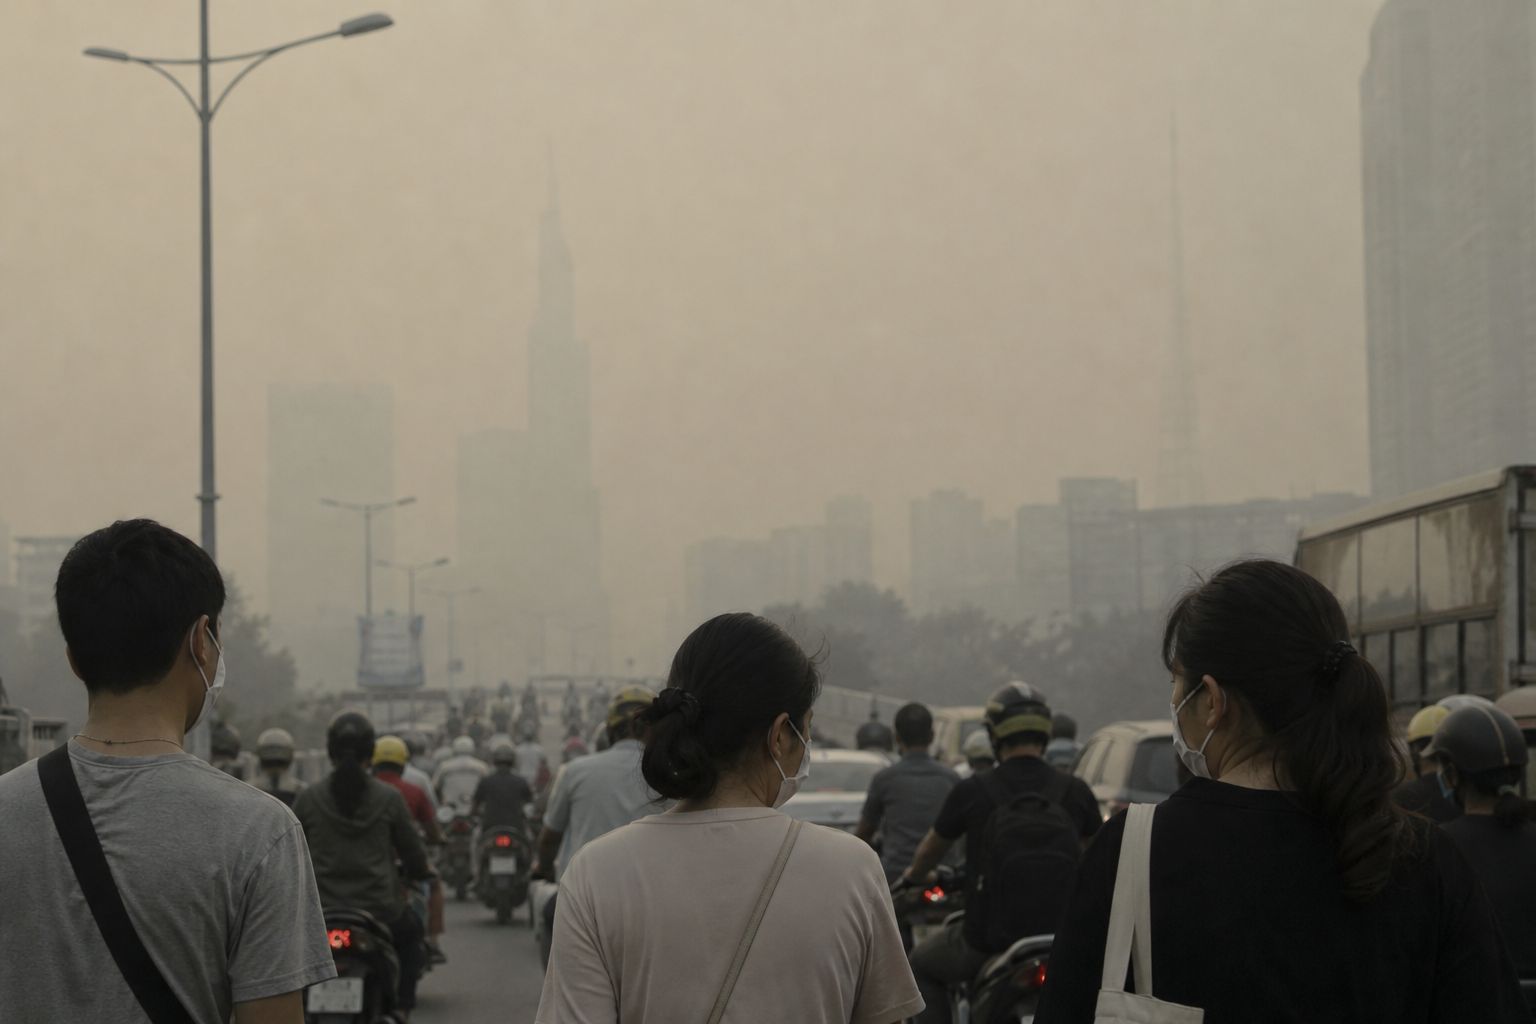
WHO guideline, 2021A city in haze Masks help only if they fit well; N95-type masks filter fine particles. AI-generated still.
Chapter V · Smoke in the lungs
Fine particles
US EPA, Particulate matter basics: PM2.5 are fine inhalable particles with diameters that are generally 2.5 micrometres and smaller; the average human hair is about 70 micrometres in diameter. Particles under 10 micrometres can get deep into the lungs and some may even get into the bloodstream; fine particles pose the greatest risk to health. The WHO’s 2021 air quality guidelines set PM2.5 at 15 µg/m³ as a 24-hour mean and 5 µg/m³ as an annual mean. Wikipedia, Southeast Asian haze: on the Pollutant Standards Index, a reading above 100 is unhealthy and above 300 is hazardous; children, the elderly and people with asthma, lung or heart disease are most affected.
This is general education, not medical advice. In heavy haze, follow local health advice and talk to a doctor about any symptoms.
Try it: the hair and particles are drawn to scale with each other.
The 3D map, soil block and particles are simplified teaching models, not to scale; hotspots and smoke on the map are schematic, not real data.
The haze of 1997 is estimated to have cost the region about nine billion US dollars. The cost to Indonesia of the 2015 fires was estimated at about sixteen billion.
A study led by Harvard and Columbia universities used a computer model to estimate that the smoke of 2015 may have caused more than a hundred thousand early deaths in Indonesia, Malaysia and Singapore. That is a model estimate, not a count.
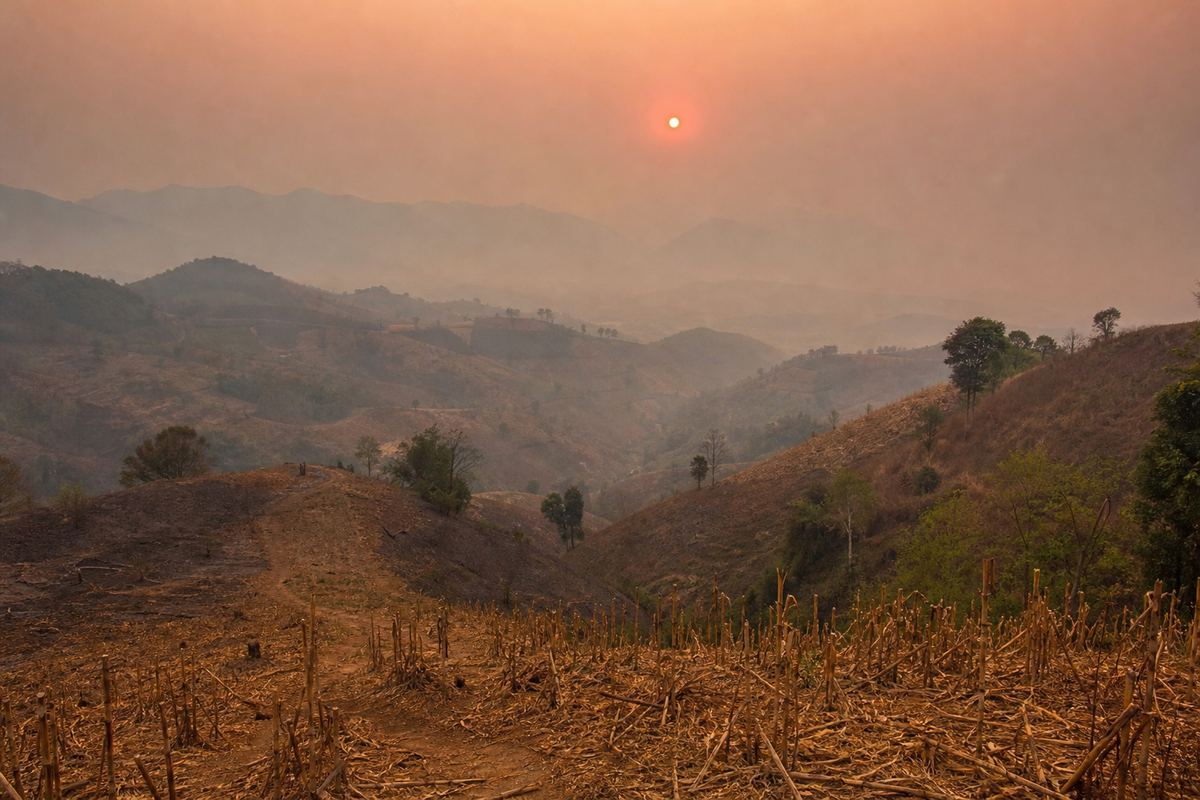
Northern Thailand has a smoke season of its own, from February to April. There the main source is not peat but burning crop fields, at home and across the border.
1997 haze, ASEAN
~9
2015 fires, Indonesia
~16
Estimated cost (US$ billion)
~100,000
possible early deaths in three countries
~38,000
the same estimate for 2006
2015 smoke, modelled (Koplitz et al., 2016)
~40,000
hospitalisations
1997 haze (Wikipedia)Northern Thailand, dry season Burnt maize stubble on the slopes and a red sun in the haze. AI-generated still.
~1/2
of the haze from burning crop waste (a CMU estimate)
1/3–1/2
from across the border
Chiang Mai, 2023 (Al Jazeera)
Chapter V · Smoke in the lungs
What haze costs
Wikipedia, Southeast Asian haze: the 1997 haze, considered the most severe on record, caused an estimated US$9 billion in damages across ASEAN and about 40,000 hospitalisations; the estimated cost to Indonesia of the 2015 fires was US$16 billion. Harvard SEAS (2016): a model study led by Shannon Koplitz (Harvard, with Columbia), published in Environmental Research Letters, estimated that the 2015 smoke caused upwards of 100,000 deaths across Indonesia, Malaysia and Singapore, up from about 38,000 in the 2006 event. Al Jazeera (April 2023): northern Thailand’s haze season runs from February to April; a Chiang Mai University professor estimates about half the smog comes from burning agricultural biomass, and cross-border smoke from Myanmar and Laos accounts for between a third and half, depending on the region.
Death estimates from smoke are modelled from known links between pollution and mortality; they carry wide uncertainty.
In 2002, the ASEAN countries signed an agreement on transboundary haze pollution. It came into force the next year. Indonesia was the last member to approve it, in 2014, the same year Singapore passed a law that can punish companies abroad for causing haze.
But the lasting fix is water. Blocking canals raises the water table, so the peat stays wet. Indonesia's government says it has rewetted more than four million hectares and built forty-five thousand canal barriers.
Greenpeace says some restored areas have burned again. By early October 2026, Indonesia's fires had released about a hundred and forty million tonnes of carbon, its most since 2019, according to Europe's Copernicus monitoring service. Block the canal in the model.
10 Jun 2002 ASEAN haze agreement signed, Kuala Lumpur
25 Nov 2003 Agreement enters into force
2014 Indonesia approves it; Singapore’s Transboundary Haze Pollution Act
Haze rules
2014
Indonesia approves the agreement, 12 years after signing
The last to sign on
4.16 M ha
of peat rewetted
45,000
canal barriers built
Indonesia’s government says (via AFP)
140.5 Mt
of carbon emitted
~13%
of the world’s fire emissions this year
Indonesia’s fires in 2026, to 6 October (CAMS)
Some restored peat areas have experienced fires and have some of the highest hotspot counts.Belgis Habiba, Greenpeace (to AFP, October 2026)
Chapter VI · Keeping peat wet
Rules and water
NUS Centre for International Law: the ASEAN Agreement on Transboundary Haze Pollution was signed in Kuala Lumpur on 10 June 2002 and entered into force on 25 November 2003. Wikipedia, Southeast Asian haze: Indonesia was the last ASEAN country to ratify it, in 2014 (the NUS treaty database lists the deposit of its instrument as 20 January 2015); Singapore’s Transboundary Haze Pollution Act 2014 criminalises overseas activities that contribute to haze. AFP (13 October 2026): Indonesia’s government said last year it had rewetted 4.16 million hectares of peat, built 45,000 canal barriers and replanted native species; Greenpeace says some restored areas have since burned. By 6 October, Indonesia’s fires had emitted 140.5 megatonnes of carbon, about 13% of the 2026 global total and its highest since 2019, according to the Copernicus Atmosphere Monitoring Service. A new national peatland and mangrove agency was announced in September 2026.
Try it: the canal block in the model raises the water table; real rewetting takes many blocks and seasons.
The 3D map, soil block and particles are simplified teaching models, not to scale; hotspots and smoke on the map are schematic, not real data.
Haze begins with a simple fact: peat is fuel that stays safe only while it is wet.
Drain it, add a dry El Niño year and a match, and a fire can hide underground for weeks, while the monsoon carries its smoke across borders and into millions of lungs.
Can millions of hectares be kept wet while people still make a living from the land? Who should pay for smoke that crosses a border? Those questions are still being argued.
~8,000 yr ago Coastal peat begins to form
1996 Mega Rice Project drains Borneo peat
1997 Worst haze on record
2002 ASEAN haze agreement
2015 El Niño haze
2026 Worst fires in more than a decade
Peat, fire and haze
Drained peat
Dry year (El Niño, positive IOD)
Fire, often lit to clear land
Smouldering underground
Monsoon wind carries the smoke
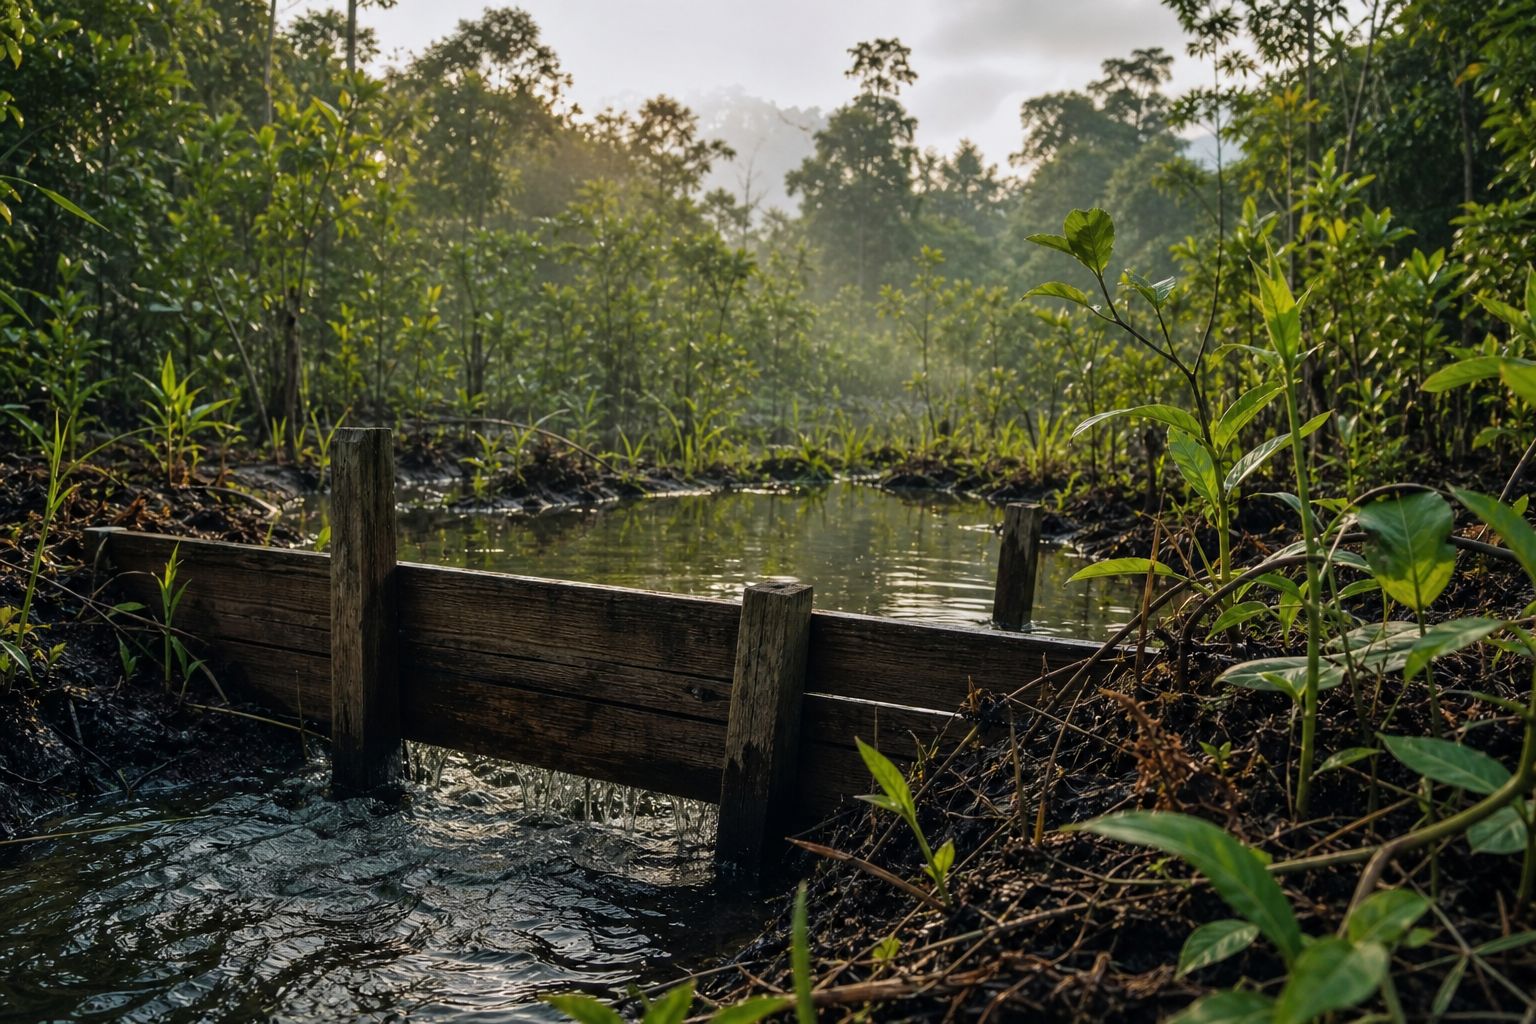
The chainWater as the firebreak A blocked canal keeps the peat behind it wet. AI-generated still.
Stills are AI-generated
Map: Natural Earth; hotspots and smoke are schematic
Soil block, ocean and particles are teaching models
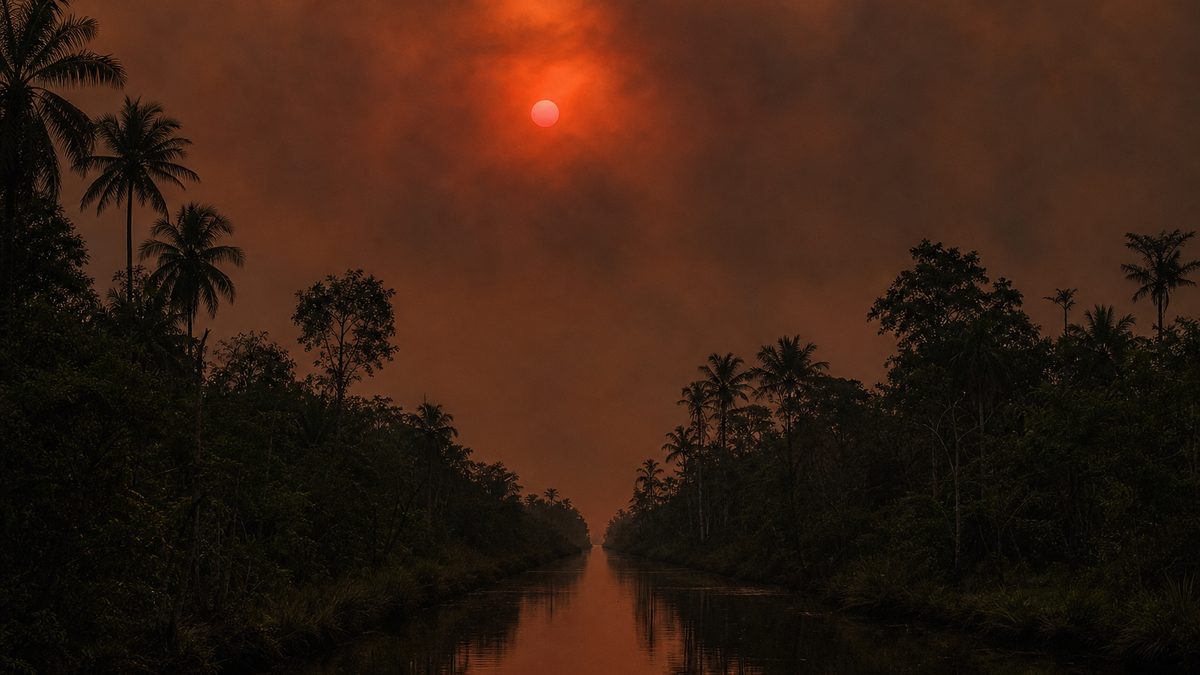
About this filmDawn over the swamp A peat swamp forest canopy under a smoky sky. AI-generated still.
Epilogue · Sources
Sources
Every fact in this film comes from the sources below. Figures for deaths and costs are estimates and are attributed to whoever made them. The chapter stills and pictures are AI-generated illustrations; the map uses Natural Earth coastlines and borders, and its hotspots and smoke are schematic; the soil block, the ocean cross-section and the particles are simplified teaching models.