In 2026 sea temperatures in the eastern equatorial Pacific rose more than 3 °C above average, a record by daily measurements; California declared a state of emergency and Thailand's water agency warned of dry spells lasting into 2027. This film explains the fundamentals: the normal Pacific, with trade winds piling warm water in the west and cold water welling up off Peru; how El Niño begins when those winds weaken and warm water sloshes east; the feedback Jacob Bjerknes described in 1969 and the pressure seesaw Gilbert Walker named in 1923; La Niña, the opposite phase; how NOAA measures an event in the Niño 3.4 region and why it switched to a new index in 2026; the great El Niños of 1982, 1997 and 2015; how one patch of warm ocean shifts rain and drought from Indonesia and Thailand to the Americas and Africa; and why El Niño years tend to set global heat records.
Interactive 3D film9 min1800s to 2027Published 27 October 2026
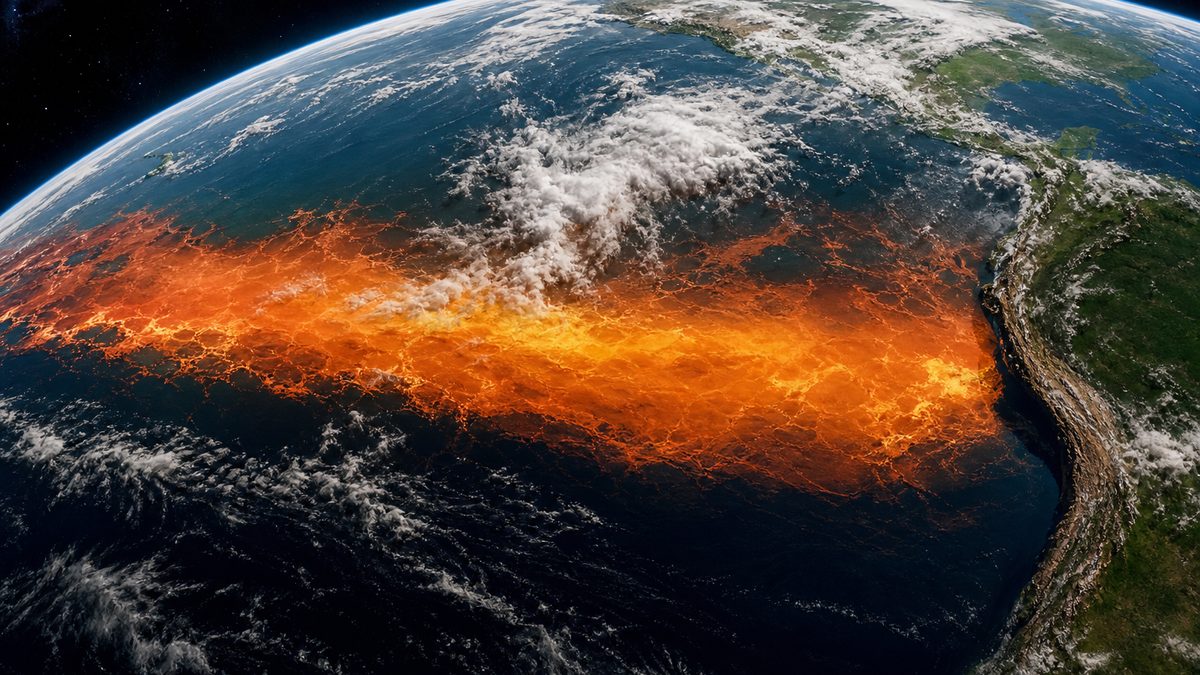
In September 2026, the surface of the central and eastern equatorial Pacific was more than three degrees Celsius warmer than average. By daily sea-surface temperature, at least, it was the strongest El Niño on record.
California declared a state of emergency to prepare for winter storms. In Thailand, the national water office warned that dry spells could last into 2027.
How can one patch of warm ocean reach across the world, moving rain from one side of an ocean to the other? It starts with the wind.
+3.08 °C
daily sea-surface temperature above the 1991–2020 average
+3.02 °C
the previous record, November 2015
The El Niño region, 21 Sept 2026
California: state of emergency (September)
Thailand: rainfall about 10% below average
WMO: record ocean warmth likely in Oct–Dec
Getting ready
The normal Pacific
How an El Niño starts and feeds itself
How it is measured
Drought, floods and heat around the world
In this film
Prologue
A record-breaking event
Science News Explores (5 Oct 2026): by 21 September, daily sea-surface temperature in the El Niño formation region was 3.08 °C above the 1991–2020 average, beating the 3.02 °C of November 2015; NOAA had not yet formally called it a record under its new index, on which 1997–98 still held the top spot. Union of Concerned Scientists: by the traditional Oceanic Niño Index this is a record El Niño; California’s governor declared a state of emergency (release dated 21 September 2026) to prepare. Business Today (24 Oct 2026): the WMO expects record temperatures in the central and eastern tropical Pacific in October–December.
Nation Thailand (29 Jul 2026): Thailand’s Office of the National Water Resources warned the El Niño could be more severe than in 2015, with dry spells possibly lasting into 2027; cumulative rainfall was about 10% below average. Whether an event is a “record” depends on the index used; this film says which one each time.
The ocean slab, winds, clouds and globe overlays are teaching models: shapes and colours are schematic and not to scale, unless a number is given with a source.
Along the equator, the trade winds blow from east to west. They push the warm surface water of the Pacific toward Asia, where it piles up in a deep warm pool near Indonesia.
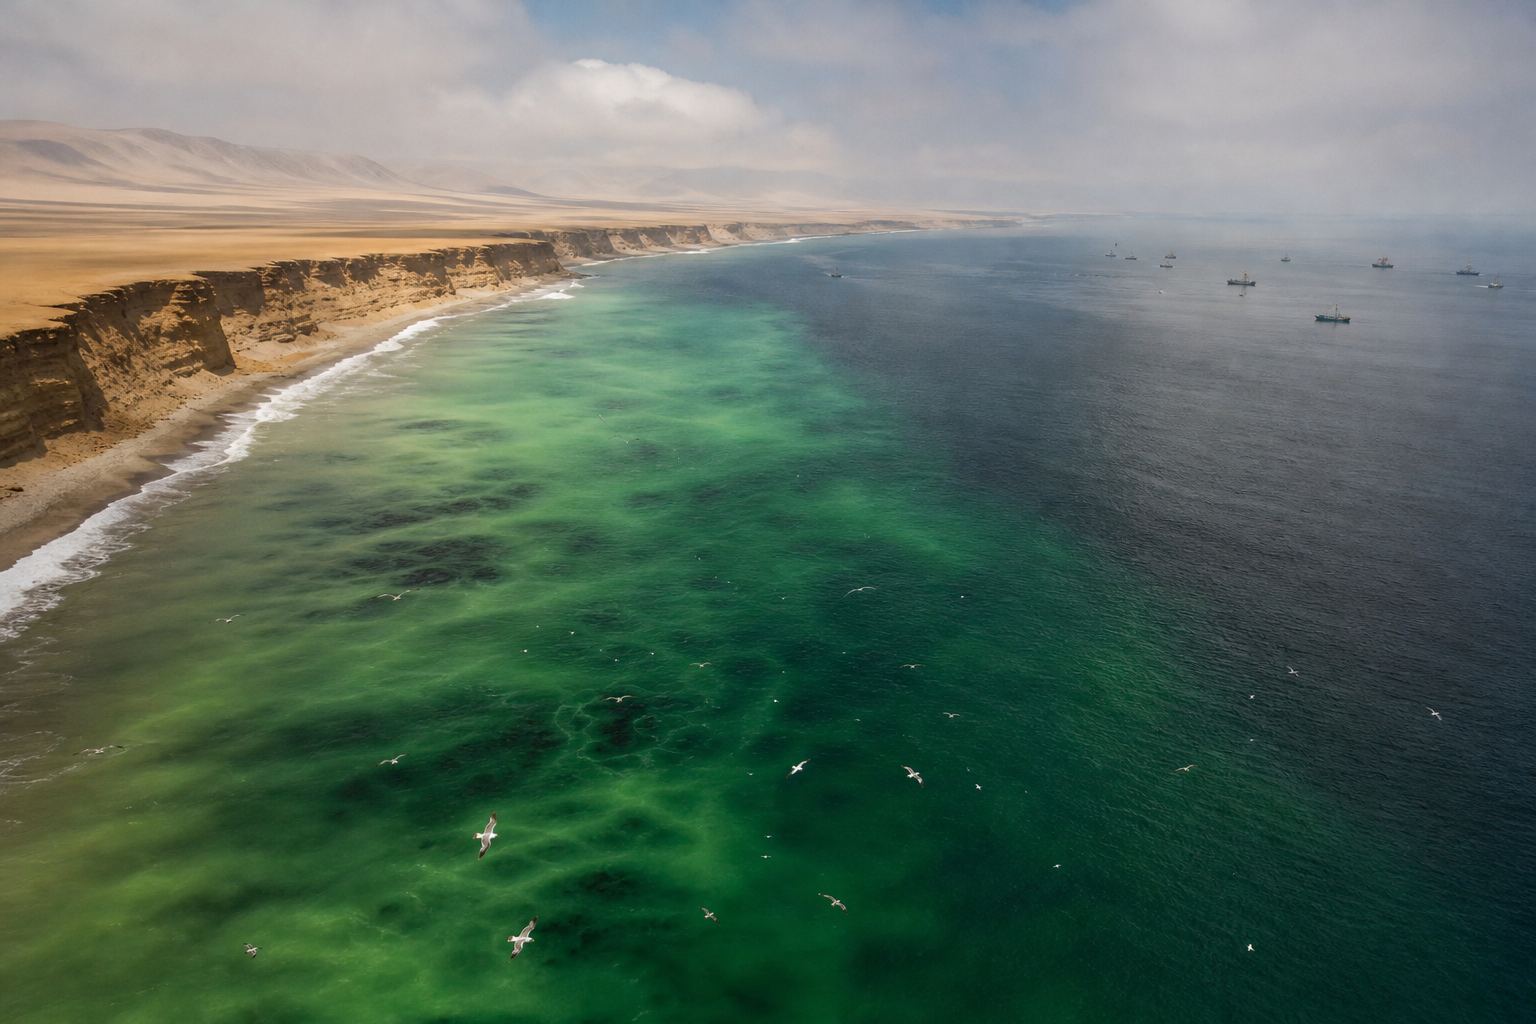
Off South America, cold water rises from below to replace the water blown away. This upwelling keeps the coast of Peru cool.
Above, the air makes a loop. It rises over the warm west, bringing rain, and sinks over the cool east, where it is dry. This loop is the Walker circulation.
So in a normal year, the sea near Indonesia is much warmer than the sea off Peru, on the same equator.
Trade winds: east → west
Warm pool piles up in the west
Cold upwelling off Peru
A normal yearCold water, rich sea Upwelled water is full of nutrients, which feed plankton, fish and seabirds. AI-generated illustration.
West
rising air, low pressure, rain
East
sinking air, high pressure, dry
The Walker circulation
Chapter I · The normal Pacific
Wind, warm pool and upwelling
US National Weather Service: in normal conditions, surface easterly trade winds blow from east to west along the equator and push warm surface water westward, creating a warm pool in the western Pacific; cool water rises from below in the east to replace it, keeping the coast of South America cool. In the Walker circulation, air rises over the western Pacific, where pressure is low and rain is common, and sinks over the eastern Pacific, where pressure is high and rain is limited.
PBS NOVA: the cool, nutrient-rich upwelling water off South America supports the eastern Pacific food chain, including fish and seabirds. The slab in the scene is a schematic slice along the equator, with depth hugely exaggerated.
The ocean slab, winds, clouds and globe overlays are teaching models: shapes and colours are schematic and not to scale, unless a number is given with a source.
Fishermen in Peru noticed that a warm current appeared off their coast every year around Christmas. They called it El Niño, the Christ Child.
In some years the warming was far stronger and lasted far longer. Fish vanished, and the seabirds, sea mammals and people who live off them went hungry. In time, the name came to mean only those big, irregular events.
Where the name comes from “El Niño” is Spanish for “the boy”; capitalised, it refers to the Christ Child. AI-generated illustration.
Upwelling weakens
Nutrients dwindle
Fish die off, seabirds go hungry
In a strong El Niño, off Peru
At first A warm current every Christmas
Later Only the rare, strong, long events
How the name changed
Chapter I · The normal Pacific
A name from the coast of Peru
PBS NOVA: Peruvian fishermen first used “El Niño”, referring to the Christ child, for a warm current that appeared every year around Christmas; over time the term came to mean only the irregular, unusually strong events. During El Niño the food supply from upwelling dwindles, fish die off, and hardship spreads to the birds, mammals and people who depend on them.
The HUD shows “1800s” for the fishermen’s usage, which predates scientific study; NOVA gives no exact date.
The ocean slab, winds, clouds and globe overlays are teaching models: shapes and colours are schematic and not to scale, unless a number is given with a source.
Every few years, the trade winds weaken. The warm water they were holding in the west sloshes back east along the equator.
Upwelling off South America weakens, so the coast warms. The rising air and the rain follow the warm water out into the central Pacific, and the Walker loop is greatly weakened.
That is El Niño. Its opposite, La Niña, comes when the trade winds blow stronger than normal, and cool water spreads further west. Try all three.
In the scene, watch the rain clouds follow the warm water.
Trade winds weaken
Warm water flows east
Upwelling off Peru weakens
Rain moves to the central Pacific
El Niño
West: drier
Indonesia and Southeast Asia (UCS)
Centre: wetter
the central Pacific
Where the rain goes
Trade winds stronger than normal
Cool water extends further west
Walker loop stronger
La Niña
Warm sea
rising air, clouds, rain
Cool sea
sinking air, clear skies
Rain follows warmth
Chapter II · When the winds tire
The warm phase and the cold phase
US National Weather Service: in El Niño, the trade winds weaken and the warm water piled up in the west flows back east along the equator; upwelling along South America weakens and coastal waters warm; the Walker circulation is greatly diminished, and rainfall increases in the central Pacific. In La Niña, the trade winds are stronger than normal, cool water extends further into the western Pacific, and the Walker circulation is stronger than normal.
Science News Explores: El Niño and La Niña are the two phases of the El Niño–Southern Oscillation (ENSO), a natural ocean–atmosphere cycle; El Niños typically last about a year. Try it: switch between a normal year, El Niño and La Niña. The slab is schematic.
The ocean slab, winds, clouds and globe overlays are teaching models: shapes and colours are schematic and not to scale, unless a number is given with a source.
Why does it grow instead of fading? In 1969, Jacob Bjerknes of the University of California, Los Angeles, gave the first modern explanation: the ocean and the air push each other.
Weaker winds mean less cold water rising in the east. The east warms, the temperature difference across the Pacific shrinks, and the winds weaken further.
It is a feedback loop. Give the winds a small nudge and watch it run.
It runs the other way too: stronger winds bring more upwelling, a bigger contrast, and stronger winds still. That way lies La Niña.
Jacob Bjerknes
UCLA: the first modern explanation of ENSO
1969
Weaker trade winds
→ less upwelling in the east
→ smaller east–west temperature difference
→ even weaker winds
The Bjerknes feedback
Stronger winds
more upwelling, a bigger contrast, stronger winds: toward La Niña
It works in both directions
Chapter II · When the winds tire
Ocean and air, pushing each other
PBS NOVA: Professor Jacob Bjerknes of UCLA gave the first modern scientific description of the mechanics of El Niño/Southern Oscillation in 1969. Penn State: the Bjerknes feedback is a positive feedback loop; a stronger Walker circulation increases the temperature difference across the Pacific, which strengthens the circulation further, and in reverse, weaker trade winds mean less upwelling of cold water in the east, a smaller temperature gradient and a slower Walker circulation.
Try it: nudge the winds and watch the feedback run in the schematic model; what eventually stops an event is not shown here.
The ocean slab, winds, clouds and globe overlays are teaching models: shapes and colours are schematic and not to scale, unless a number is given with a source.
Scientists studied the air side first. Gilbert Walker, director of observatories in India, was searching for a way to forecast the monsoon.
In 1923 he named the Southern Oscillation: when air pressure is high over the Pacific, it tends to be low from Africa to Australia, and the other way round. A seesaw of air.
Only decades later did scientists see that the seesaw and the warm water are one system. That is why it is called ENSO.
A monsoon puzzle Walker compared pressure records from stations across the Indian and Pacific oceans. AI-generated illustration.
“When pressure is high in the Pacific Ocean it tends to be low in the Indian Ocean from Africa to Australia.”Gilbert Walker, as quoted by PBS NOVA
Walker’s seesawENSO=El Nin˜o (ocean)+Southern Oscillation (air)One system, two names
Chapter II · When the winds tire
The seesaw of pressure
PBS NOVA: Sir Gilbert Walker, Director of Observatories in India, who studied the variations of the monsoon, named the Southern Oscillation in 1923; he observed that “when pressure is high in the Pacific Ocean it tends to be low in the Indian Ocean from Africa to Australia.” Science News Explores: El Niño is one phase of the El Niño–Southern Oscillation (ENSO), a natural ocean–atmosphere cycle.
Try it: swing the seesaw. The high and low pressure areas on the globe are schematic.
The ocean slab, winds, clouds and globe overlays are teaching models: shapes and colours are schematic and not to scale, unless a number is given with a source.
To measure El Niño, NOAA, the US weather and ocean agency, watches one box of ocean on the equator, between 120 and 170 degrees west. It is called Niño 3.4.
Average its surface temperature over three months and compare it with normal. If it stays at least half a degree warmer for five overlapping seasons, it counts as an El Niño.
But the whole tropics are warming. In February 2026, NOAA switched to a relative index that measures the box against the rest of the tropical oceans, so warming alone does not inflate El Niño.
5°N–5°S
latitude
120°–170°W
longitude
Niño 3.4
3-month running mean of the temperature anomaly
El Niño: +0.5 °C or more
La Niña: −0.5 °C or less
For at least 5 overlapping seasons
NOAA’s rule (Oceanic Niño Index)
Feb 2026
adopted by NOAA’s Climate Prediction Center
≈ −0.6 °C
how much weaker 2023–24 looks on it
The relative index (RONI)
Chapter III · Measuring a giant
How an El Niño is counted
NOAA Climate Prediction Center: warm and cold episodes are based on a threshold of ±0.5 °C for the Oceanic Niño Index (ONI), a three-month running mean of sea-surface temperature anomalies in the Niño 3.4 region (5°N–5°S, 120°–170°W), met for a minimum of five consecutive overlapping seasons. drought.gov (Mar 2026): in February 2026 the Climate Prediction Center adopted the Relative Oceanic Niño Index (RONI), which accounts for long-term ocean warming that the ONI does not; on it, the 2023–24 El Niño measures about 0.6 °C weaker.
The narration’s “against the rest of the tropical oceans” is a plain description of what a relative index does; drought.gov says only that RONI accounts for long-term ocean warming. Try it: compare the two indices on the schematic box. Three-month averages smooth out the ups and downs of single weeks, and criteria for declaring El Niño differ between countries’ weather services (drought.gov).
The ocean slab, winds, clouds and globe overlays are teaching models: shapes and colours are schematic and not to scale, unless a number is given with a source.
Some events stand out. On NOAA's traditional index, the 1982–83 El Niño peaked at 2.2 degrees above normal, 1997–98 at 2.4, and 2015–16 at 2.8.
In 2026, the change came fast: from La Niña to a strong El Niño in less than a year, possibly the quickest switch on record.
In October, NOAA put the chance of a record on its new index at more than half for every season to January, and the UN's World Meteorological Organization expected record warmth through December.
Records depend on the ruler: on NOAA's new index, 1997–98 still held the top spot in early October. This El Niño had emerged only in June.
Each bar: the highest 3-month average in the Niño 3.4 box
Blue line: the +0.5 °C El Niño threshold
Red: 2026’s single-day value, a different measure
How to read the bars
< 1 year
from La Niña to a strong El Niño (Science News Explores)
June
when this El Niño emerged
A fast flip
Sep–Nov
54%
Oct–Dec
83%
Nov–Jan
70%
NOAA, October: chance of a record (RONI ≥ +2.5)
1997–98
still first on NOAA’s new index in early October
Depends on the ruler
Chapter III · Measuring a giant
The giants
NOAA Climate Prediction Center ONI table (ERSSTv5): peaks of 2.2 (1982–83), 2.4 (Oct–Dec and Nov–Jan 1997–98) and 2.8 (Nov–Jan 2015–16); older data versions and some reports give 2.5–2.6 for 2015–16, and the page notes values may be revised. Science News Explores: the 2026 event emerged in June, and the shift from La Niña the previous winter to a strong El Niño took less than a year, possibly the fastest transition on record. NOAA (7 Oct 2026): a 54% chance of a record event (RONI of +2.5 °C or more) in September–November, 83% in October–December and 70% in November–January. Business Today: the WMO expects record levels in the central and eastern tropical Pacific during October–December.
The older peaks are on the traditional ONI; the 2026 odds are on the new relative index, so the two charts are not on the same scale. The 3D bars are drawn from the same NOAA values.
When the great rising column of air shifts east, it drags the world's weather with it. Scientists call these long-distance links teleconnections.
The tropics respond most reliably: drought in Indonesia, Central America and northern South America, a weaker Indian monsoon, fewer Atlantic hurricanes and more in the eastern Pacific.
Further from the equator the signal is weaker. Strong El Niños don't always bring California the wet winter it braces for; the 2015–16 winter turned out slightly drier than usual.
Uruguay and Argentina tend to get more rain. And the World Food Programme warned that tens of millions more people could face hunger, especially in Central America, the Caribbean, and eastern and southern Africa.
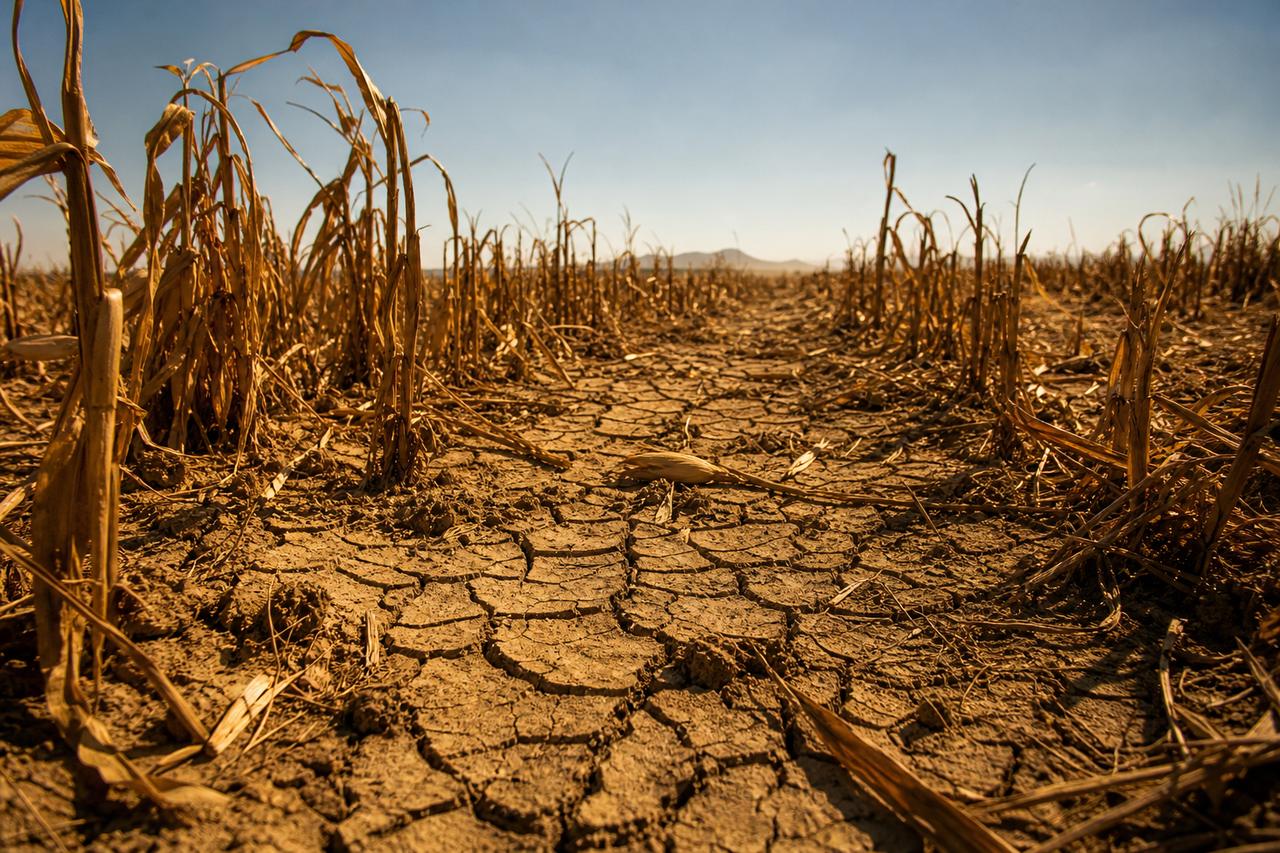
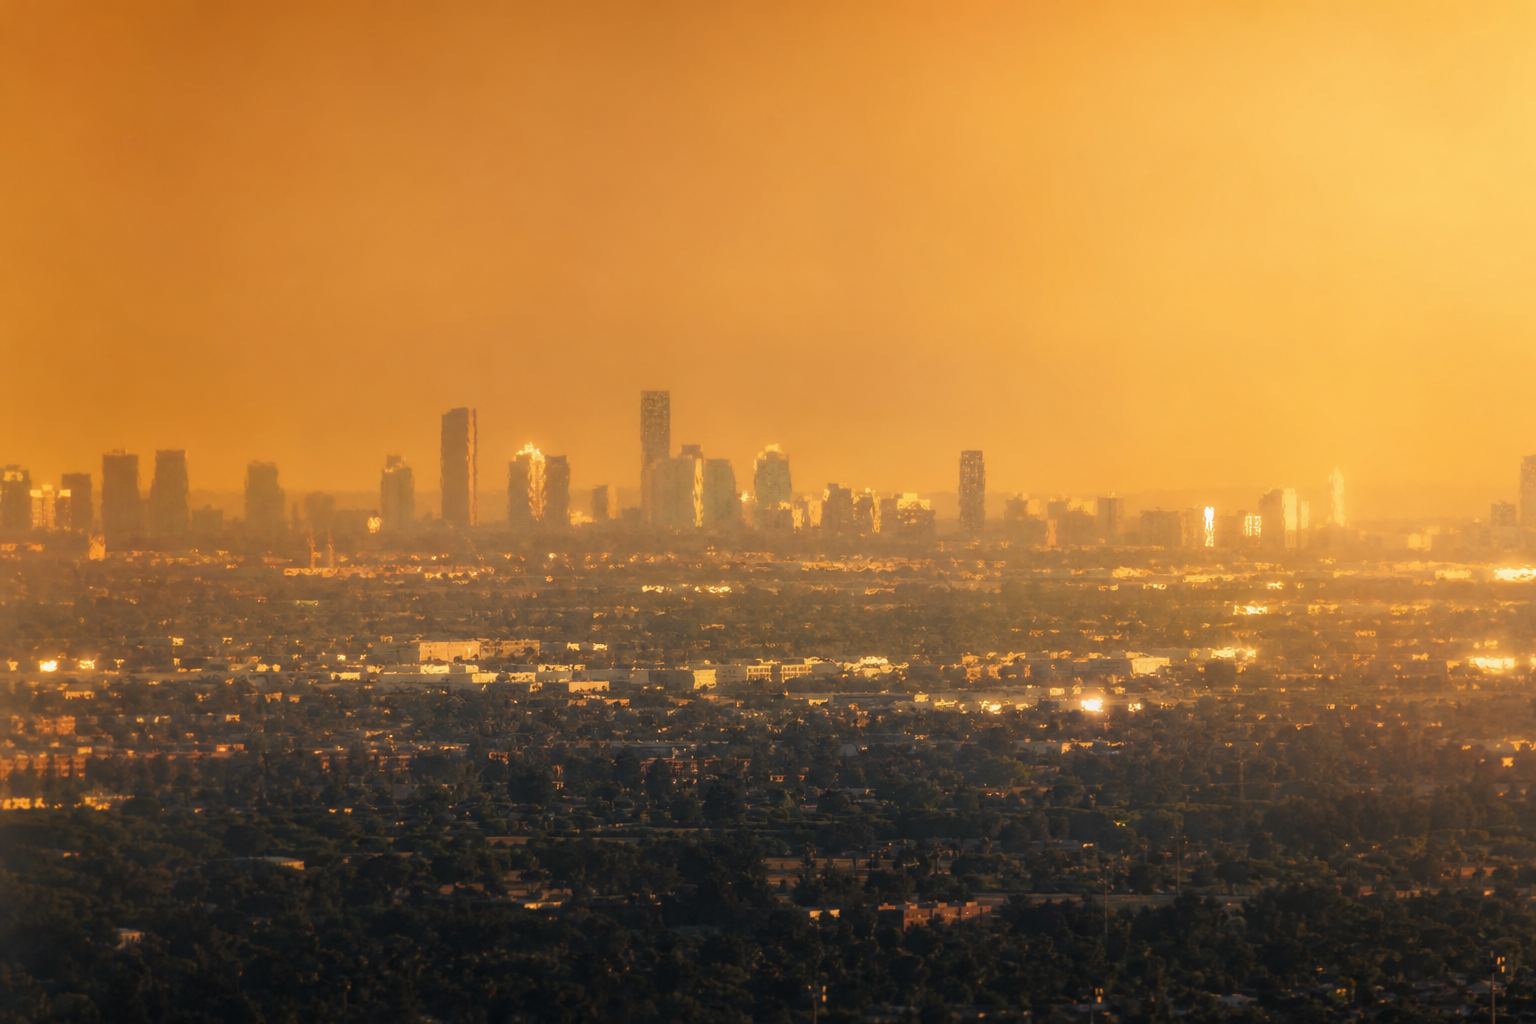
Drought far from the Pacific UCS lists drought risks in 2026 from Indonesia to southern Brazil, Mozambique and Botswana. AI-generated illustration.
Drier: Indonesia, Central America, northern South America
Weaker Indian monsoon
Fewer Atlantic hurricanes
More eastern Pacific hurricanes
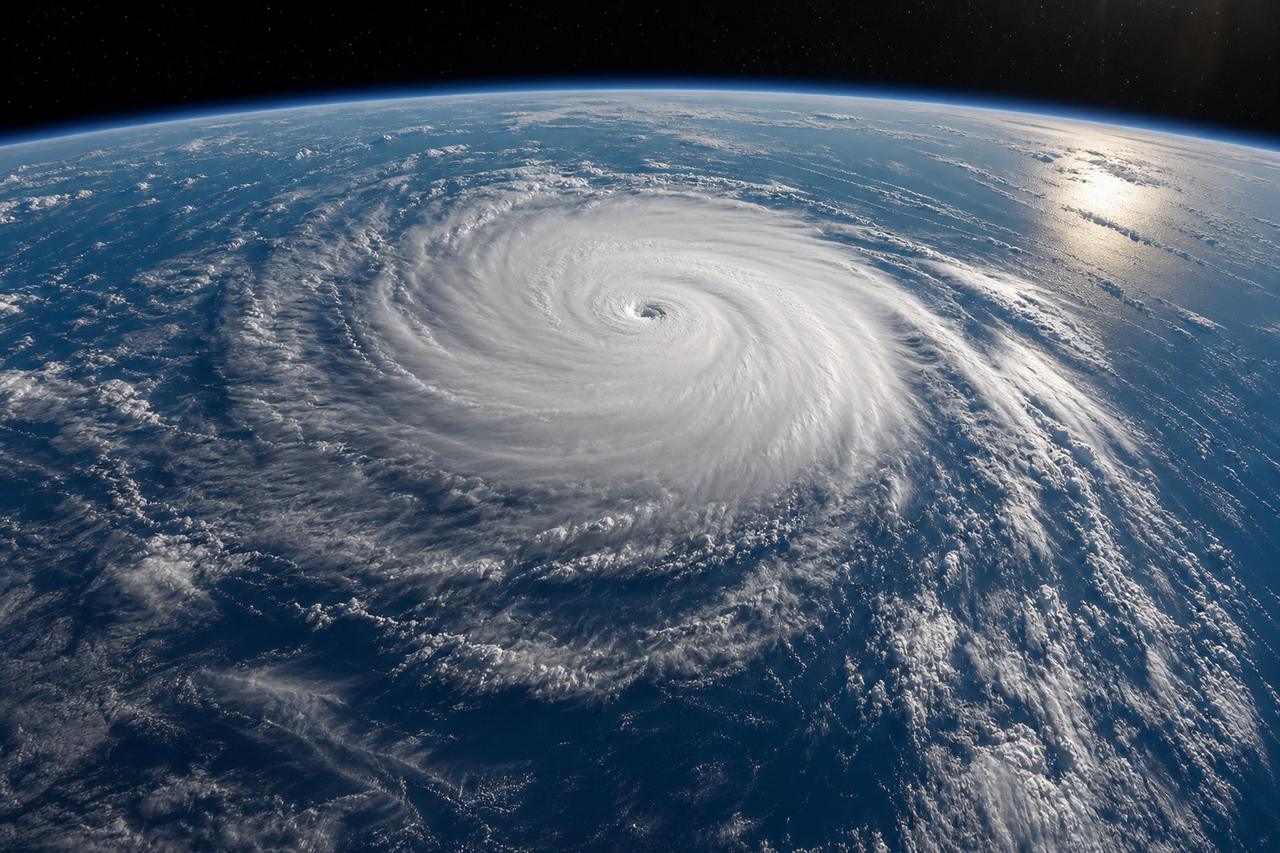
Typical tropical effectsA busy eastern Pacific UCS: the 2026 eastern Pacific hurricane season was record-setting while the Atlantic stayed quiet. AI-generated illustration.
2015–16
California slightly drier than usual (UCS)
2023–24
not the wet winter expected (Science News Explores)
Not guaranteed
Chapter IV · Around the world
Teleconnections
Science News Explores: impacts are most predictable in the tropics: a suppressed Atlantic hurricane season, an enhanced Pacific season, droughts in Central America, northern South America and the Amazon, and a weaker Indian monsoon; further from the equator the effects are less certain, and the 2023–24 El Niño did not bring the wet California weather expected. Union of Concerned Scientists: California had a slightly drier-than-usual winter during the 2015–16 Super El Niño; 2026 risks include drought in Indonesia, the Caribbean, southern Brazil, Mozambique and Botswana, a delayed monsoon in India and Southeast Asia, and a record-setting eastern Pacific hurricane season.
Try it: show the regions that tend to turn drier, or wetter. The map shading is schematic and shows typical tendencies, not a forecast.
The ocean slab, winds, clouds and globe overlays are teaching models: shapes and colours are schematic and not to scale, unless a number is given with a source.
Southeast Asia lies next to the warm pool that El Niño drains away. With less rising air overhead, the rains can falter.
In 2026, Thailand's national rainfall ran about ten percent below average. The Thai Meteorological Department expected El Niño to strengthen sharply from October to December, with upper Thailand most at risk.
The water office projected about twelve billion cubic metres of usable water in the four big Chao Phraya dams by November: less than last year, but far more than in the 2015 crisis.
Farms outside the irrigation networks are the most exposed, and the water office asked farmers to adjust their planting schedules.
≈ −10%
cumulative rainfall vs average
Thailand, mid-2026
Oct–Dec
El Niño expected to peak
mid-2027
effects easing gradually
The forecast (TMD)
2015 crisis peak
4,247
2026 (projected)
12,105
Nov 2025
17,245
Usable water, four main Chao Phraya dams (1 November)
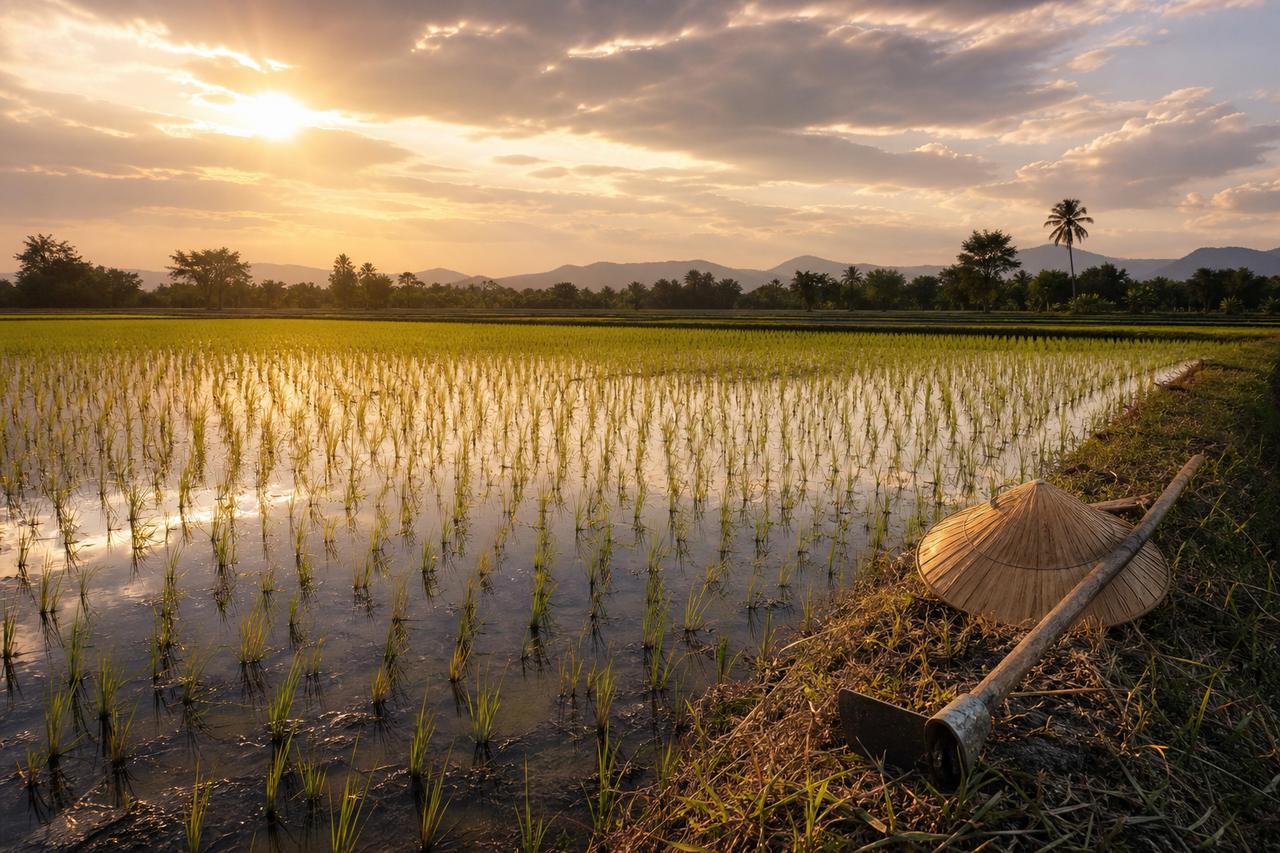
Rice and rain Farms outside irrigation networks are the most exposed, according to Thailand’s water office. AI-generated illustration.
Chapter IV · Around the world
El Niño and Thailand
Nation Thailand (29 Jul 2026): the Office of the National Water Resources (ONWR) warned that the El Niño could be more severe than in 2015, with dry spells possibly lasting into 2027; cumulative national rainfall was about 10% below average; the Thai Meteorological Department forecast El Niño to peak between October and December 2026, with upper Thailand at particularly high risk of interrupted rainfall, easing gradually through mid-2027. Projected usable water in the Bhumibol, Sirikit, Kwae Noi Bamrung Dan and Pasak Jolasid dams on 1 November 2026 was 12,105 million m³, against 17,245 million m³ in November 2025 and 4,247 million m³ at the 2015 crisis peak; areas outside irrigation networks are the most vulnerable.
Khaosod English (18 Jun 2026): ONWR said climate models projected El Niño to persist through the year. The narration’s “upper Thailand” follows the forecast’s wording. “Lies next to the warm pool” is a simplified description. Local rainfall also depends on other factors, including the Indian Ocean and seasonal storms.
The ocean slab, winds, clouds and globe overlays are teaching models: shapes and colours are schematic and not to scale, unless a number is given with a source.
An El Niño also moves heat. Warm water spread across the surface of the Pacific releases large amounts of stored ocean heat into the air.
That is why El Niño years often set global temperature records, on top of the long-term warming of the climate. Scientists expect the coming year may break them again.
Whether climate change is making El Niños themselves stronger is still debated. A NOAA scientist told Science News Explores that there is no consensus yet.
Long-term warming from greenhouse gases
Plus El Niño’s release of ocean heat
= record-prone years
Two layers of heatA hotter year UCS cites a University of Chicago estimate of more than 451,000 excess heat-related deaths in 2026. AI-generated illustration.
“Due to Earth’s warming, there is more energy in the oceans now.”Nathan Lenssen, NCAR, who notes the share attributable to climate change is debated
Still an open question
Chapter V · Heat, and what comes next
Heat from the sea
Science News Explores: El Niños release large amounts of ocean heat into the atmosphere over a short period, which can raise global temperatures; NOAA scientist Nathaniel Johnson said there is no scientific consensus yet on how climate change affects El Niño, especially extreme events, and NCAR’s Nathan Lenssen said there is debate about how much can be attributed to climate change. Union of Concerned Scientists: global temperature records may be broken over the next year; a University of Chicago Climate Impact Lab study estimates more than 451,000 excess heat-related deaths this year.
The heat-death figure is a model estimate reported by UCS, not a count. The rising-heat particles in the scene are schematic.
The ocean slab, winds, clouds and globe overlays are teaching models: shapes and colours are schematic and not to scale, unless a number is given with a source.
El Niños usually peak around the end of the year and last about a year in all. This one was expected to fade after the northern winter, and end by spring or early summer.
A strong El Niño is often followed by La Niña, with its own set of floods and droughts. The Pacific swings back the other way.
That happened after the El Niño of 2014 and 2015: two La Niñas in a row followed, in 2016 and 2017.
Jun 2026 El Niño emerges
Nov–Jan Typical peak
Spring 2027 Likely end
Later La Niña possible
A typical arc (Science News Explores)The swing back In La Niña, stronger trade winds push cool water further west than normal. AI-generated illustration.
2014–15 El Niño
2016 La Niña
2017 La Niña again
A double La Niña
Chapter V · Heat, and what comes next
What usually follows
Science News Explores: El Niños typically last about a year, so this one was likely to weaken after winter and end by spring or early summer; a strong El Niño can be followed by La Niña, which has its own global weather effects, and a “double La Niña” is possible, as in 2016–2017 after the 2014–2015 El Niño. Union of Concerned Scientists: El Niño typically peaks from November to January.
These are typical patterns, not a forecast for any place; seasonal outlooks come from national weather services. US National Weather Service: in La Niña the trade winds are stronger than normal and cool water extends further into the western Pacific.
The ocean slab, winds, clouds and globe overlays are teaching models: shapes and colours are schematic and not to scale, unless a number is given with a source.
Weaker winds, warm water drifting east, rain following it, and air that pushes back. Fishermen in Peru noticed it first; today it is one of the most closely watched patterns in the climate.
The peak of this one is due between November and January. Watch the rain on Thai rice fields, and the reservoirs behind the big dams: that is where an ocean's change of mind arrives.
1800s Peruvian fishermen name the Christmas current
1923 Walker names the Southern Oscillation
1969 Bjerknes explains the feedback
1997–98 One of the strongest events
2015–16 ONI peak of 2.8 (ERSSTv5)
2026 NOAA’s new index; a record-breaking event
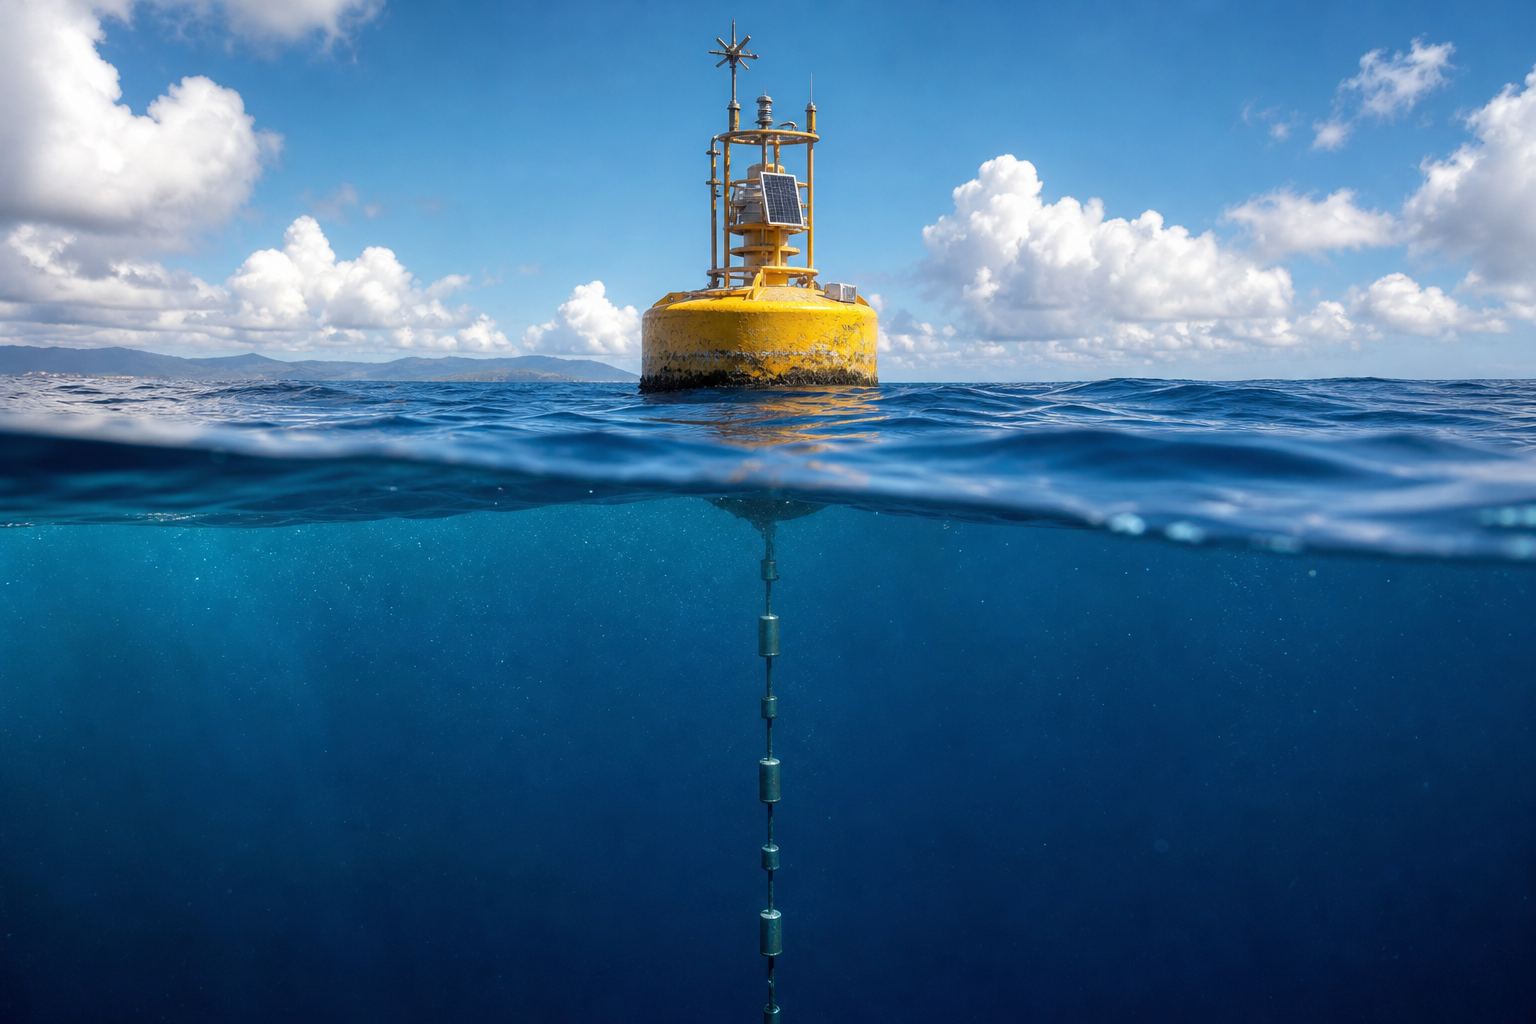
Understanding El NiñoWatching the Pacific A moored ocean buoy far out at sea. AI-generated illustration.
Stills are AI-generated
Globe uses NASA Blue Marble imagery
Ocean slab and map shading are schematic
About this film
Epilogue · Sources
Sources
Every fact in this film comes from the sources below. The chapter stills and pictures are AI-generated illustrations; the globe uses NASA Blue Marble imagery. The ocean slab, winds, clouds and the shading on the globe are schematic teaching models, not data or forecasts. Whether the 2026 event is a “record” depends on the index used, and this film says which one each time.