In October 2026 Thailand's Gulf Development set up a new company to invest in a data centre project of up to 100 megawatts. This film explains what happens inside such a building: how your request travels there as light in glass, what a server and a rack are, how the power never goes off, why every watt becomes heat and how cold and hot aisles and PUE measure the fight against it, why data centres drink water, and why AI chips are forcing a move to liquid cooling. Send a request across the world, cut the grid power, mix and separate the air, and turn an ordinary rack into an AI rack.
Interactive 3D film9 min1946 to 2030Published 18 October 2026
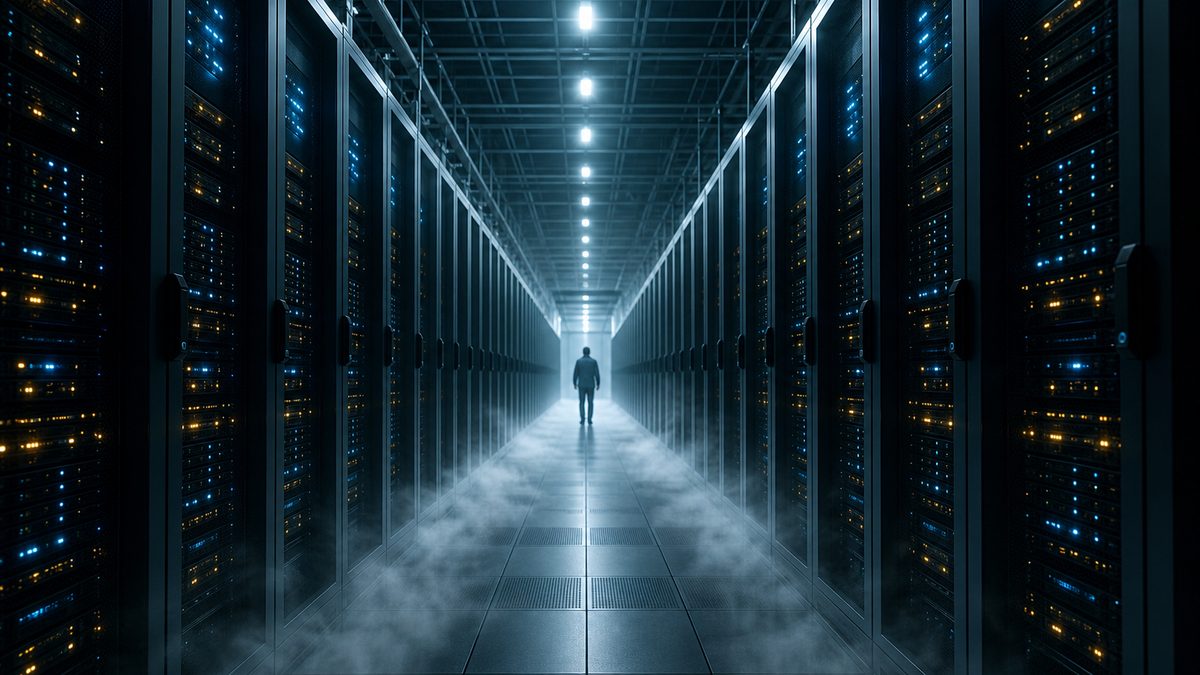
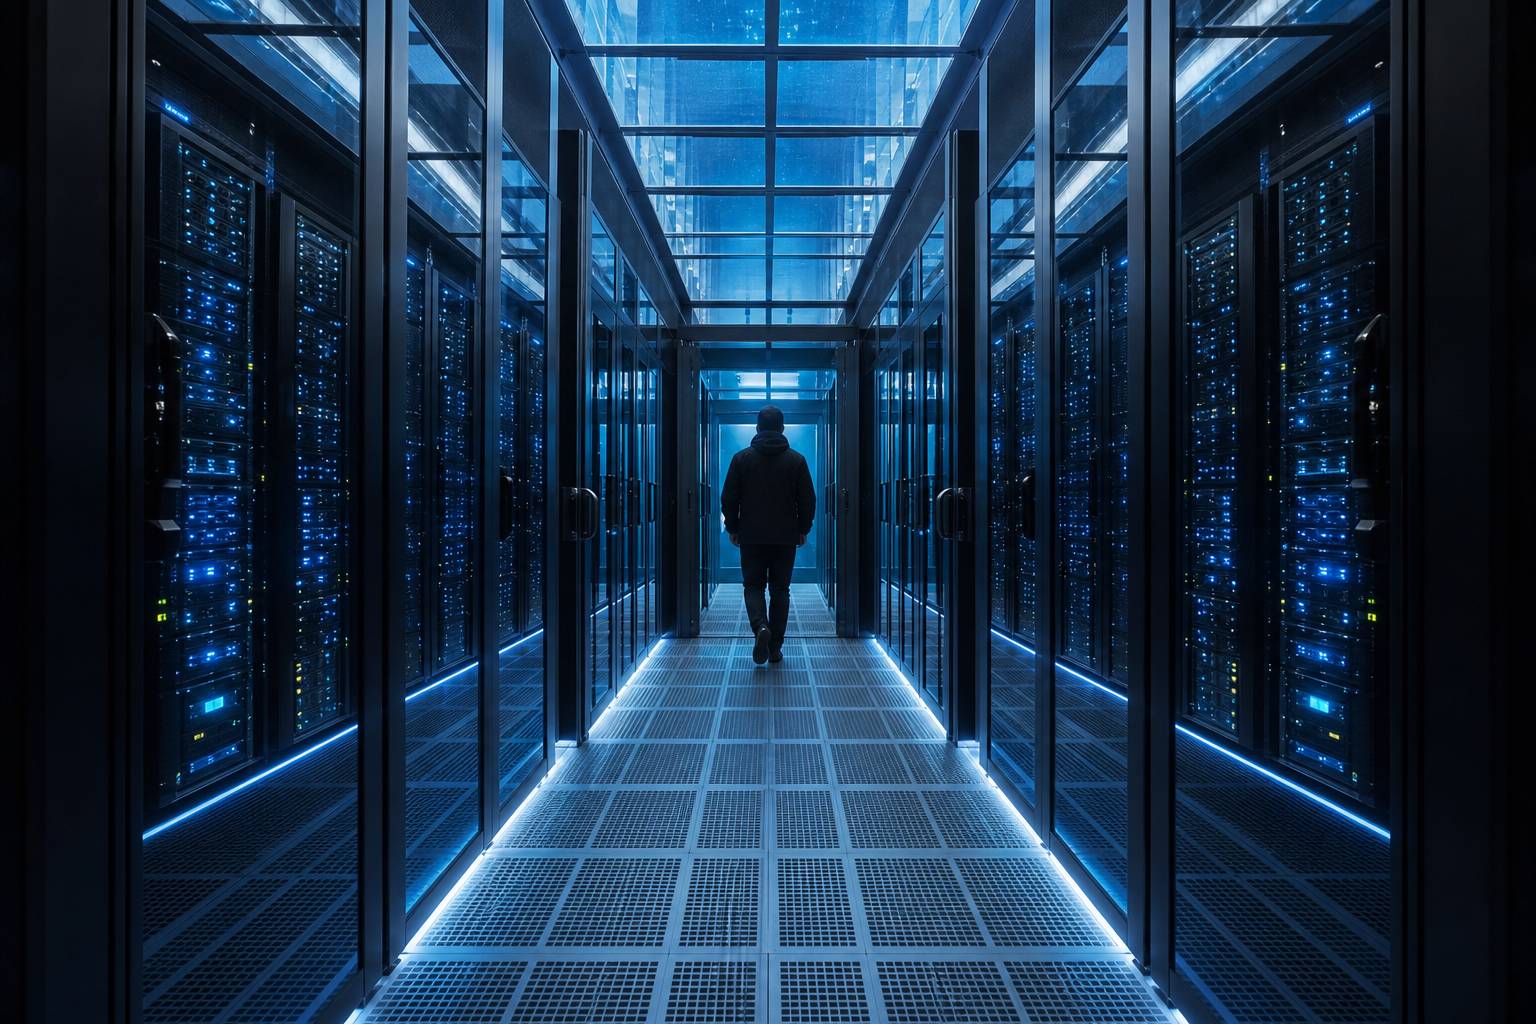
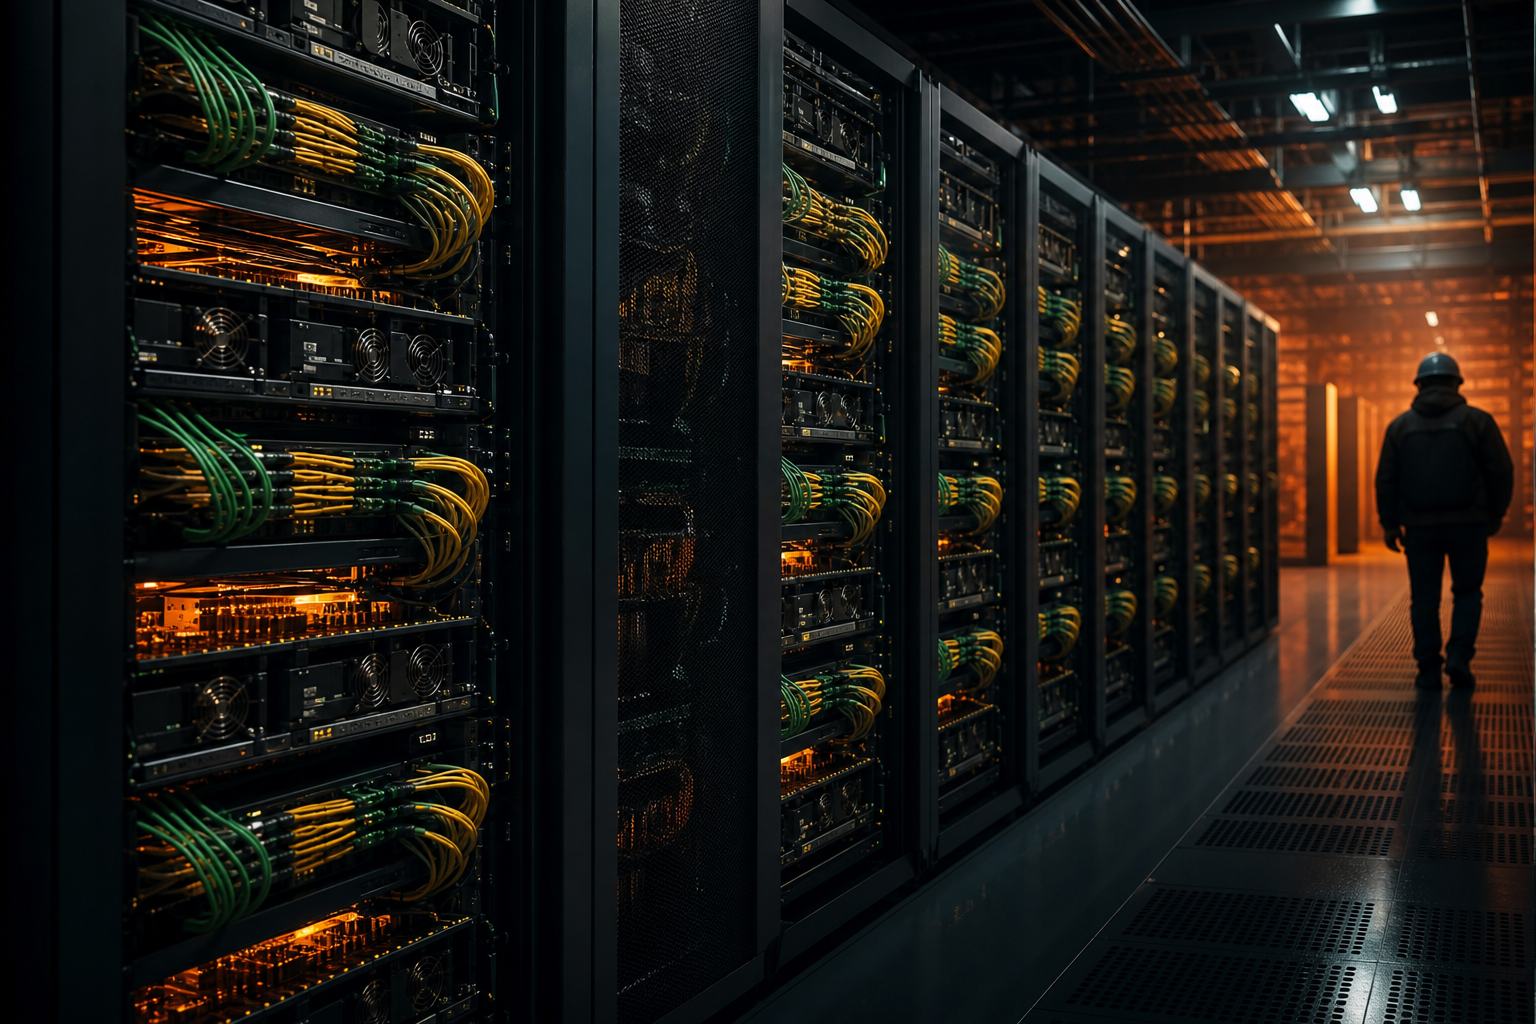
According to the International Energy Agency, a typical data centre built for AI uses as much electricity as a hundred thousand homes. It is a windowless hall packed with computers, and it never switches off.
On the fourteenth of October 2026, Thailand's Gulf Development set up a new company to invest in another one: it will own seventy percent of a data centre project of up to a hundred megawatts.
Every photo you upload and every AI answer you get is worked out in buildings like these. So what do they do with all that electricity?
The cloud “The cloud” is a nickname: the work happens on real computers in real buildings. AI-generated still.
70%
stake in Gulf Edge Data Center 01
≤100 MW
project capacity
The news
25 + 38 MW
caps of two earlier projects in which it holds 40%
Gulf’s earlier data centres
how a request reaches the building
how the power never goes off
where all the heat goes
what AI changes
This film
Prologue · The news
Gulf Edge Data Center
On 14 October 2026 Gulf Development (GULF) disclosed that it had set up Gulf Edge Data Center Co., Ltd. (GEDC), which will invest in a 70% stake in the Gulf Edge Data Center 01 project, with capacity of up to 100 MW. GULF already holds 40% of GSA Holdings, whose GSA 01 (up to 25 MW) and GSA 02 (up to 38 MW) projects are reported as approximately 70 MW. Neither report gave the new project’s location.
The companies report the earlier projects as “approximately 70 MW”; their stated caps add up to 63 MW. A data centre’s rating is its maximum, not what it draws every hour. The 100,000-homes comparison is the IEA’s, for a typical AI-focused data centre.
How to use: pick a chapter or press ← →; drag to rotate. Most steps have buttons you can press.
The 3D scenes are schematic: a simplified hall, rack and power chain, not a real building.
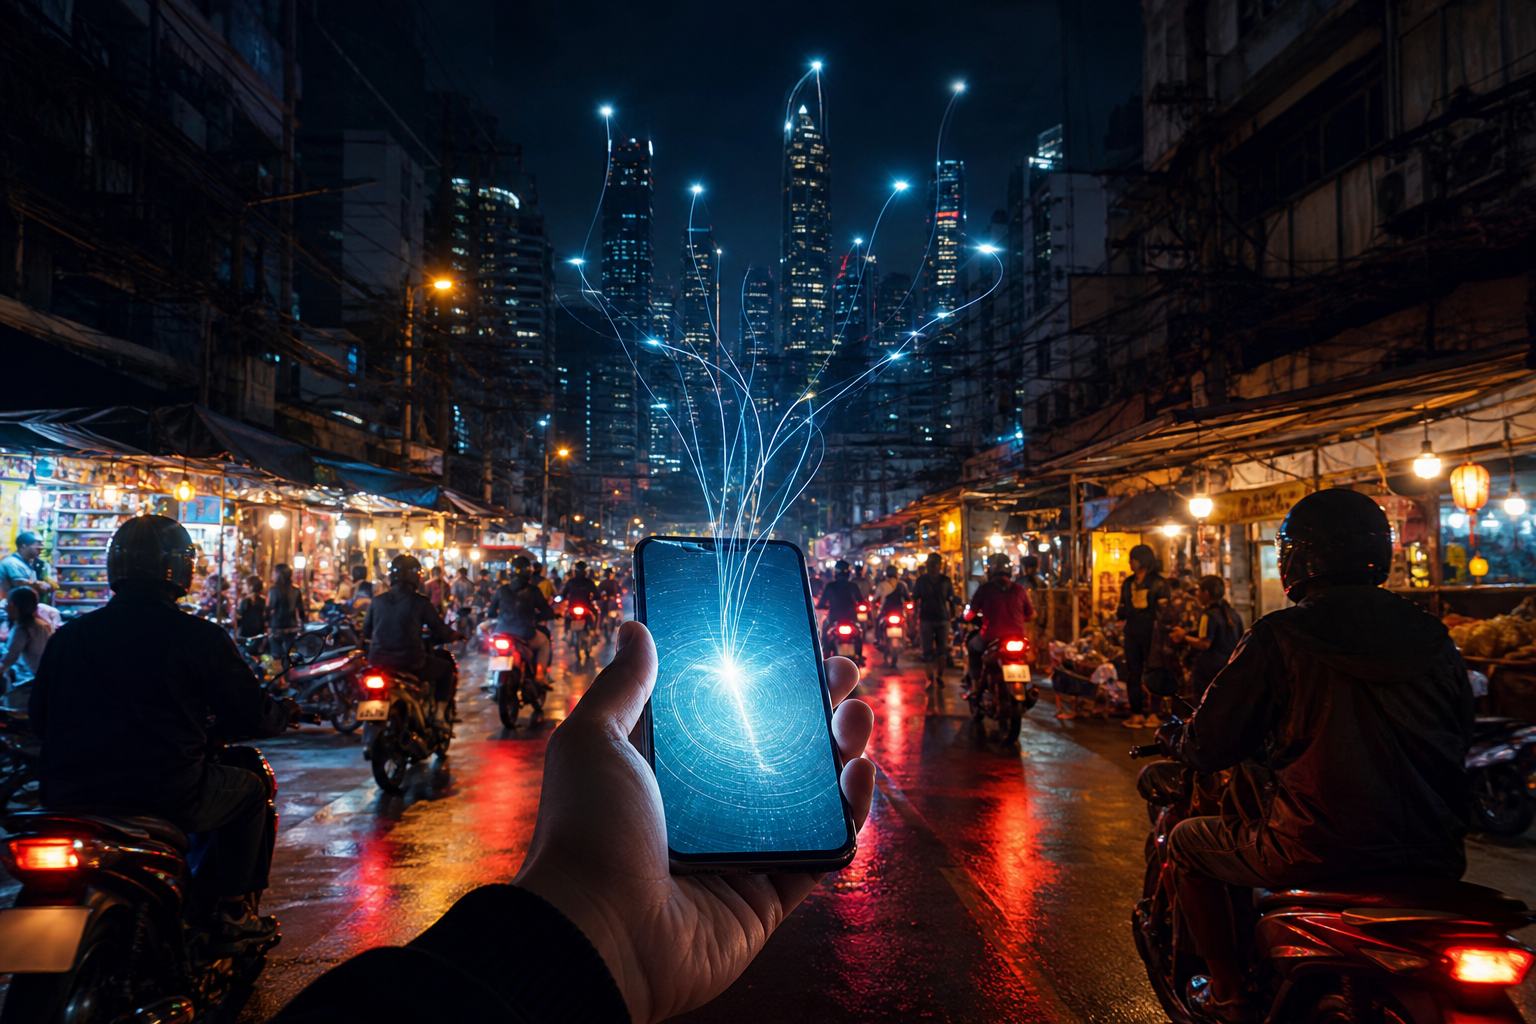
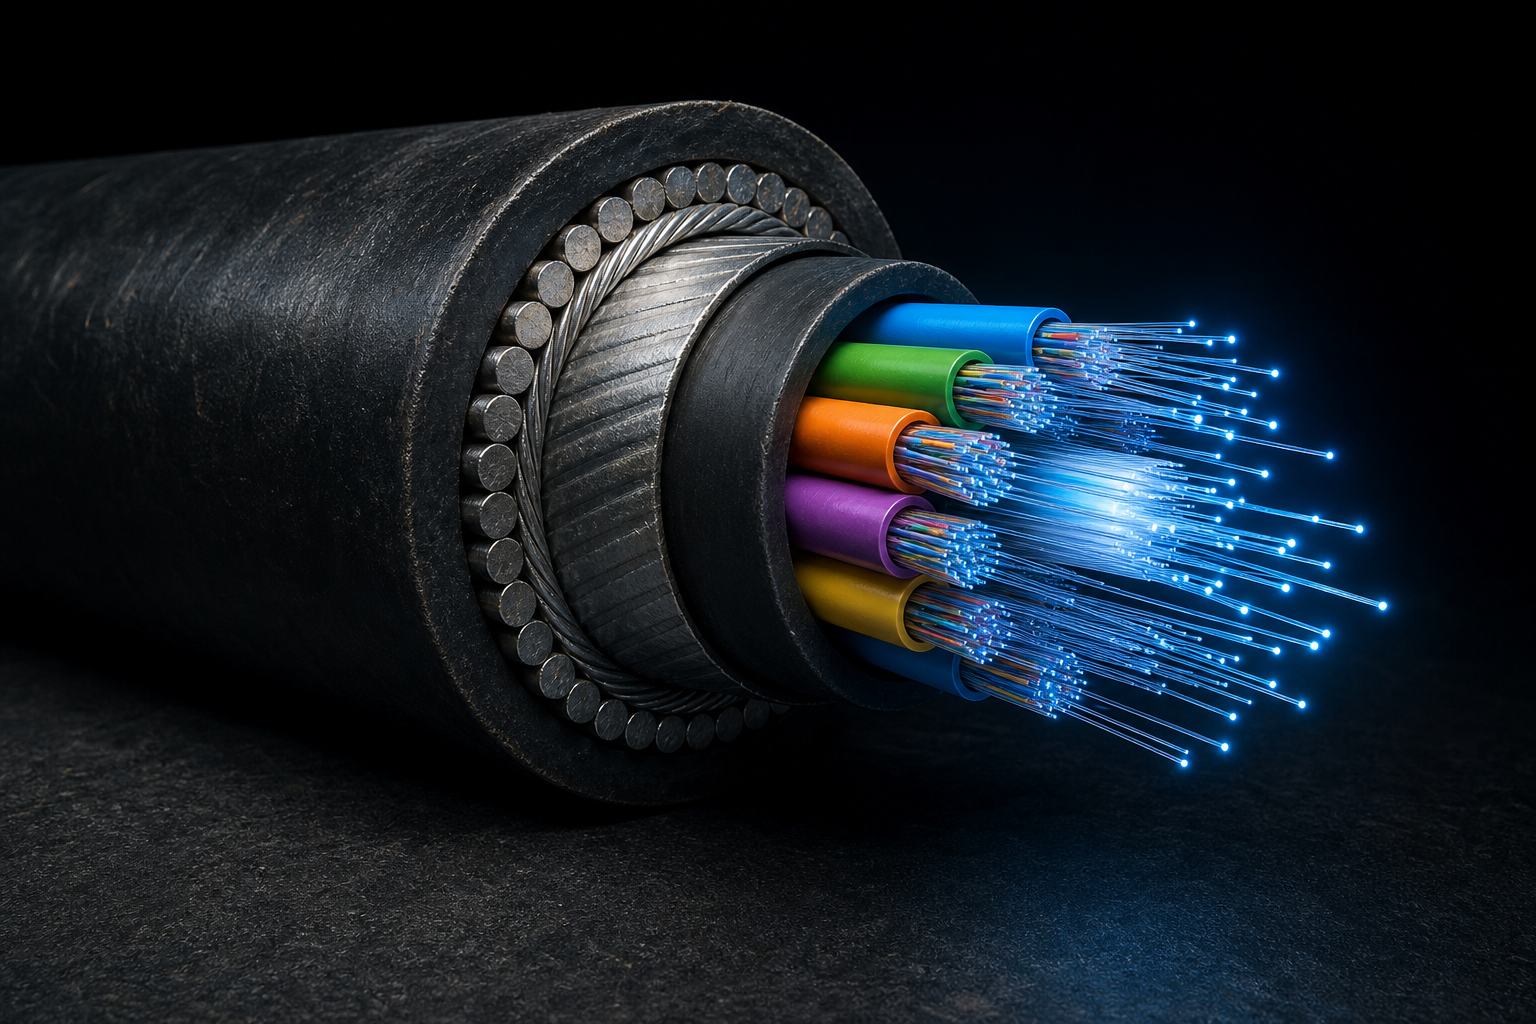
When you tap a button, your phone sends a request. Most of its journey is through optical fibre: hair-thin strands of glass that carry the data as flashes of light.
Light in glass travels at about two hundred thousand kilometres a second, two-thirds of its speed in a vacuum. That is still about five milliseconds for every thousand kilometres, one way.
Send a request across the world and back, and the delay adds up. That is one reason companies build data centres close to the people who use them.
Optical fibre Inside a cable, the glass strands sit in protective tubes and armour; the light stays trapped in the core. AI-generated still.
~200,000 km/s
glass slows light (refractive index ≈ 1.47)
~5 ms
per 1,000 km, one way
Speed of light in fibre
100 km
1 ms
1,000 km
10 ms
10,000 km
100 ms
Round trip, light alone
Chapter I · The journey
Latency
Light travels through optical fibre at about 200,000 km/s, roughly two-thirds of its speed in a vacuum, because glass has a refractive index near 1.47. That gives about 5 ms of delay per 1,000 km one way, about 10 ms for a round trip.
Real delays are longer: cables do not run in straight lines, and routers along the way add time. The bars show the floor that physics sets. Press the distance buttons in the scene.
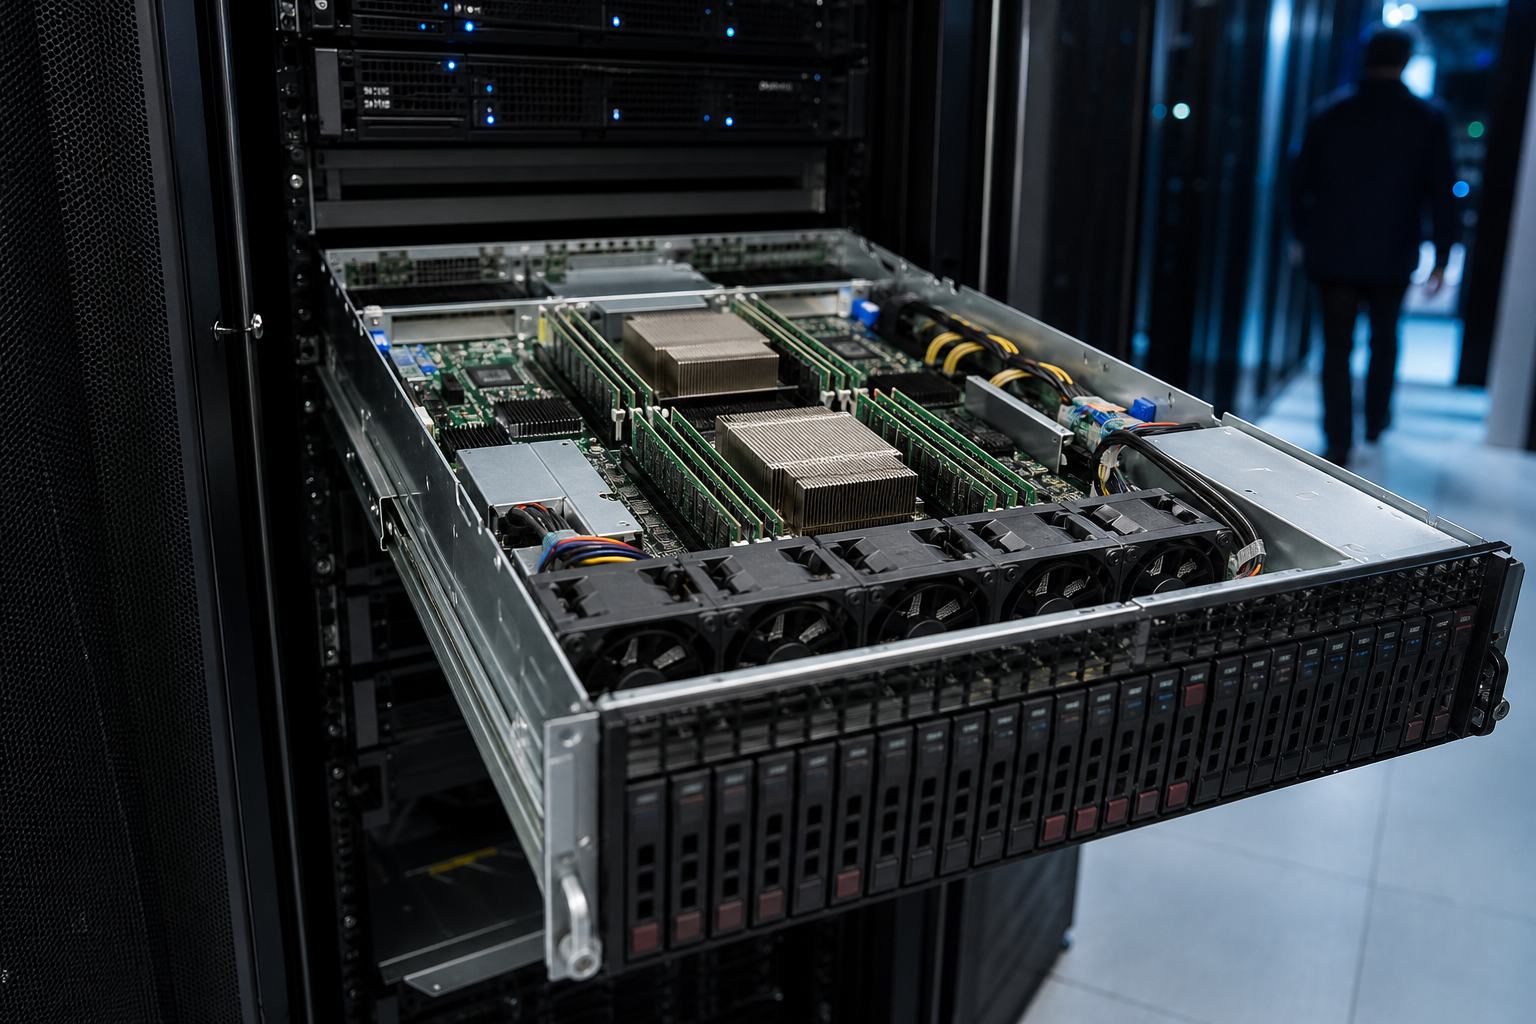
The request arrives at a server: a computer with no screen or keyboard, built to answer requests from the network all day and all night.
Inside are the same parts as in a laptop, only more of them: processors to calculate, memory to work in, drives to store data, and a network card to talk.
Servers slide into racks like drawers. A standard rack is forty-two units tall, each unit about four and a half centimetres. Rows of racks fill the hall, and the servers use most of its electricity.
a computer with no screen or keyboard
managed over the network
switched on all the time
A server isA server, opened Heat sinks on the processors, rows of memory and fans across the front. AI-generated still.
42U
a typical full-size rack: about 1.9 m of mounting space
44.45 mm
one rack unit (1U)
The rack
~60%
servers, on average (IEA)
~5% + ~5%
storage + network
Where the power goes
Chapter I · The journey
Servers and racks
A rack unit (1U) is 1¾ inches (44.45 mm); a typical full-size rack is 42U, about six feet tall. The standard is EIA-310 (worldwide, IEC 60297). The IEA estimates that servers account for around 60% of electricity demand in modern data centres, storage about 5% and networking up to 5%.
Press “Slide out a server” in the scene.
The 3D scenes are schematic: a simplified hall, rack and power chain, not a real building.
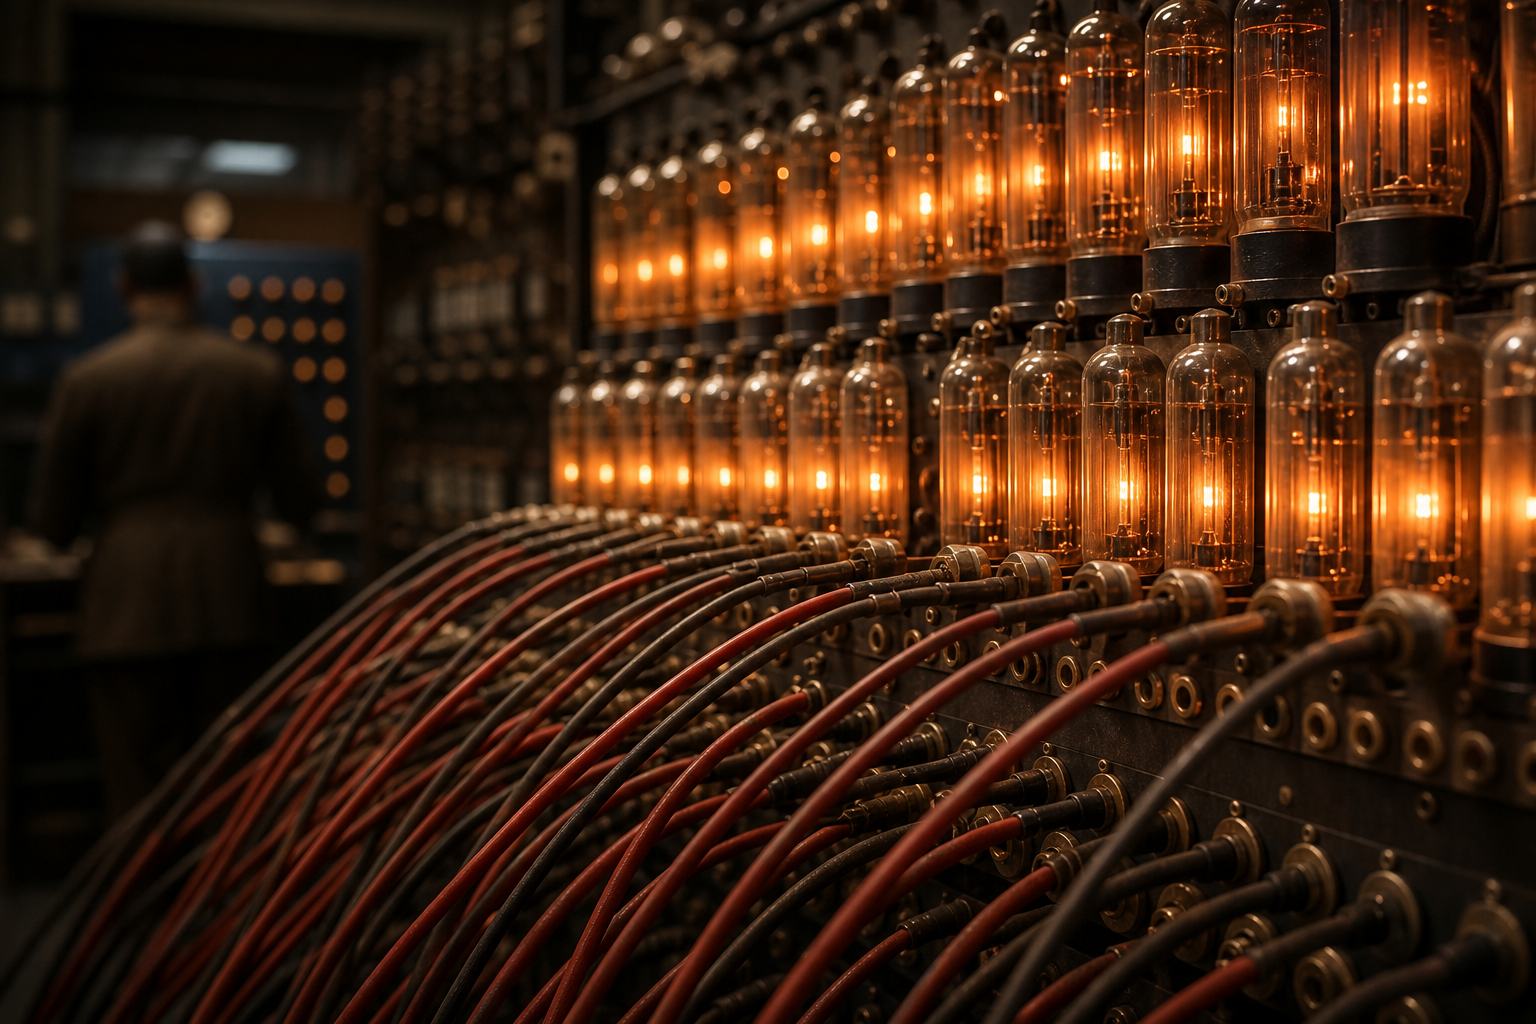
The idea of a room built around computers is as old as computing. ENIAC, unveiled in February 1946, filled a hundred and sixty-seven square metres and weighed about twenty-seven tonnes.
It had more than seventeen thousand vacuum tubes and drew a hundred and sixty kilowatts, all to run one machine.
Today one rack holds dozens of far faster computers, and a large data centre holds rows and rows of racks, all built around the same two problems: power and heat.
Vacuum tubes Each glowing tube was a switch; ENIAC needed more than seventeen thousand of them. Reconstruction, AI-generated.
17,468
vacuum tubes
160 kW
of electrical power
~27 t
weight (30 US tons)
ENIAC, 1946
1946 ENIAC fills one room
1992 IBM introduces hot and cold aisles
2024 data centres use ~1.5% of world electricity
Rooms for computers
Chapter I · The journey
ENIAC
ENIAC was first shown to the public in mid-February 1946 (Technical.ly gives 15 February). It covered 1,800 square feet (167 m²), weighed about 30 US short tons (about 27 tonnes), contained 17,468 vacuum tubes and consumed 160 kilowatts. It is now owned by the Smithsonian, with pieces on loan to the University of Pennsylvania and elsewhere.
The scene grows a hall from a single row to many; it is schematic.
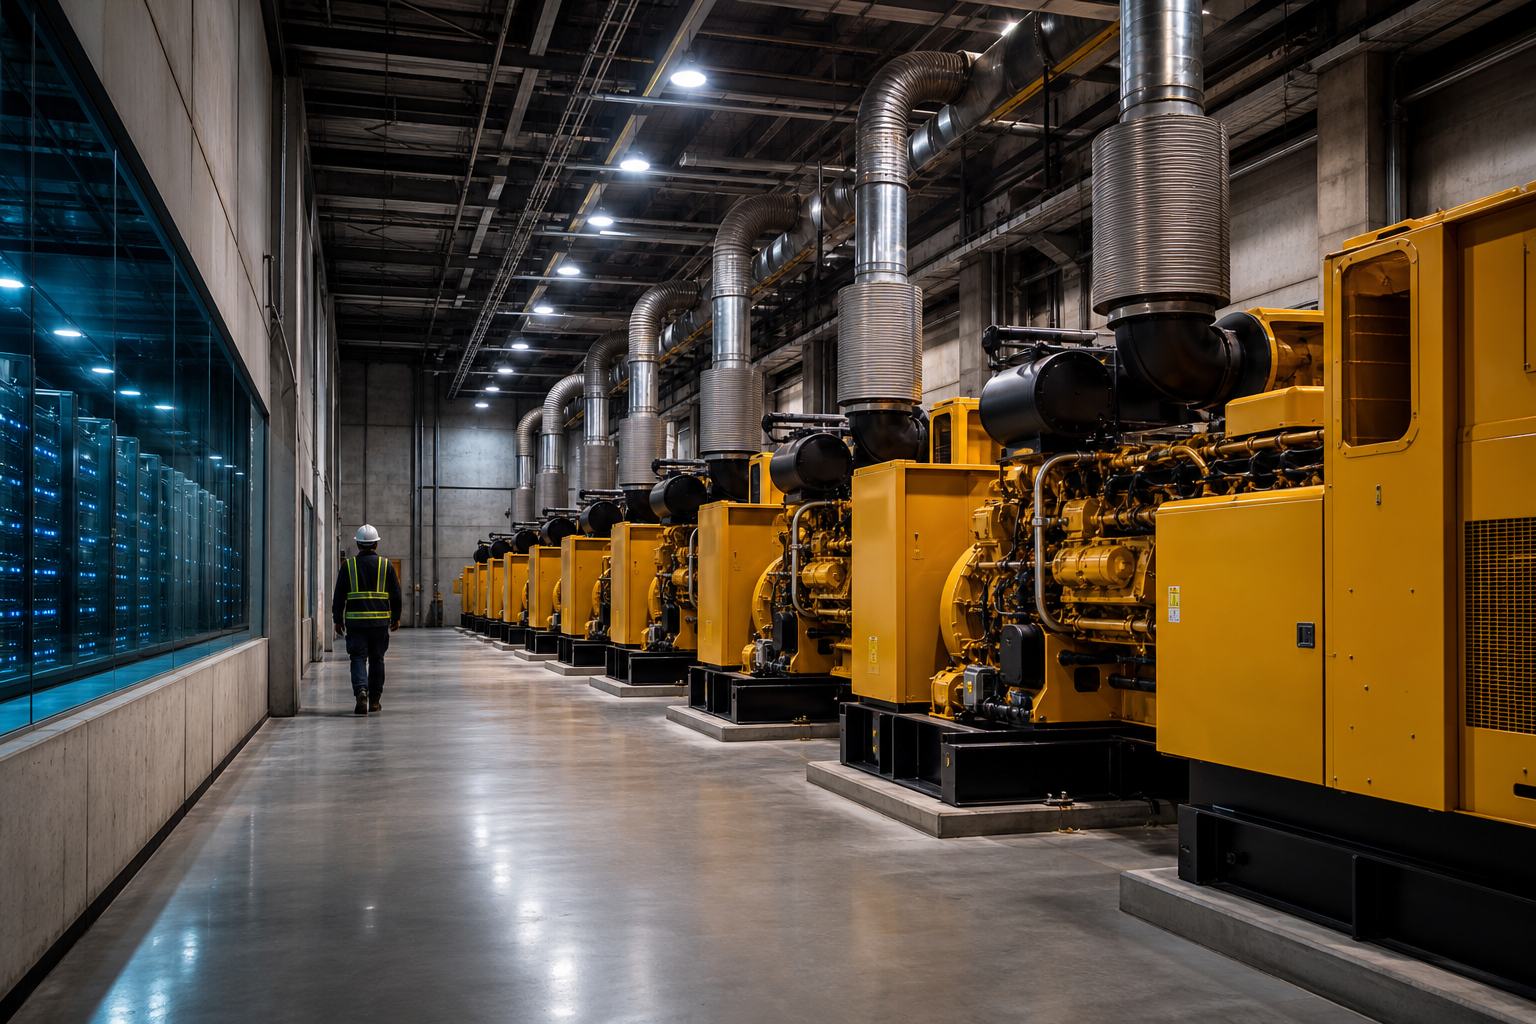
Power comes in from the grid through transformers, then through a bank of batteries called an uninterruptible power supply, and only then to the racks.
If the grid fails, the batteries take over instantly. They only need to last ten to thirty seconds, long enough for diesel generators to start. Press Cut grid power to try it yourself.
Designers rate data centres in tiers. By the commonly cited figures, a Tier Three site is built for at most about an hour and a half of downtime a year; a Tier Four site, for less than half an hour.
grid → transformer
→ uninterruptible power supply (batteries)
→ distribution to every rack
backup: diesel generators
The power chainBackup generators Generators are tested regularly but rarely run; the batteries cover the gap while they start. AI-generated still.
Tier I (99.671%)
< 28.8 h
Tier II (99.741%)
< 22 h
Tier III (99.982%)
< 1.6 h
Tier IV (99.995%)
< 26.3 min
Designed downtime per year
N: just enough equipment
N+1: one spare unit
2N: a complete second copy
Spares, in jargon
Chapter II · Power
UPS, generators and tiers
A UPS “bridges the gap between a power outage and generator startup,” typically 10–30 seconds (Datacentres.com). The Uptime Institute’s tiers: Tier I has no redundancy (99.671%, under 28.8 hours of downtime a year); Tier II partial N+1 (99.741%); Tier III full N+1 and can be maintained without shutting down (99.982%, under 1.6 hours); Tier IV is fault-tolerant, 2N or 2N+1 (99.995%, under 26.3 minutes).
N+1 means one spare beyond what is needed; 2N means a complete second copy.
The 3D scenes are schematic: a simplified hall, rack and power chain, not a real building.
Add up every data centre on Earth and, according to the International Energy Agency, they used about four hundred and fifteen terawatt-hours in 2024, around one and a half percent of the world's electricity.
The agency expects that to more than double by 2030, to around nine hundred and forty-five, with artificial intelligence the biggest driver. A typical AI-focused data centre uses as much electricity as a hundred thousand households.
The United States alone accounted for forty-five percent of data centre electricity in 2024, China for twenty-five, and Europe for fifteen.
~415 TWh
used by data centres
~1.5%
of world electricity
World, 2024 (IEA)
megawatts (MW): how fast power is drawn at a moment
terawatt-hours (TWh): energy used over a year
1 TWh = 1 million MWh
Power and energy
100,000
households’ worth of electricity, typical
×20
the largest now being built
One AI data centre
United States
45%
China
25%
Europe
15%
rest of the world
~15%
Share of data centre electricity, 2024
Chapter II · Power
The IEA figures
IEA, Energy and AI (2025): data centres consumed around 415 TWh, about 1.5% of world electricity, in 2024; consumption is set to more than double to around 945 TWh by 2030, with AI the most important driver. A typical AI-focused data centre consumes as much electricity as 100,000 households; the largest under construction will consume 20 times as much. The US accounted for 45% of 2024 consumption, China 25% and Europe 15%.
For the United States, a Lawrence Berkeley National Laboratory report for the Department of Energy estimated data centres used 176 TWh in 2023, 4.4% of US electricity, and could reach 6.7% to 12% by 2028. Projections depend on assumptions and are not forecasts of certainty. “The rest of the world” is the remainder of 100%.
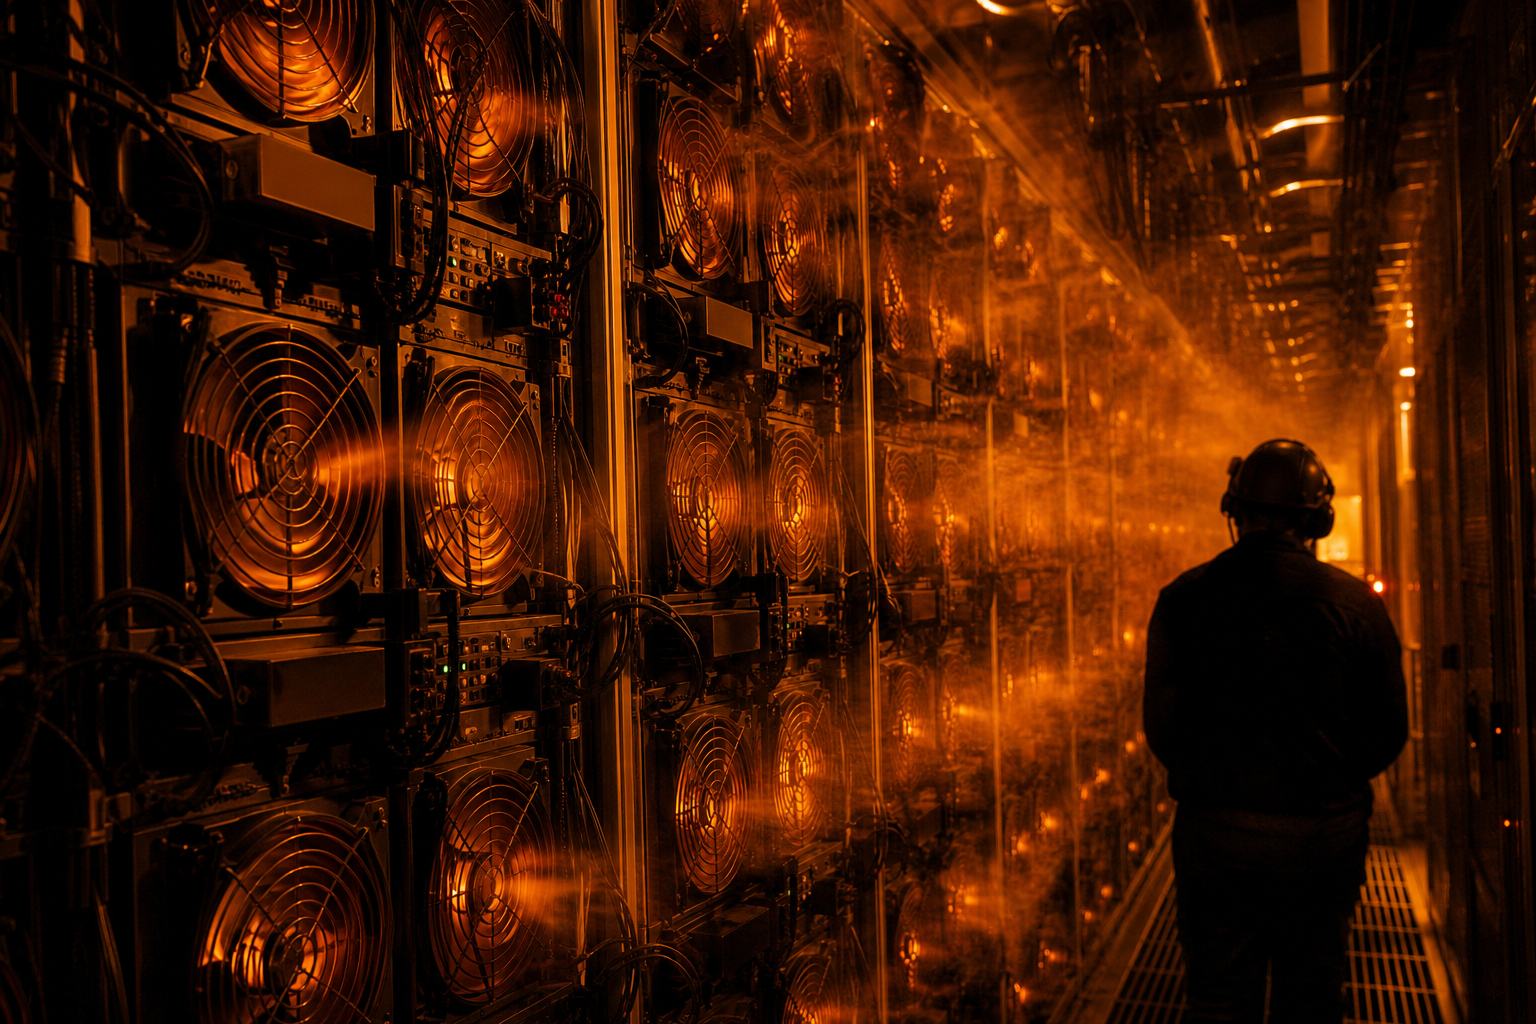
Here is the part people forget. A computer does not store the energy it uses or turn it into motion. Almost all of the energy that goes into a chip comes out again as heat.
So a hall full of servers is, in effect, a giant electric heater, and it has to be cooled every second, or the chips overheat and shut down. Press Switch off cooling to see why.
Cooling is the biggest extra use of electricity. The IEA puts it at about seven percent of a data centre's electricity in the most efficient buildings, and more than thirty percent in older, less efficient ones.
electricity in≈heat outEnergy is conserved: the work of computing ends as warmth in the room.Hot exhaust Fans pull cool air through the front of each server and push it out hot at the back. AI-generated still.
efficient large facility
~7%
less efficient enterprise site
30%+
Cooling’s share of electricity (IEA)
Chapter III · Heat
Power becomes heat
According to Chatsworth Products, every watt consumed by IT equipment becomes heat, which is why cooling design is tied so closely to power planning (Chatsworth Products). The IEA estimates cooling at about 7% of data centre electricity in efficient hyperscale facilities and over 30% in less-efficient enterprise data centres.
A tiny share of the energy leaves as light from status lamps, as sound, or down network cables; it too ends as heat somewhere. The colours in the scene show where the air is warm, schematically.
The cheapest cooling trick is about where the air goes. Racks are lined up so the fronts of two rows face each other across a cold aisle, and their backs face each other across a hot aisle.
Without it, hot exhaust from one row is sucked into the next, and the cooling has to work harder. This is that mess; press Separate the air to fix it.
IBM introduced the layout in 1992. According to ENERGY STAR, keeping supply and exhaust air apart can cut cooling energy by ten to thirty-five percent.
cold aisle: server fronts face each other
cool air rises through floor tiles
hot aisle: backs face each other
hot air returns along the ceiling
The layoutA contained cold aisle Doors and a roof over the aisle stop the two streams of air from mixing. AI-generated still.
10–35%
less cooling energy from less mixing
~2/3
of larger data centres had adopted it (NYSERDA survey)
ENERGY STAR
Chapter III · Heat
Hot aisle / cold aisle
ENERGY STAR: racks sit in alternating rows with the cold air intakes (the fronts of servers) facing each other and the hot exhausts facing each other. In raised-floor rooms, cooling units push air under the floor; it rises through perforated tiles into the cold aisle, and hot exhaust returns along the ceiling. The layout originated with IBM in 1992; reducing mixing can save 10 to 35 percent of cooling energy.
The 3D scenes are schematic: a simplified hall, rack and power chain, not a real building.
Engineers track this with one number: power usage effectiveness, or PUE. It is all the electricity the building uses, divided by the electricity that reaches the computers.
A perfect building would score one. The Uptime Institute's surveys found an average of two and a half in 2007, which means a watt and a half of overhead for every watt of computing.
By 2024 the average was down to about one point five six, and it has barely moved for years. Try the buttons to change the cooling and watch the number.
PUE=IT equipment powertotal facility powerOverhead includes cooling, power conversion losses and lighting.
2007
2.5
2011
1.98
2013
1.65
2018
1.58
2024
1.56
Average PUE, Uptime Institute surveys
1 W
to the computers
+0.56 W
for cooling and losses
PUE 1.56 in plain words
Chapter III · Heat
Power usage effectiveness
PUE is total facility power divided by the power consumption of IT equipment. Uptime Institute surveys: an average of 2.5 in 2007, 1.98 in 2011, 1.65 in 2013 and an all-time low of 1.58 in 2018; through the 2020s it has stayed between 1.55 and 1.59, with 1.56 in 2024.
The survey average mixes old and new sites; new large facilities often report lower values. In the scene the buttons change the cooling load in a simple model and recompute PUE.
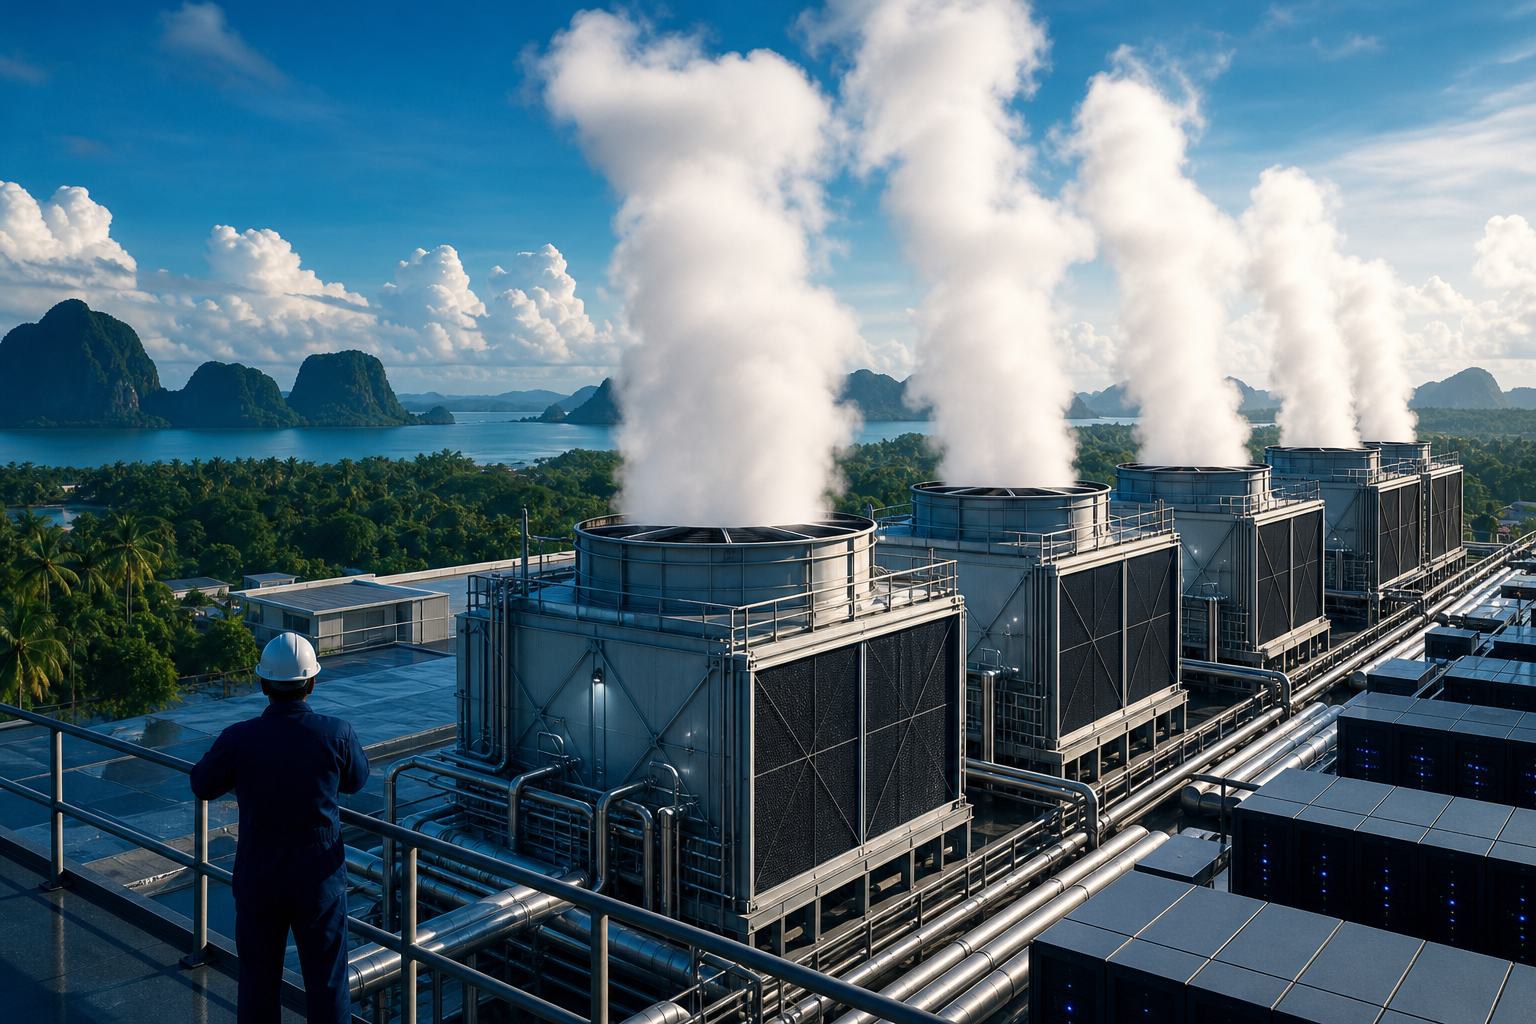
Many data centres get rid of heat the way your body does: by evaporating water. In cooling towers, warm water is sprayed into moving air, a little of it evaporates, and that carries the heat away.
The catch is that the evaporated water is gone. A report for the US government found American data centres consumed sixty-six billion litres directly in 2023, three times as much as in 2014.
Dry coolers that use only fans save that water but need more electricity, so designers trade one against the other. Press Dry coolers to compare.
Cooling towers The white plume is water vapour carrying heat away. AI-generated still.
2014
21.2 bn L
2023
66 bn L
Direct water use, US data centres (LBNL)
84%
went to hyperscale sites: the giant data centres of the big cloud companies
Who uses it
Chapter III · Heat
Water
According to the 2024 Lawrence Berkeley National Laboratory report for the US Department of Energy (as reported by DatacenterDynamics), US data centres directly consumed 21.2 billion litres of water in 2014 and 66 billion litres in 2023, 84% of it in hyperscale facilities; hyperscalers alone are expected to use 60 to 124 billion litres in 2028.
“Direct” water is what the site itself consumes, mostly by evaporation; power stations that make the site’s electricity use water too. Not every data centre uses evaporative cooling: some use closed loops of air or liquid. The cooling-tower scene is schematic.
Artificial intelligence changes the picture. Training and running large AI models uses chips called GPUs, graphics processors first built for video games, packed close together so they can share data quickly.
An ordinary rack typically draws less than ten kilowatts; the average is still below eight. A rack of GPU servers can draw twenty, fifty, even more than a hundred kilowatts.
The IEA expects electricity for these GPU servers, which it calls accelerated servers, to grow by about thirty percent a year, making up almost half of the growth in data centre demand to 2030.
An AI server board Several large accelerator chips per server, often under copper cold plates. AI-generated still.
average rack (Uptime survey)
< 8 kW
typical enterprise rack
< 10 kW
GPU rack, AI training
20–100+ kW
Power per rack
~30%/yr
growth in accelerated-server electricity
~½
of the net increase in data centre demand
IEA base case to 2030
Chapter IV · The AI squeeze
Rack power density
Chatsworth Products: traditional enterprise racks typically operate below 10 kW, while modern GPU-based deployments frequently operate at 20–100+ kW per rack, with training most likely to reach the top of that range. The Uptime Institute’s survey finds average rack densities still below 8 kW. The IEA projects accelerated-server electricity to grow about 30% a year in its Base Case, accounting for almost half of the net increase to 2030.
GPU stands for graphics processing unit: chips first built for graphics that turned out to suit the arithmetic of AI.
Above about thirty kilowatts per rack, blowing air starts to run out of steam. So the newest AI halls pipe liquid right to the chips.
In direct-to-chip cooling, a coolant, often water-based, flows through a sealed metal cold plate on top of each processor, never touching the circuits. Litre for litre, water can soak up about three and a half thousand times more heat than air.
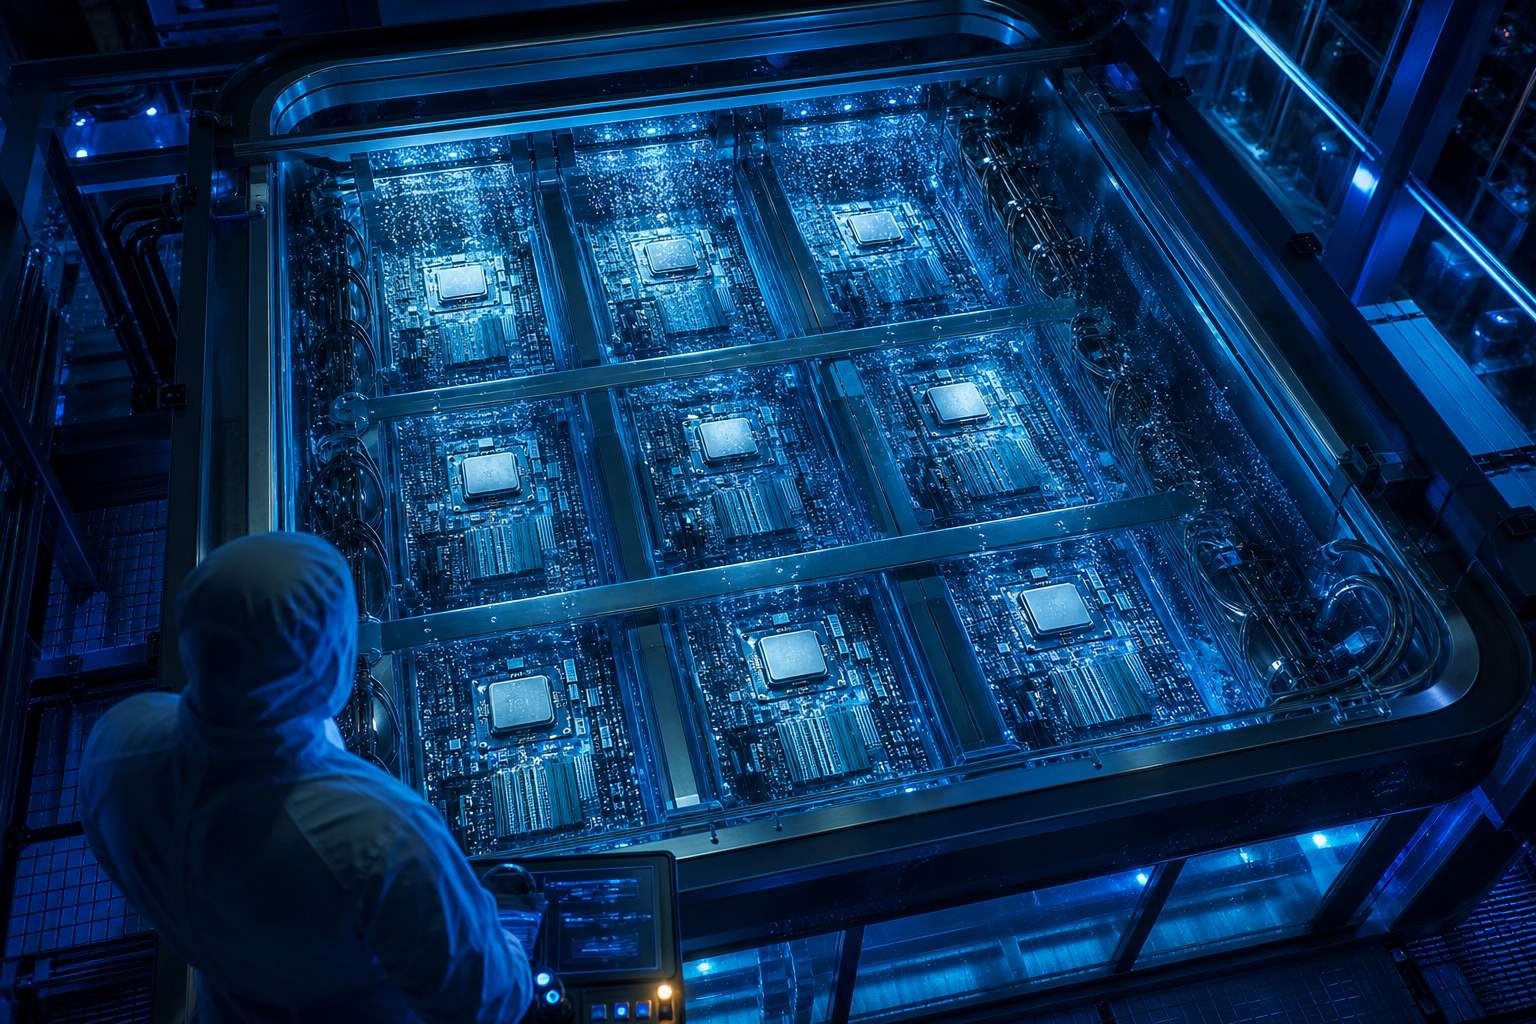
Some designs go further and sink whole servers in a tank of liquid that does not conduct electricity. The heat leaves through pipes instead of through the air of the room.
below ~30 kW per rack: optimised air usually copes
above that: hybrid or liquid cooling
power and cooling are planned together
When air runs out(ρc)air(ρc)water≈1.2kJ/m3K4,180kJ/m3K≈3,500Heat a litre of each by one degree: water takes about 3,500 times more energy.
cool liquid is pumped in
it flows through a sealed cold plate on each chip
warm liquid carries the heat out of the room
Direct-to-chip, step by stepImmersion cooling The coolant is a dielectric fluid; in two-phase systems it boils off at the chips and condenses again. AI-generated still.
Chapter IV · The AI squeeze
Liquid cooling
Below about 30 kW per rack, optimised air cooling can often cope; above that, hybrid or liquid cooling is considered (Chatsworth). Direct-to-chip cooling pumps coolant through a cold plate in direct contact with the chip; single-phase immersion submerges servers in a non-conductive coolant, and in two-phase immersion the dielectric fluid boils off to carry heat away (Penguin Solutions).
The 3,500 figure compares volumetric heat capacity: water about 4,180 kJ per cubic metre per kelvin, air about 1.2. Data Center Knowledge quotes “3,400 times”; the exact value depends on temperature.
Southeast Asia is part of the boom. The IEA expects data centre electricity demand in the region to more than double by 2030, with a hub forming around Singapore and southern Malaysia.
In Thailand, Gulf's two earlier projects are capped at twenty-five and thirty-eight megawatts, and the new one could add up to a hundred more. Each needs a strong grid connection, a lot of cooling, and often water.
Where the electricity comes from matters too. Worldwide, the IEA expects renewables and natural gas to supply most of the new data centre demand.
×2+
data centre electricity demand by 2030
Southeast Asia (IEA)
a strong connection to the grid
cooling sized for every watt
often, a water supply
fast fibre links to users
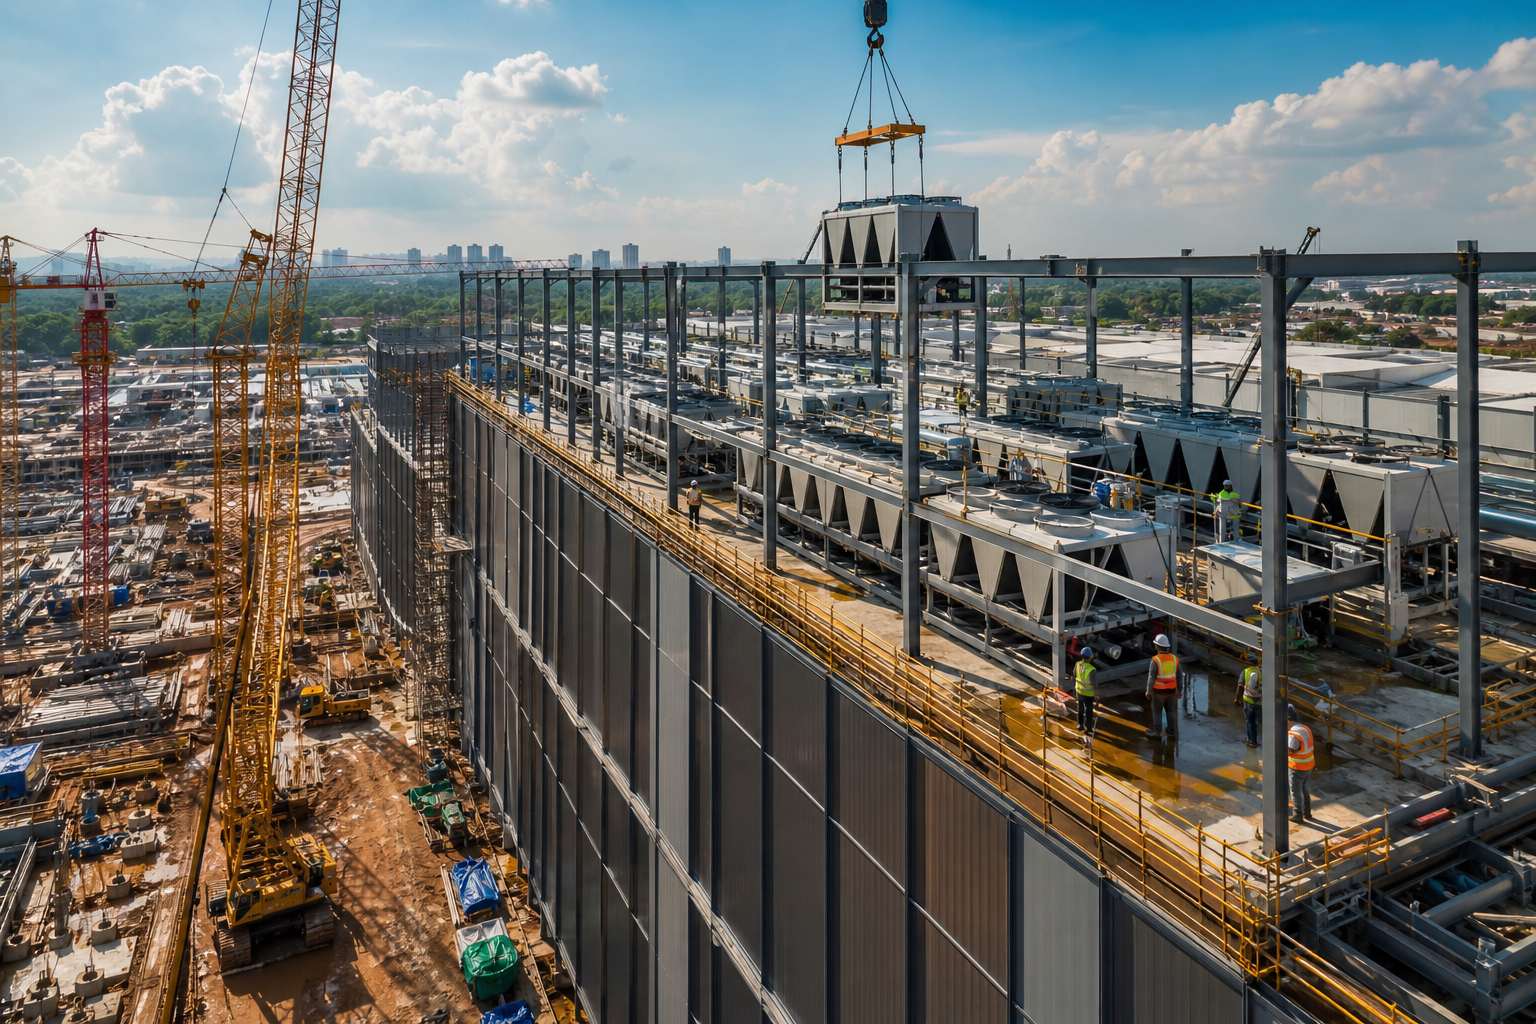
What a new site needsBuilding out Rooftop chillers and a substation are as much a part of a data centre as the servers. AI-generated still.
renewables
natural gas
the mix differs by country
Meeting new demand, worldwide (IEA)
Chapter V · Next door
The regional picture
IEA: in Southeast Asia, electricity demand from data centres is expected to more than double by 2030, partly due to a regional hub in Singapore and southern Malaysia. Globally, renewables and natural gas take the lead in meeting data centre electricity demand. In Thailand, GULF holds 40% of GSA Holdings (GSA 01 up to 25 MW, GSA 02 up to 38 MW; reported as approximately 70 MW) and plans 70% of Gulf Edge Data Center 01 (up to 100 MW).
Megawatt figures are capacity caps reported by the company; a data centre is usually built and filled in phases.
So the cloud is a building: light in glass brings the request, servers in racks do the work, batteries and generators keep the power on, and almost every watt leaves again as heat.
As AI grows, the hard part is no longer the computing. It is finding the power, and moving the heat. So when the next hundred-megawatt building goes up, ask two questions: where will its electricity come from, and where will its heat and water go?
1946 ENIAC: 160 kW in one room
1992 hot and cold aisles
2007 average PUE 2.5
2024 ~415 TWh; PUE 1.56
2026 Gulf Edge Data Center, up to 100 MW
2030 ~945 TWh projected (IEA)
Milestones
distance costs time: ~5 ms per 1,000 km
power must never stop
electricity in ≈ heat out
AI racks need liquid cooling
Four things to remember
PUE
closer to 1.0 = less waste
One number to watch
Epilogue
Sources
Every number in this film comes from the sources below. Projections (IEA, LBNL) are scenarios, not certainties.
Stills are AI-generated illustrations, not photographs.
The 3D scenes are schematic: a simplified hall, rack and power chain, not a real building.