In October 2026, scientists in Germany reported that specks of nuclear fuel from Chernobyl have kept much of their crystal structure for forty years. This film explains the disaster behind them: how the Soviet RBMK reactor worked and the quirk that made it unstable at low power, the test that went wrong on 26 April 1986, which radioactive atoms escaped and how fast they decay, how the cloud crossed Europe, the evacuation and the human toll, the shelters built over the ruin, and what the new study does and does not mean.
Interactive 3D film10 min1986 to 2026Published 24 October 2026
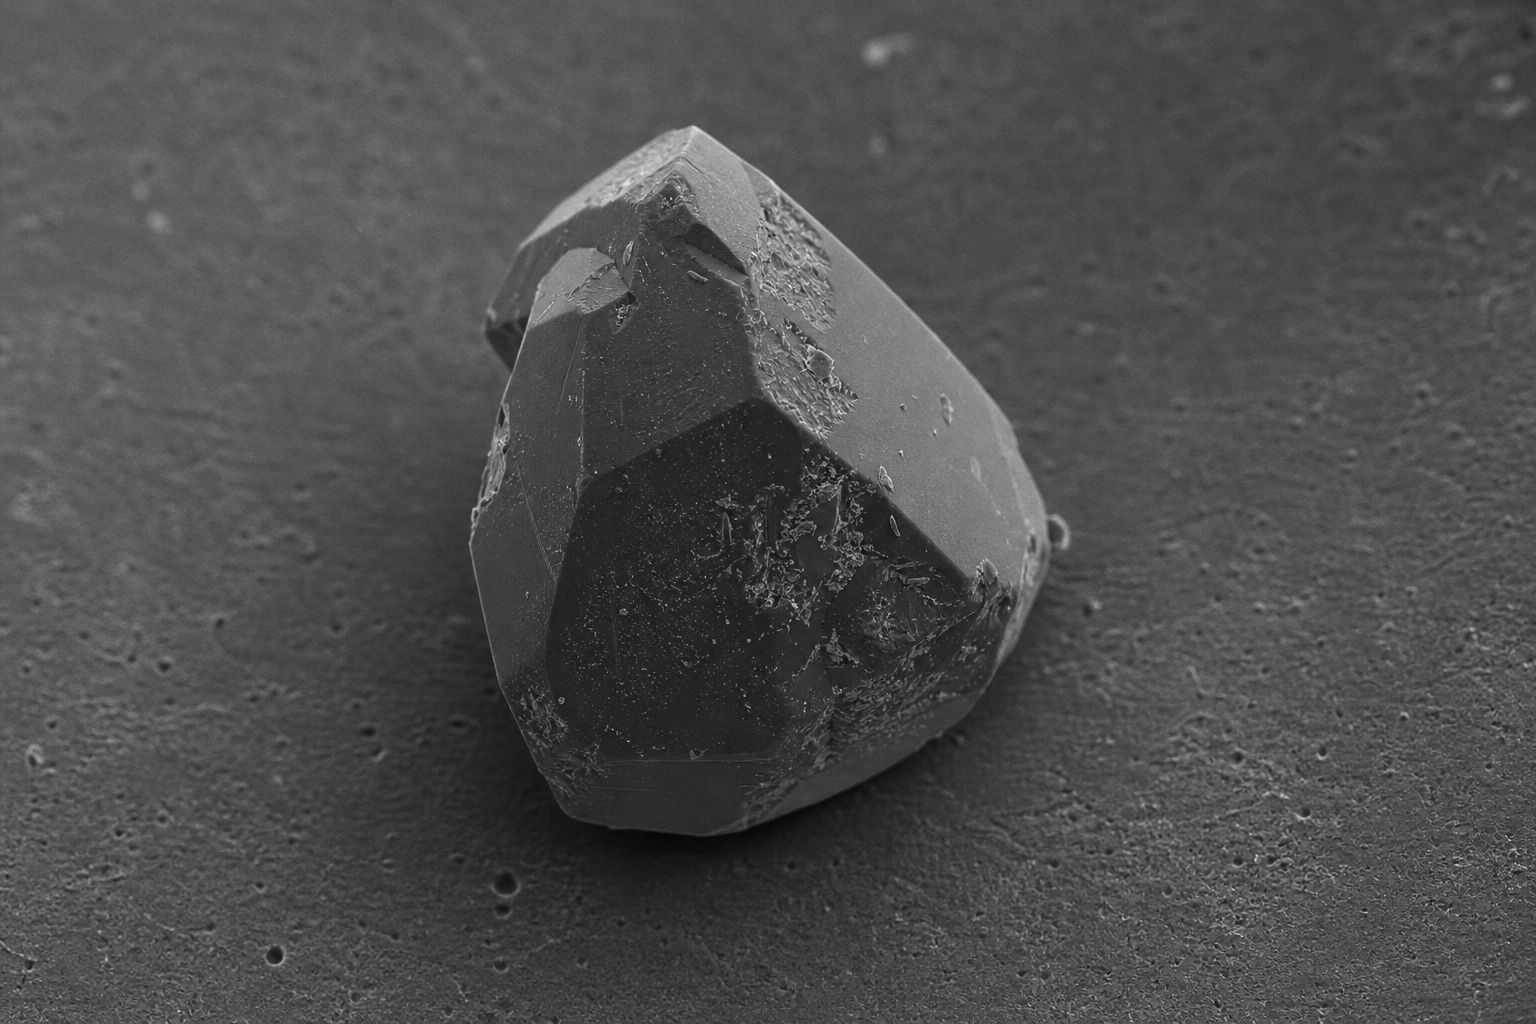
Specks of fuel from a reactor that exploded in 1986.
Six specks of dust from the forest around Chernobyl, in Ukraine, each narrower than a human hair, are pieces of nuclear fuel. In October 2026, scientists in Germany reported what is inside them.
Forty years after the reactor exploded, the fuel inside them had kept much of its crystal structure, more stable than many expected.
How did the fuel of a reactor end up as dust in a forest? To find out, we go back to a spring night in 1986.
6
particles, from two places
8–50 µm
across (a micrometre is 1/1000 mm)
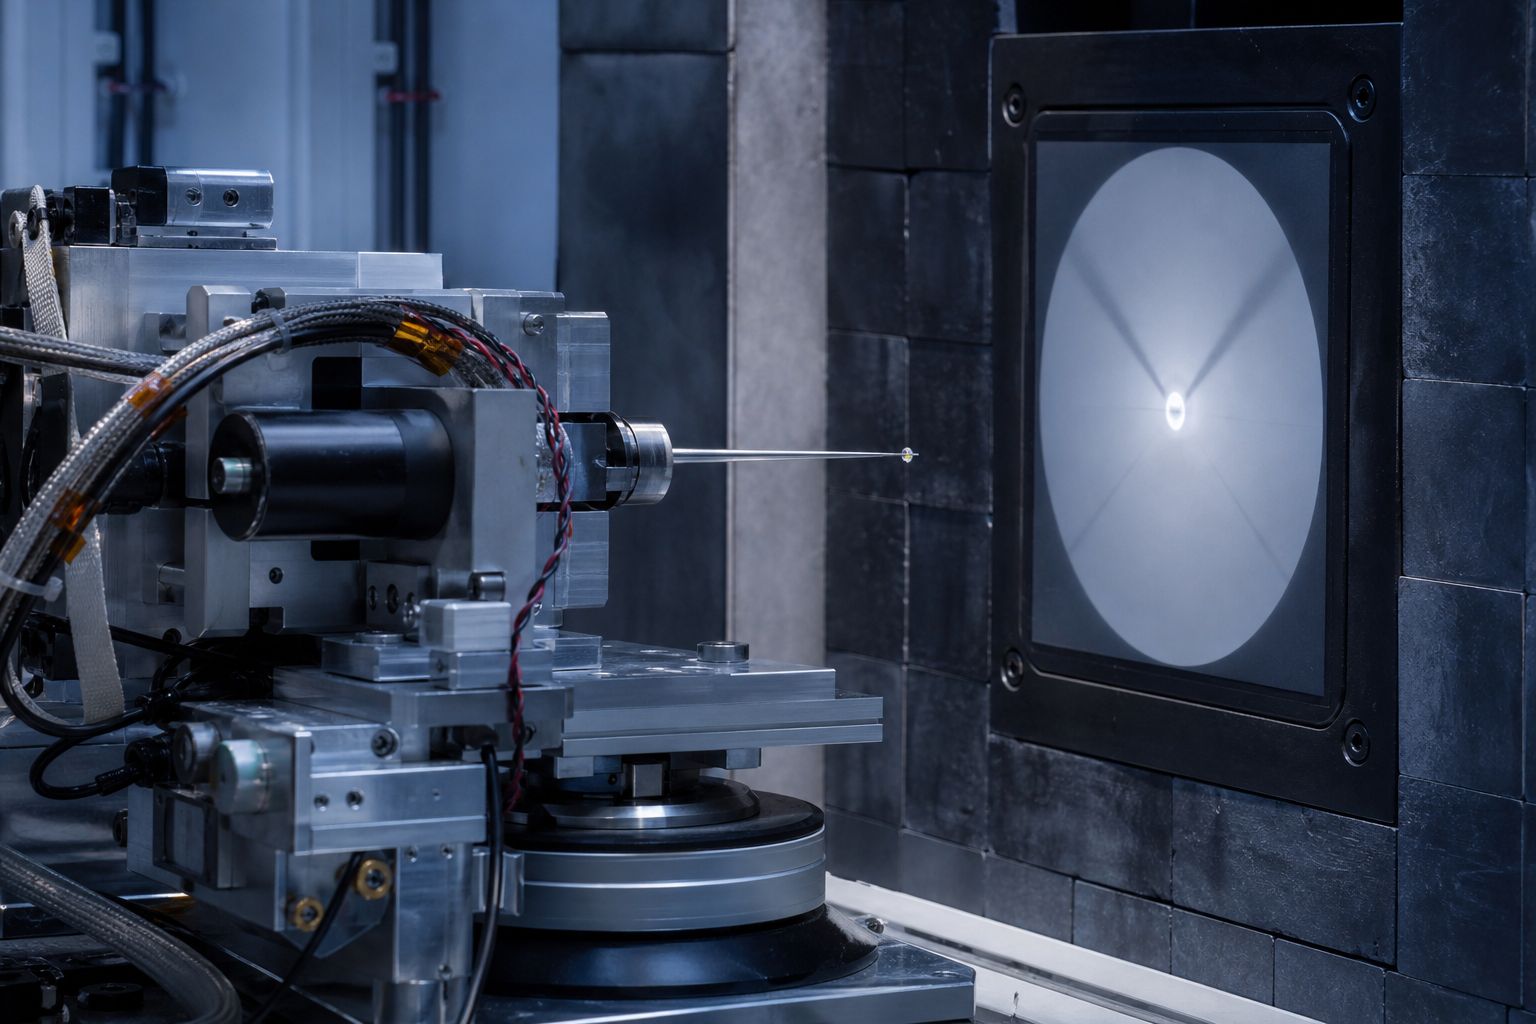
The specks (HZDR, Leibniz University Hannover)A synchrotron beamline (a giant X-ray source) A tiny sample on a needle, in front of an X-ray detector. AI-generated still.
26 Apr 1986
Unit 4, Chernobyl, Soviet Ukraine
The accident
Prologue
Forty-year-old fuel
ScienceDaily (22 October 2026), from Helmholtz-Zentrum Dresden-Rossendorf (HZDR): a team from HZDR and Leibniz University Hannover analysed six radioactive “hot particles”, 8 to 50 micrometres across, recovered from two places in the Chornobyl region, using X-ray diffraction at the Rossendorf Beamline in Grenoble; the study is in the Journal of Hazardous Materials (2026). Despite about 40 years in the environment, the fuel in these particles kept much of its original crystal structure, suggesting some Chornobyl debris is more chemically stable than previously thought. Each particle had a different structure, so the sample is too small to describe the whole contaminated region; the authors stress that the results do not mean the contamination is becoming harmless and give no basis for lifting restrictions on the Exclusion Zone.
Chornobyl is the Ukrainian spelling, used by the researchers; this film uses the older, more familiar English spelling.
The 3D reactor, atoms, crystal and arch are simplified teaching models, not to scale; the map and the path of the cloud are schematic.
The Chernobyl plant, in Soviet Ukraine, had four reactors of a Soviet type called the RBMK. In a reactor, uranium atoms split, and the neutrons they release split more atoms: a chain reaction that gives off heat.
In an RBMK, blocks of graphite slow the neutrons down so they split uranium more easily. Water flows through the core in pipes to carry the heat away, and boils into steam that drives the turbines.
Control rods, which soak up neutrons, are pushed in or pulled out to set the power. Try moving them.
A neutron splits a uranium-235 atom
The split releases heat and more neutrons
Those neutrons split more atoms
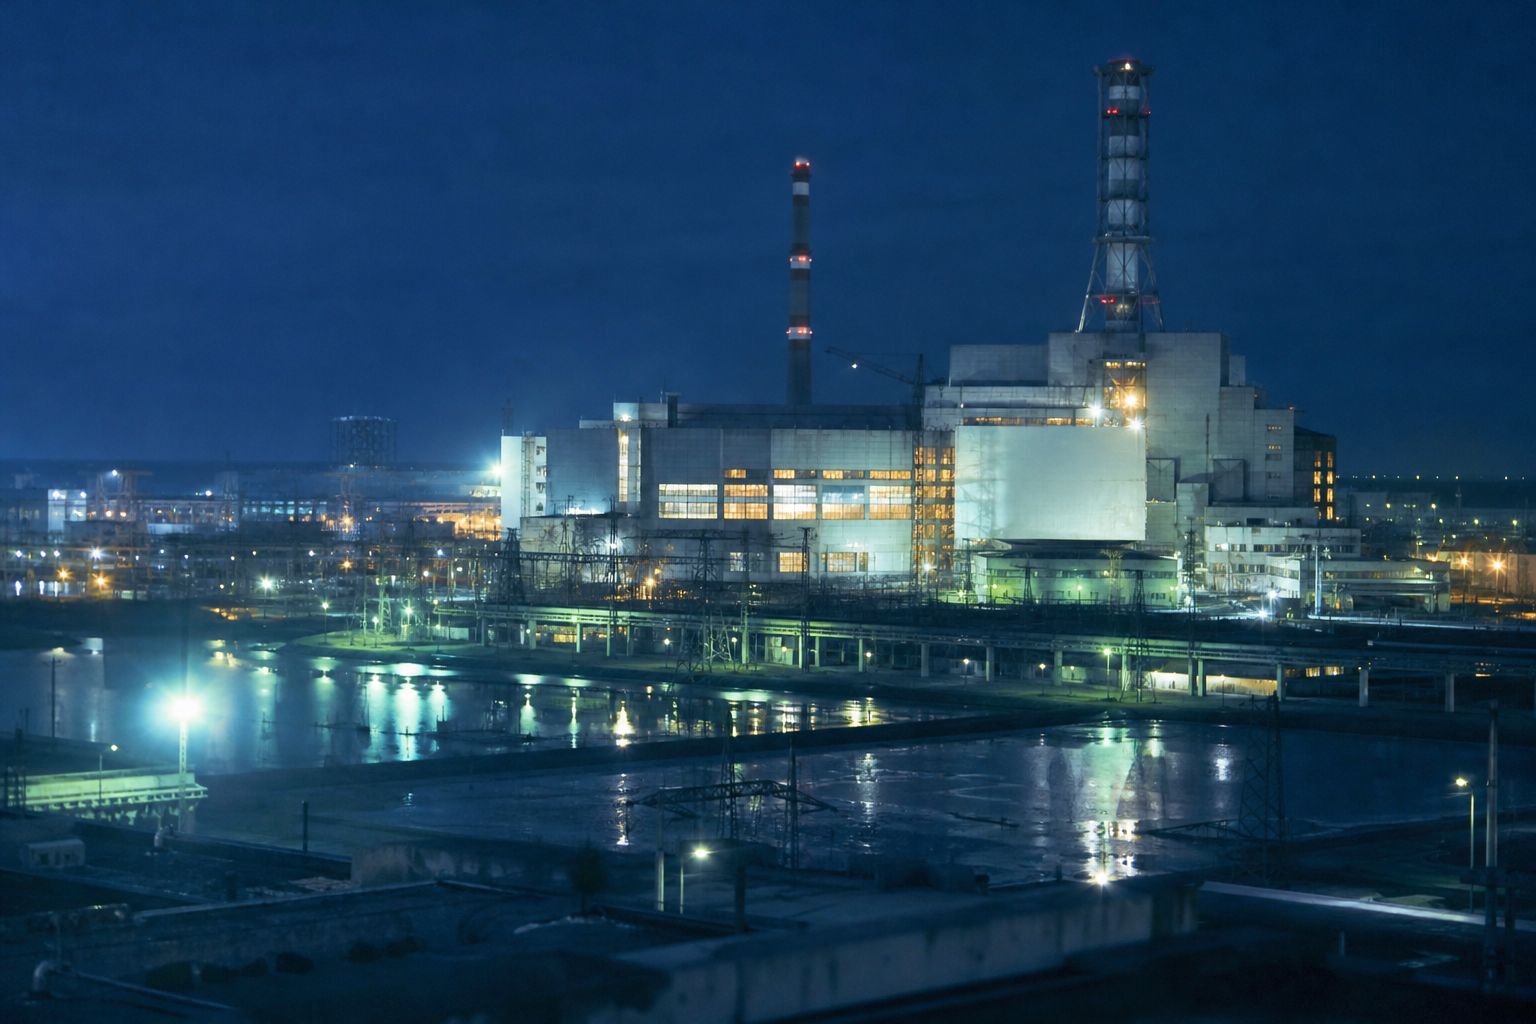
A chain reactionA nuclear power station Turbine halls, chimneys and a cooling pond, at night. AI-generated still.
graphite
slows the neutrons (moderator)
water
cools the core, makes steam
~2%
uranium-235 in the fuel
Unit 4: an RBMK-1000 (WNA)
211
rods that absorb neutrons when lowered
Control rods (OECD NEA)
Chapter I · A Soviet reactor
How an RBMK works
World Nuclear Association: Unit 4 was an RBMK-1000, a Soviet graphite-moderated, water-cooled, pressure-tube boiling reactor fuelled with uranium enriched to about 2% U-235. The graphite moderator slows neutrons; the water is the coolant and also produces the steam for the turbines. OECD Nuclear Energy Agency: the reactor had 211 control rods, which absorb neutrons when lowered and so reduce the rate of fission.
Try it: the readout’s power is a schematic, not a simulation of a real RBMK.
The 3D reactor, atoms, crystal and arch are simplified teaching models, not to scale; the map and the path of the cloud are schematic.
The RBMK had a dangerous quirk. Water also soaks up some neutrons. When the water boils into steam, there is less of it to absorb them, so more neutrons are free to split more atoms.
More splitting means more heat, more steam, and still more splitting. Engineers call this a positive void coefficient, the voids being the steam bubbles. Below about a fifth of full power, it could take over and make the reactor unstable.
Switch between water and steam, and watch the power.
Carries heat away
Also absorbs some neutrons
Steam absorbs far fewer
Water in the core
More steam → more free neutrons
More neutrons → more fission and heat
More heat → more steam
A loop that feeds itself
< ~20%
of maximum power: unstable, prone to surges
Where it takes over (OECD NEA)
power falls
when water turns to steam: a basic safety feature
Most Western reactors (WNA)
Chapter I · A Soviet reactor
The positive void coefficient
OECD Nuclear Energy Agency: steam production in the fuel channels rises when power increases or water flow decreases; neutrons that the water would have absorbed then cause more fission. At power below about 20% of maximum this effect dominates, making the reactor unstable and prone to power surges. World Nuclear Association: the RBMK can have a positive void coefficient, so that more steam bubbles increase reactivity; in Unit 4 this effect overwhelmed all others.
Try it: white dots are steam bubbles; the power figure is schematic.
The 3D reactor, atoms, crystal and arch are simplified teaching models, not to scale; the map and the path of the cloud are schematic.
On the night of the twenty-fifth to the twenty-sixth of April 1986, the operators of Unit 4 were running a test. If the power supply failed, could the turbines, still spinning, keep the cooling pumps running for a while?
During the run-up, by mistake, the power fell to about thirty megawatts. To bring it back, the operators pulled out many control rods, and steadied the reactor at about two hundred megawatts, with automatic shutdown systems switched off.
It was exactly the low-power state in which the steam quirk was strongest.
turbines → pumps
could a spinning turbine power the pumps after a power loss?
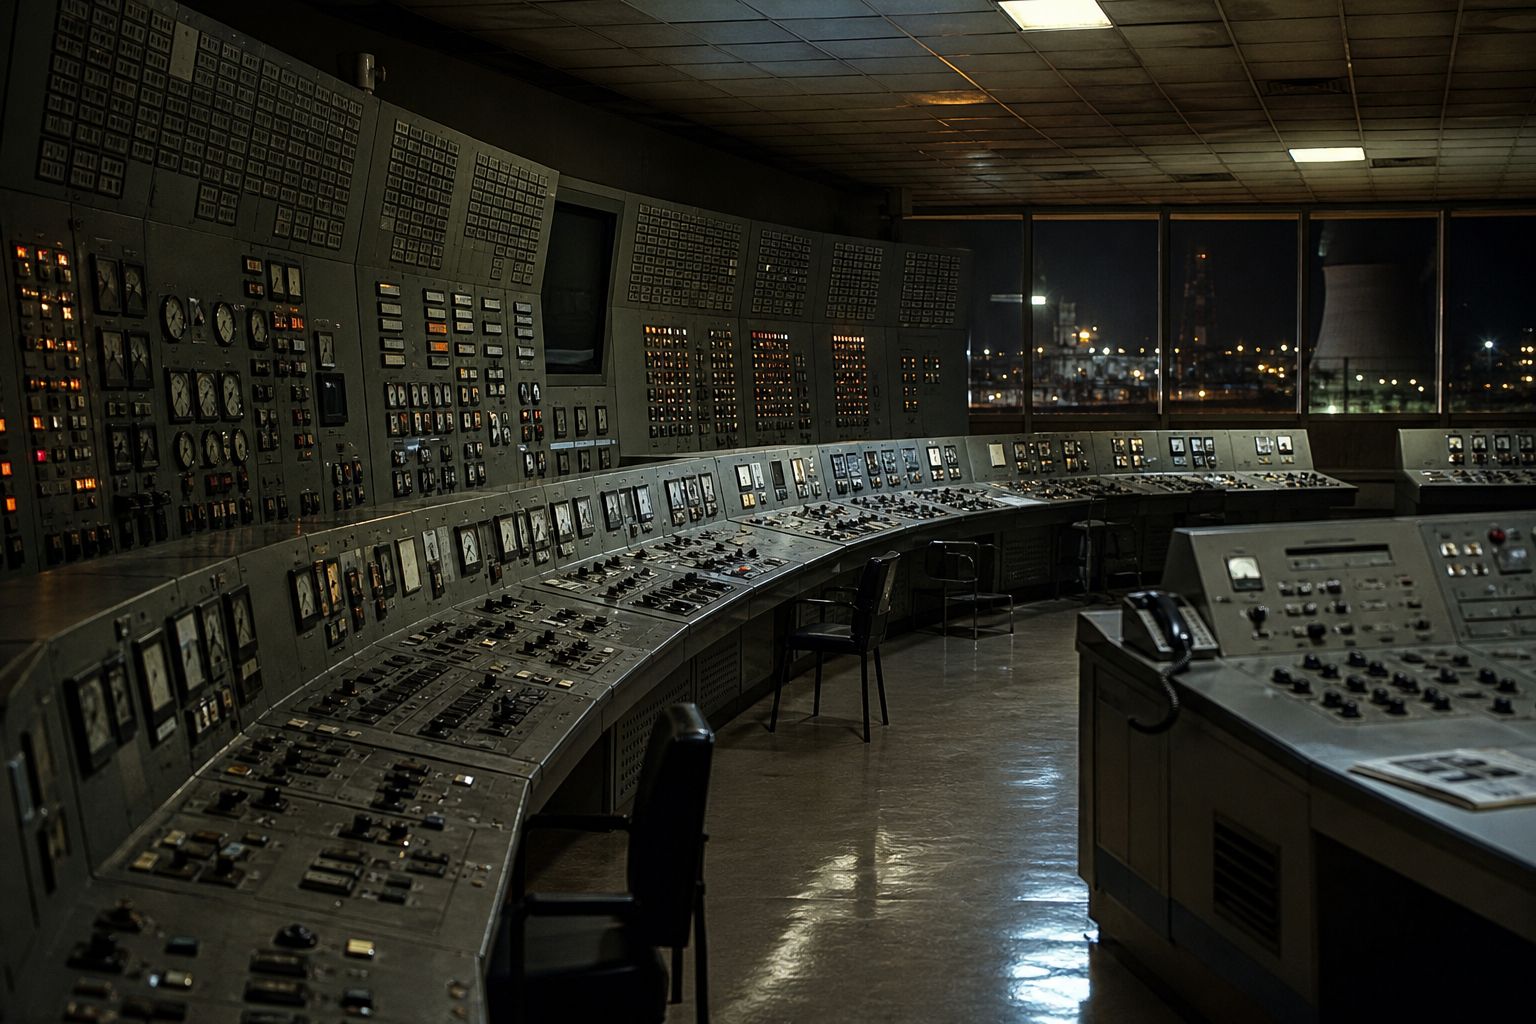
The test (WNA)A control room Panels of dials and switches, of the kind used in Soviet plants. AI-generated still.
Fell to, by error
~30
Steadied at, ~01:00
~200
Thermal power (OECD NEA)
Low power: the steam effect dominant
Many rods withdrawn
Automatic shutdowns disabled
The state of Unit 4
Chapter II · The night of 26 April
The test
World Nuclear Association: preparations began on 25 April 1986 and the test was attempted early on 26 April; it was to check how long the turbines would keep spinning and powering the main circulating pumps after a loss of main electrical power. Operator actions, including disabling automatic shutdown mechanisms, left the reactor in an extremely unstable state. OECD Nuclear Energy Agency: through operator error, power fell to about 30 MW (thermal); operators then withdrew control rods to raise it, and the reactor was stabilised at about 200 MW around 01:00. At such low power the positive void coefficient dominated.
The 3D reactor, atoms, crystal and arch are simplified teaching models, not to scale; the map and the path of the cloud are schematic.
At twenty-three minutes past one, the test began, the flow of cooling water fell, steam grew, and the power started to climb. The rods were driven in to stop it. But their tips were graphite: as each rod began to fall, it pushed water out of the bottom of the core, and added power instead.
Fuel shattered, steam pressure lifted the thousand-tonne cover plate of the reactor, and two explosions, seconds apart, destroyed the core and the roof. Two workers died that night.
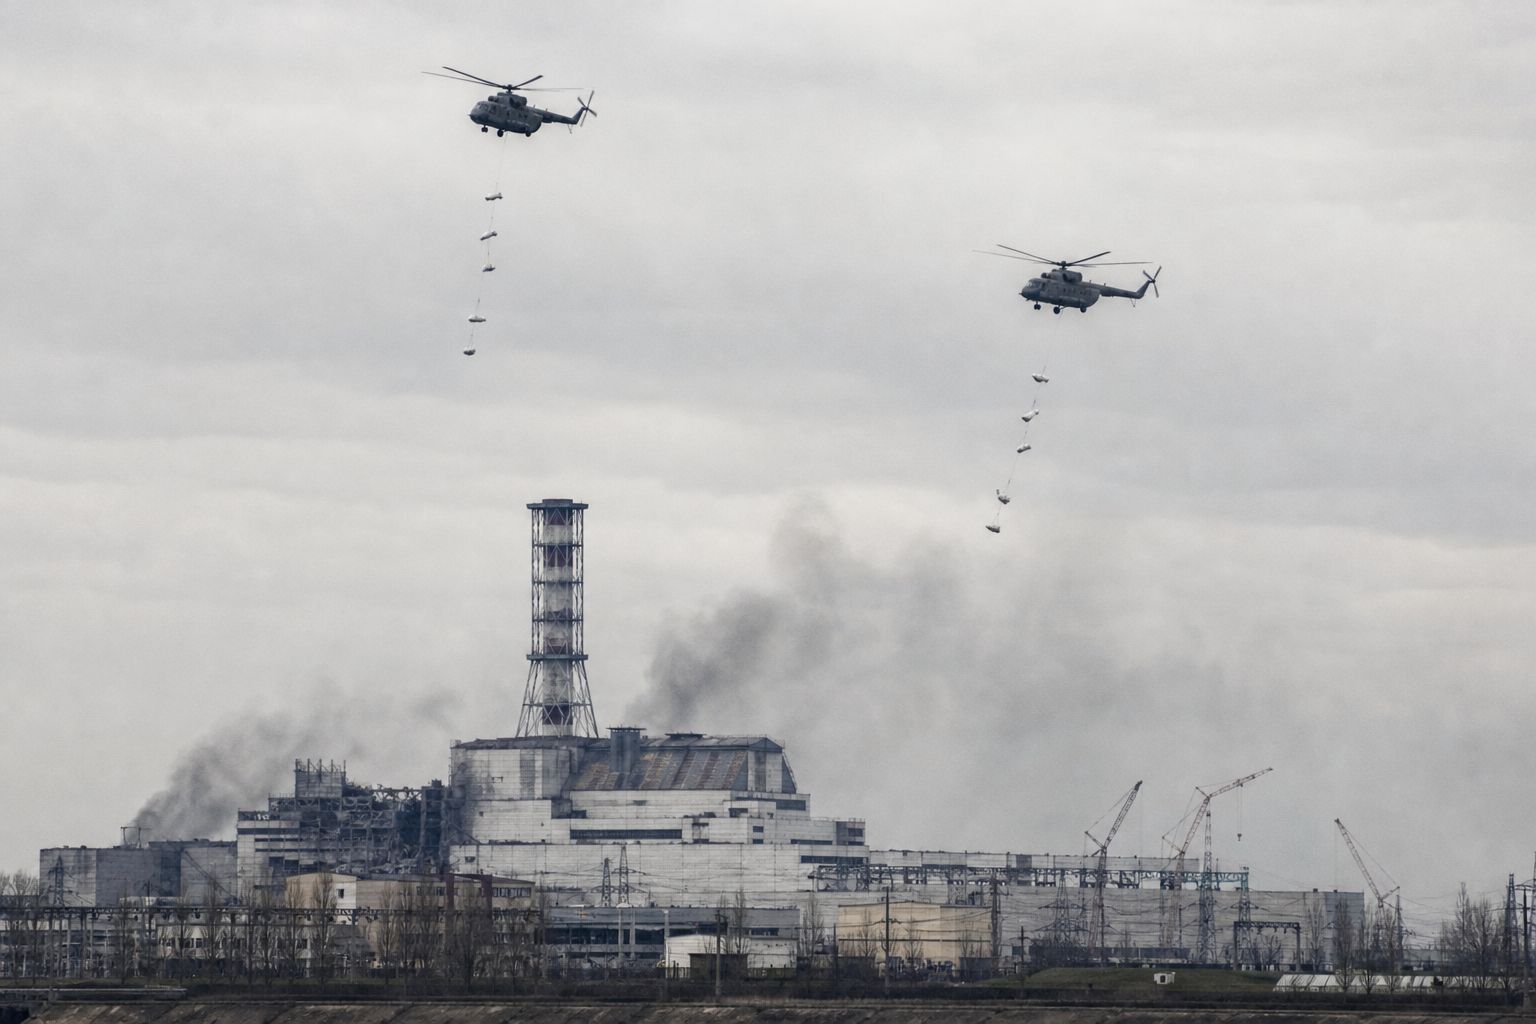
Fires broke out, and for about ten days radioactive material poured into the air, while helicopters dropped some five thousand tonnes of sand, clay, lead and boron onto the ruin.
~01:00 Reactor steadied at ~200 MW
01:23 Test begins; power surges; rods driven in
seconds later Two explosions, 2–3 s apart
26 April 1986
Each rod had a graphite section at its tip
Falling in, it pushed water out of the bottom
Power rose before the rods could cut it
Graphite tips (WNA)
1,000 t
cover plate partly lifted off
2
workers killed that night
The explosions (WNA)
~10 days
of large releases into the air
~5,000 t
sand, clay, lead, boron dropped, days 2–10
The release (WNA)From the air Helicopters dropping material onto the damaged building. AI-generated still.
Chapter II · The night of 26 April
Two explosions
OECD Nuclear Energy Agency: at 01:23 on 26 April 1986 two explosions destroyed the Unit 4 core and the roof of the reactor building; reduced coolant flow worsened the surge. The first was probably a steam and hot-fuel explosion; hydrogen may have contributed to the second, two to three seconds later. World Nuclear Association: a peculiarity of the design of the control rods caused a dramatic power surge as they were inserted; fuel fragmented, rapid steam production raised the pressure, the 1,000-tonne cover plate partly detached and the rods jammed about halfway down. Two workers died from the explosions. World Nuclear Association, RBMK appendix: as a control rod falls, the water at the lower part of the channel is replaced by the bottom of the rod’s graphite displacer, initially adding reactivity to the bottom of the core (the “positive scram effect”); after the accident the rods were retrofitted. Large quantities of radioactive material were released for about ten days, and from day 2 to day 10 about 5,000 tonnes of boron, dolomite, sand, clay and lead were dropped by helicopter.
Try it: “replay” runs the surge again; the timing and the blast are schematic.
The 3D reactor, atoms, crystal and arch are simplified teaching models, not to scale; the map and the path of the cloud are schematic.
What escaped was not one substance but many. All of the reactor's xenon gas came out, about half of its iodine and caesium, and at least five percent of the rest of the core.
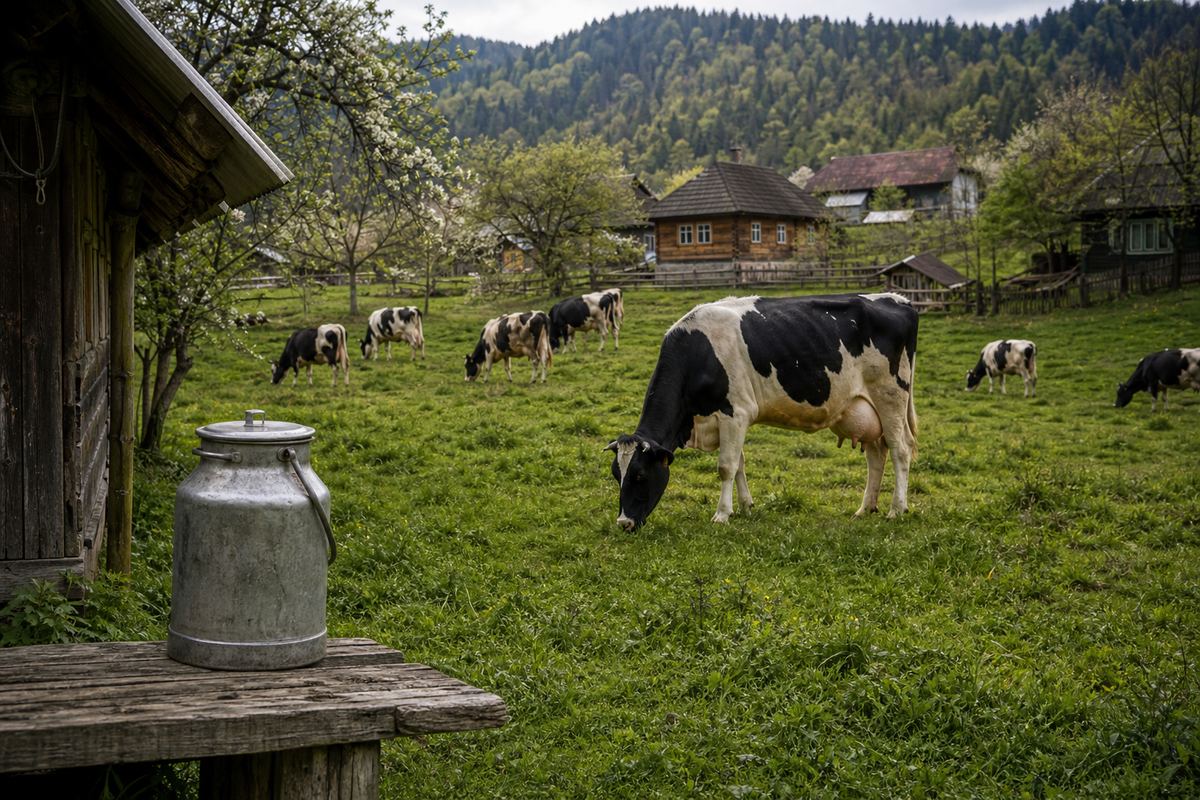
Each radioactive kind of atom decays at its own pace. Half of any amount of iodine-131 is gone in eight days. But while it lasted, it fell on grass, passed into cows' milk, and gathered in the thyroid glands of those who drank it, especially children.
Caesium-137 is far slower: half of it decays in thirty years. Forty years on, about two fifths of what fell is still there. Move the clock forward.
all
of the xenon gas
~½
of the iodine and caesium
≥ 5%
of the rest of the core
Released (WNA)
8 days
iodine-131
2 years
caesium-134
30 years
caesium-137
Half-lives (WHO)From grass to milk Children received higher doses: they drink more milk and have smaller thyroids (WHO). AI-generated still.N=N0(21)t/T
T
half-life (30 years for caesium-137)
t=40
years: (½)^(40/30) ≈ 0.40
What is left after time t
Chapter III · What came out
Half-lives
World Nuclear Association: all of the xenon gas, about half of the iodine and caesium, and at least 5% of the remaining radioactive material in the core were released. WHO: iodine-131 has a half-life of eight days, caesium-134 two years and caesium-137 30 years. Iodine-131 can be transferred to humans rapidly through the air and by consumption of contaminated milk, and becomes localised in the thyroid gland; children usually received higher doses because they drink more milk and have smaller thyroids. With a 30-year half-life, (½)^(40/30) ≈ 0.40: about two fifths of the caesium-137 deposited in 1986 remains in 2026, before any losses to soil, water or clean-up.
Try it: each dot is a radioactive atom; dim dots have decayed. The proportions follow the half-lives; the number of dots is schematic.
The 3D reactor, atoms, crystal and arch are simplified teaching models, not to scale; the map and the path of the cloud are schematic.
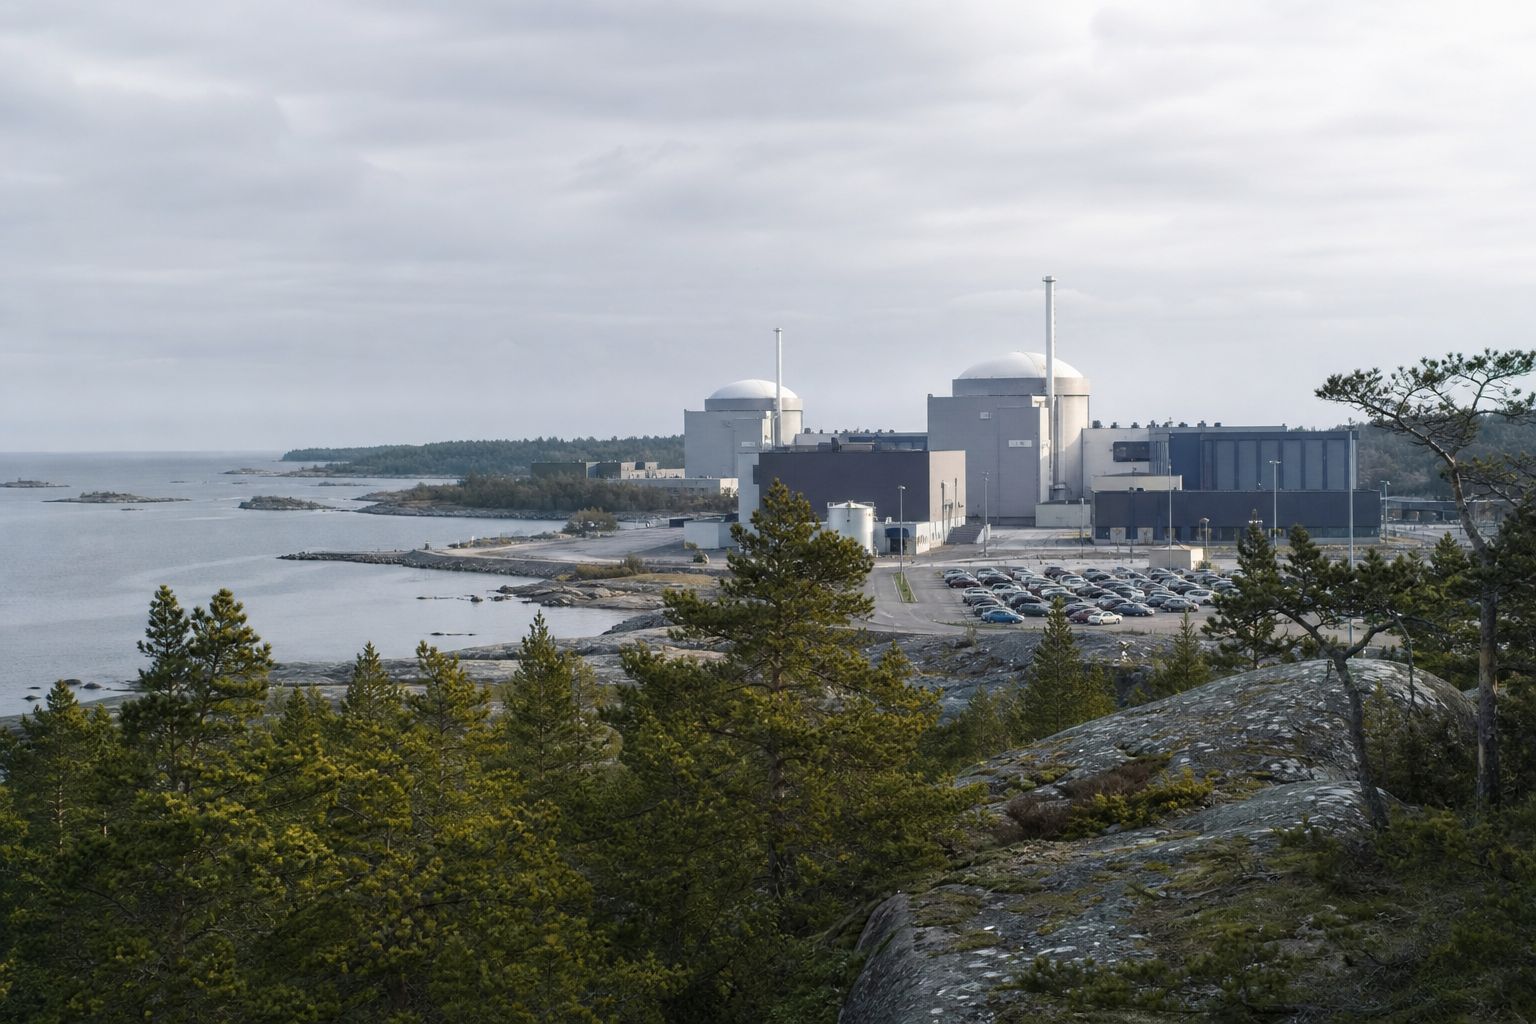
The winds carried the cloud far beyond the Soviet Union. Two days after the explosion, radiation monitors at the Forsmark nuclear plant in Sweden, over a thousand kilometres away, picked it up.
That forced the Soviet government, which had kept silent for two days, to admit that an accident had happened.
The worst contamination fell on Belarus, Russia and Ukraine. As late as 2011, the World Health Organization reported that in a few areas there, milk could still exceed the action level for caesium.
Forsmark, Sweden A nuclear plant on the Baltic coast, of the kind that first raised the alarm. AI-generated still.
> 1,000 km
from Chernobyl to Forsmark
2 days
of Soviet silence
First detected outside the USSR, 28 April
Belarus: Gomel and Mogilev regions
Russia: Bryansk region
Ukraine: Zhytomyr and Rivne regions
Most affected (WHO)
100 Bq/kg
becquerels: radioactive decays per second, per kg
Action level for caesium-137 in milk (WHO, 2011)
Chapter IV · Across borders
The cloud crosses borders
Wikipedia, Forsmark Nuclear Power Plant: radiation monitors at Forsmark, over 1,000 km away, were the first outside the Soviet Union to detect the elevated radiation from Chernobyl, forcing the Soviet government to acknowledge the disaster publicly after two days of trying to cover it up. Sveriges Radio: Forsmark detected the radiation on the morning of Monday 28 April, and the Soviet Union acknowledged the accident the same day. WHO (questions and answers dated 2011): the most affected countries are Belarus, the Russian Federation and Ukraine; in some limited areas of high contamination (parts of Belarus’s Gomel and Mogilev regions, Russia’s Bryansk region, and Ukraine’s Zhytomyr and Rivne regions) milk may still exceed the national action level of 100 becquerels of caesium-137 per kilogram.
The drifting cloud on the map shows only the general idea of a plume reaching Sweden; it is not a reconstruction of the real winds or a contamination map. Map: Natural Earth.
The 3D reactor, atoms, crystal and arch are simplified teaching models, not to scale; the map and the path of the cloud are schematic.
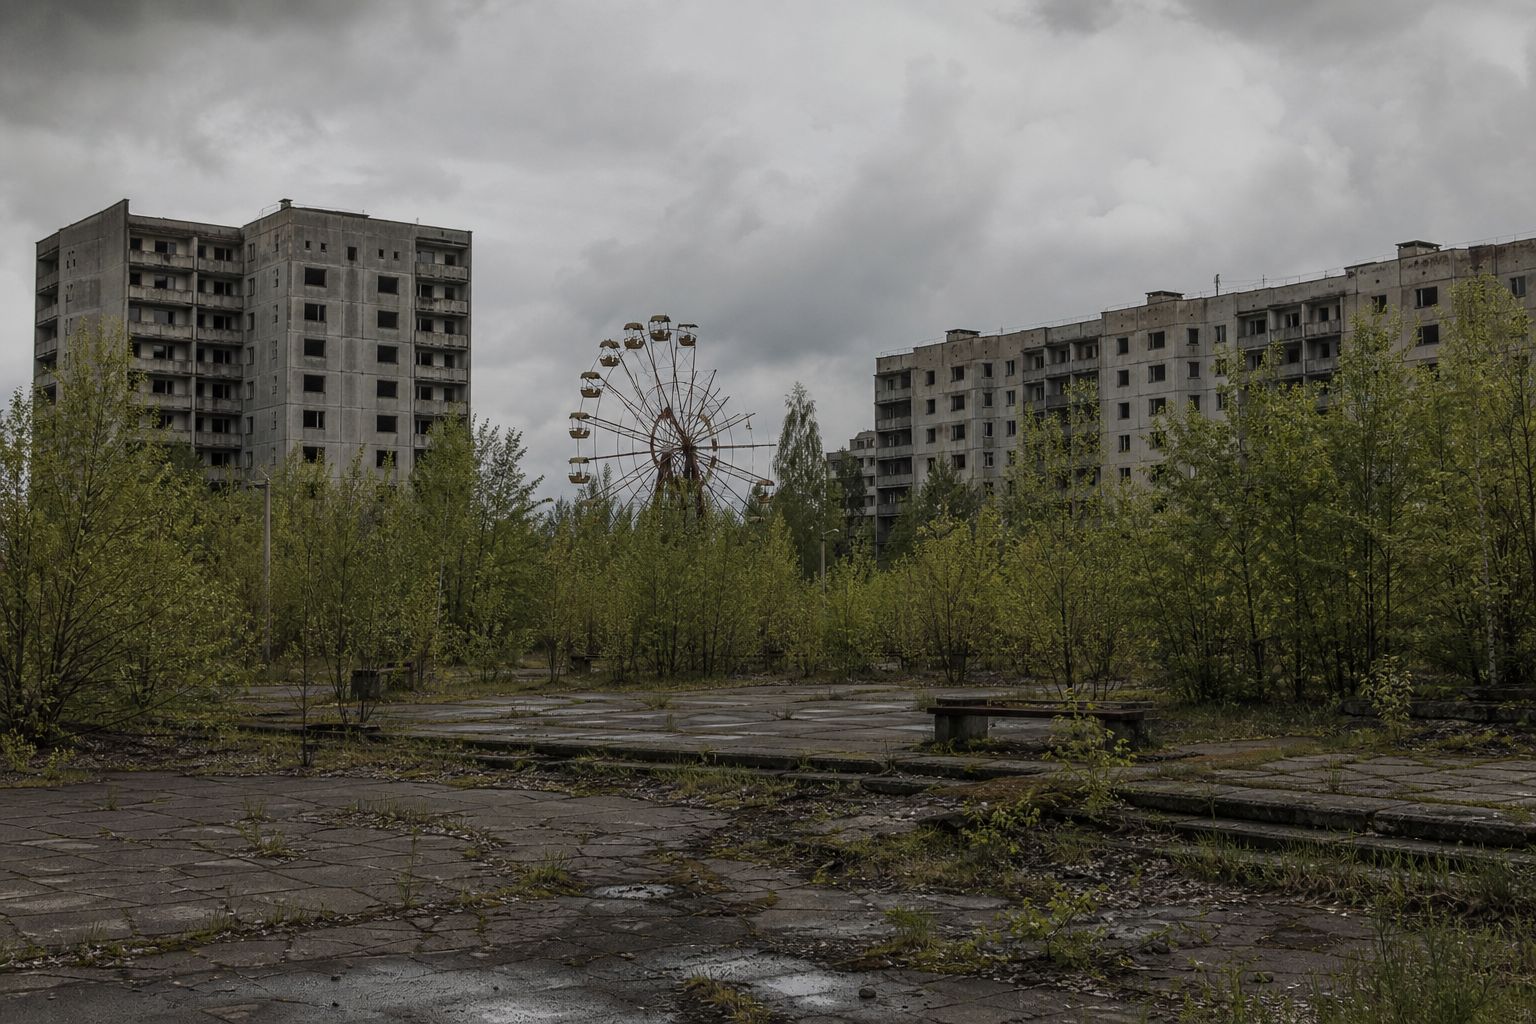
Pripyat, the town built for the plant's workers, with about forty-five thousand people, was evacuated the next day, the twenty-seventh of April.
By the middle of May, about a hundred and sixteen thousand people within thirty kilometres had been moved. In later years, another two hundred and twenty thousand were resettled.
The thirty-kilometre exclusion zone, at first about two thousand eight hundred square kilometres, was later enlarged to four thousand three hundred. Compare the two.
~45,000
people
27 Apr
evacuated
Pripyat (WNA)
Pripyat, 27 April
~45,000
Within 30 km, by 14 May
~116,000
Resettled in later years
~220,000
People moved (WNA)
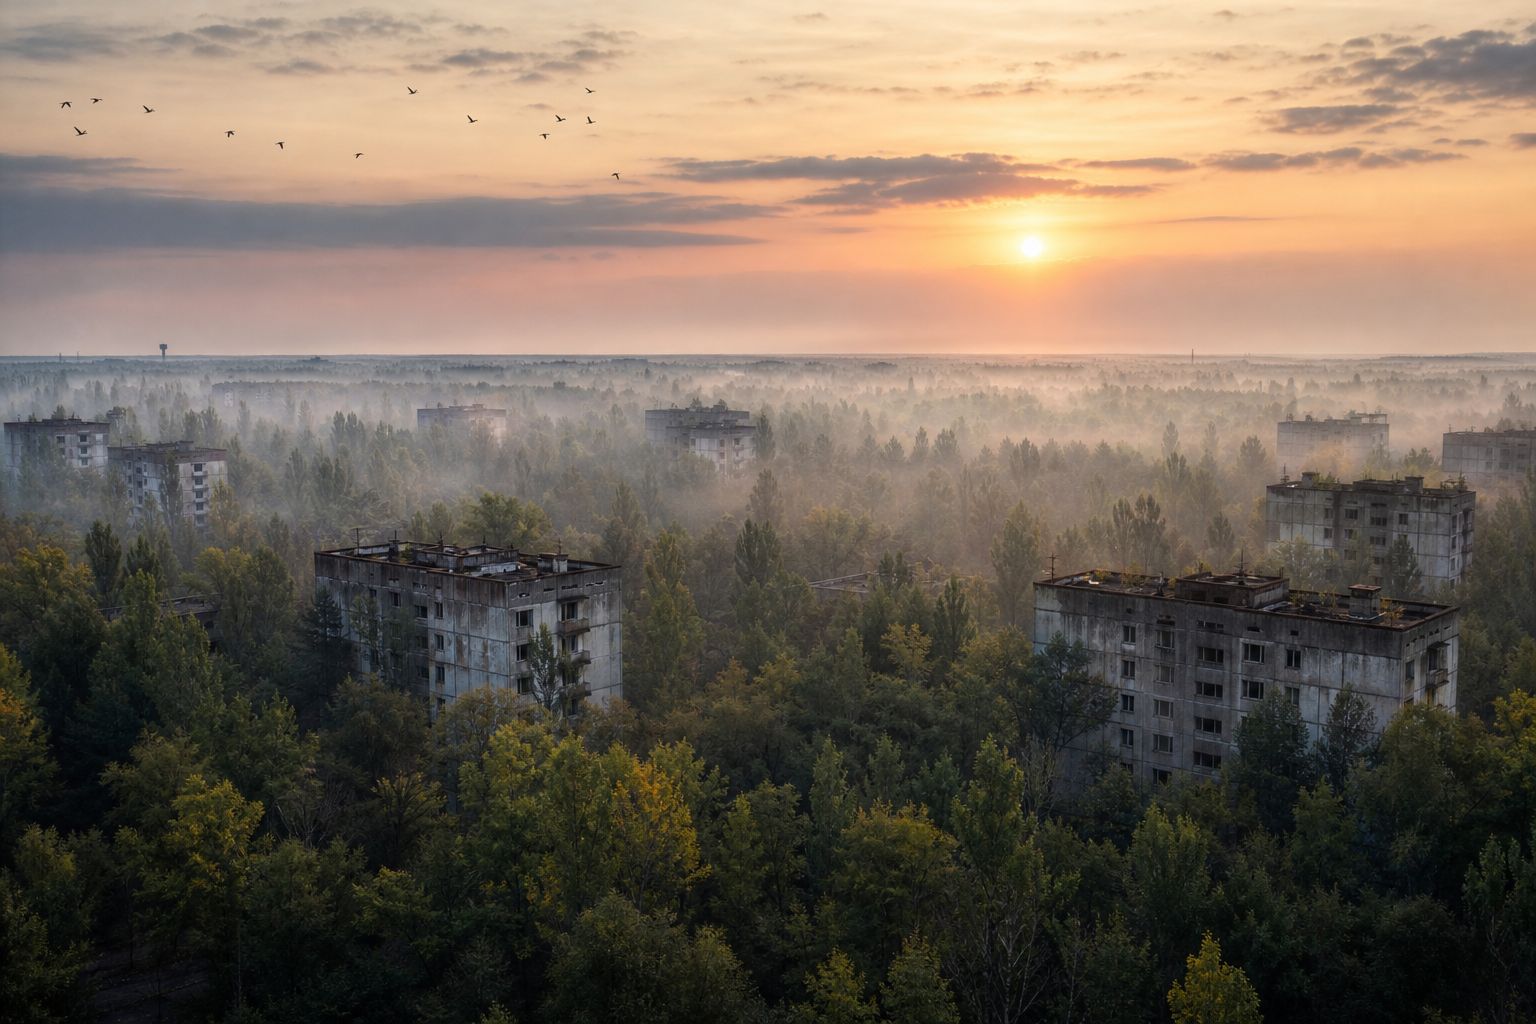
An empty town Trees growing through the squares of an abandoned Soviet town. AI-generated still.
2,800 km²
at first (30 km radius)
4,300 km²
later
The exclusion zone (WNA)
Chapter V · The human toll
Evacuation
World Nuclear Association: Pripyat, with about 45,000 residents, was evacuated on 27 April 1986. By 14 May about 116,000 people living within a 30 km radius had been evacuated and relocated; in later years a further 220,000 people were resettled. The initial 30 km exclusion zone of about 2,800 km² was later expanded to 4,300 km².
Try it: the enlarged zone is drawn as a circle of the same area; its real outline is irregular. Map: Natural Earth.
The 3D reactor, atoms, crystal and arch are simplified teaching models, not to scale; the map and the path of the cloud are schematic.
A hundred and thirty-four workers at the plant developed acute radiation sickness, and twenty-eight of them died within months.
Among people exposed as children or teenagers, more than six thousand thyroid cancers had been found by 2005. The UN's scientific committee reported fifteen of them as fatal.
Over half a million recovery workers came to clean up. How many cancers the accident will cause in the long run can only be estimated. One projection, from the World Health Organization's cancer agency, is about sixteen thousand deaths across Europe by 2065.
Studies also found anxiety twice as common among exposed people as among others.
134
workers with confirmed ARS
28
died within three months
Acute radiation sickness (WHO, WNA)
> 6,000
cases by 2005
15
fatal (UNSCEAR, 2011)
Thyroid cancer, exposed as children (WHO, UNSCEAR)
530,000 recovery workers
120 millisieverts
115,000 evacuees (WHO count)
30 millisieverts
Residents, first 20 years
9 millisieverts
Average dose (WHO)
~25,000
possible extra cancers in Europe to 2065
~16,000
of them possibly fatal
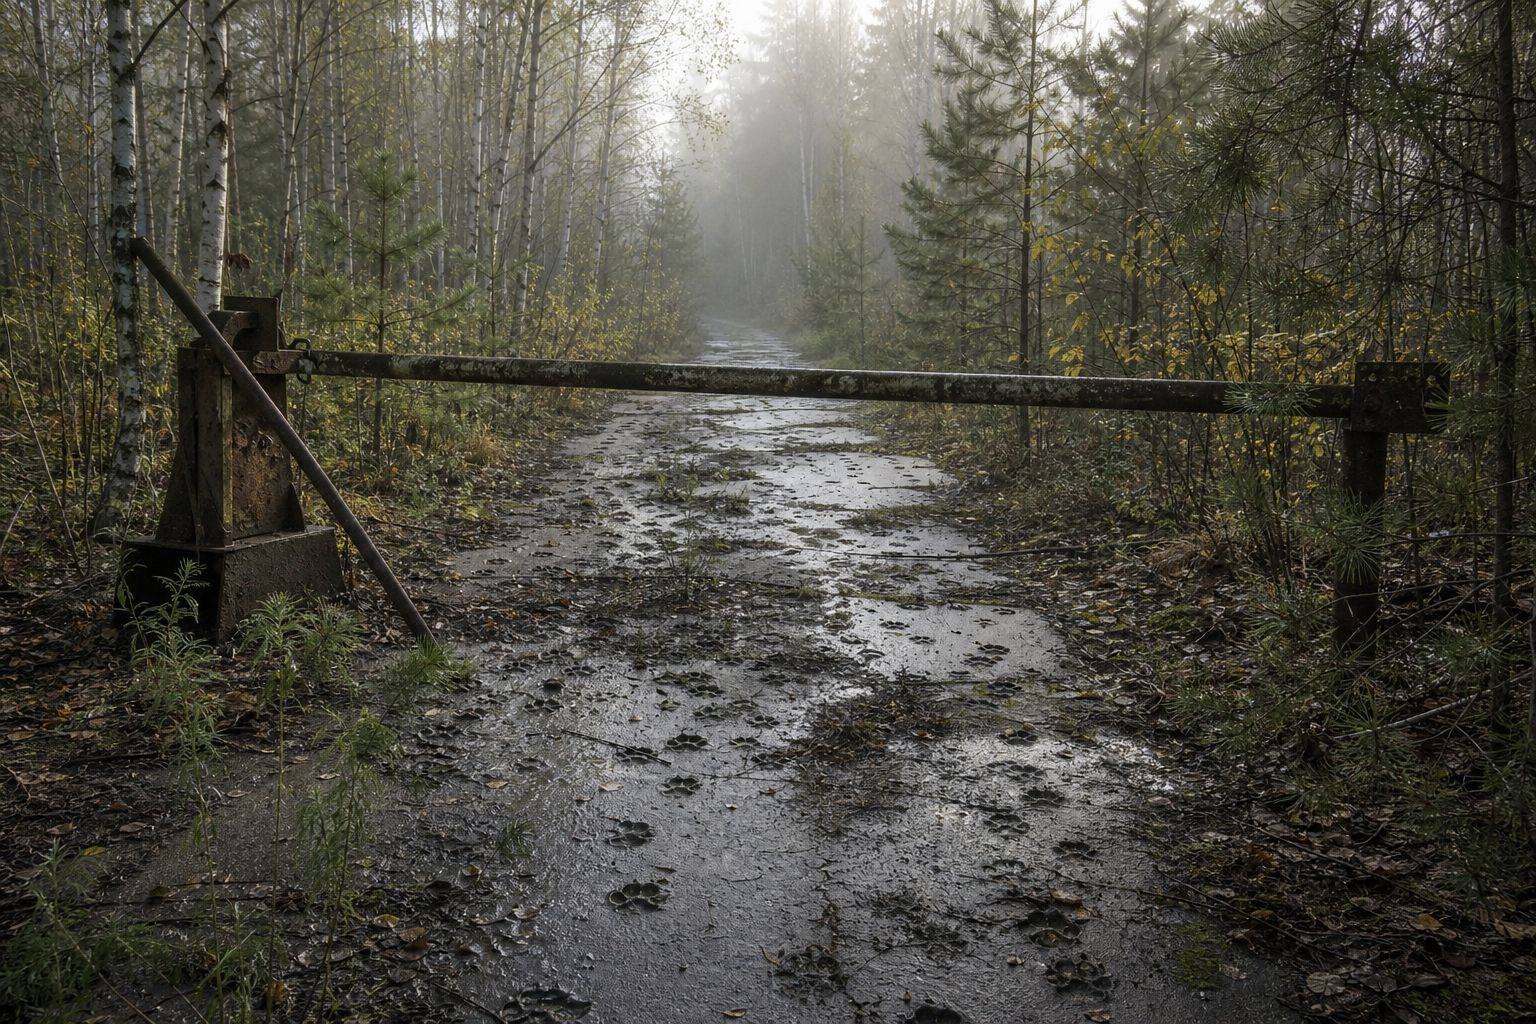
A projection, not a count (IARC, via WHO)The zone’s forests An abandoned road inside the exclusion zone. AI-generated still.
Chapter V · The human toll
The human toll
WHO: of 134 workers who received very high doses and developed acute radiation sickness, 28 died in the first three months. Among those exposed as children or adolescents, more than 6,000 thyroid cancers had been diagnosed by 2005, a large fraction attributable to radioiodine; UNSCEAR (2011) reported 15 of them as fatal. 530,000 registered recovery workers received an average of 120 mSv, 115,000 evacuees 30 mSv, and residents of contaminated areas 9 mSv over the first two decades. The International Agency for Research on Cancer projected about 25,000 excess cancers in Europe by 2065, of which about 16,000 could be fatal. Exposed populations showed anxiety symptoms twice as high as controls in several studies. World Nuclear Association: 19 more workers died between 1987 and 2004, deaths that cannot necessarily be attributed to radiation.
Long-term death figures for Chernobyl are projections from models and are disputed; the film gives the WHO-cited projection and labels it as such. This is general education, not medical advice.
The 3D reactor, atoms, crystal and arch are simplified teaching models, not to scale; the map and the path of the cloud are schematic.
Within seven months, workers built a concrete shell over the ruined reactor, the so-called sarcophagus, meant to last twenty to thirty years. The plant's other reactors kept running. The last one shut down in December 2000.
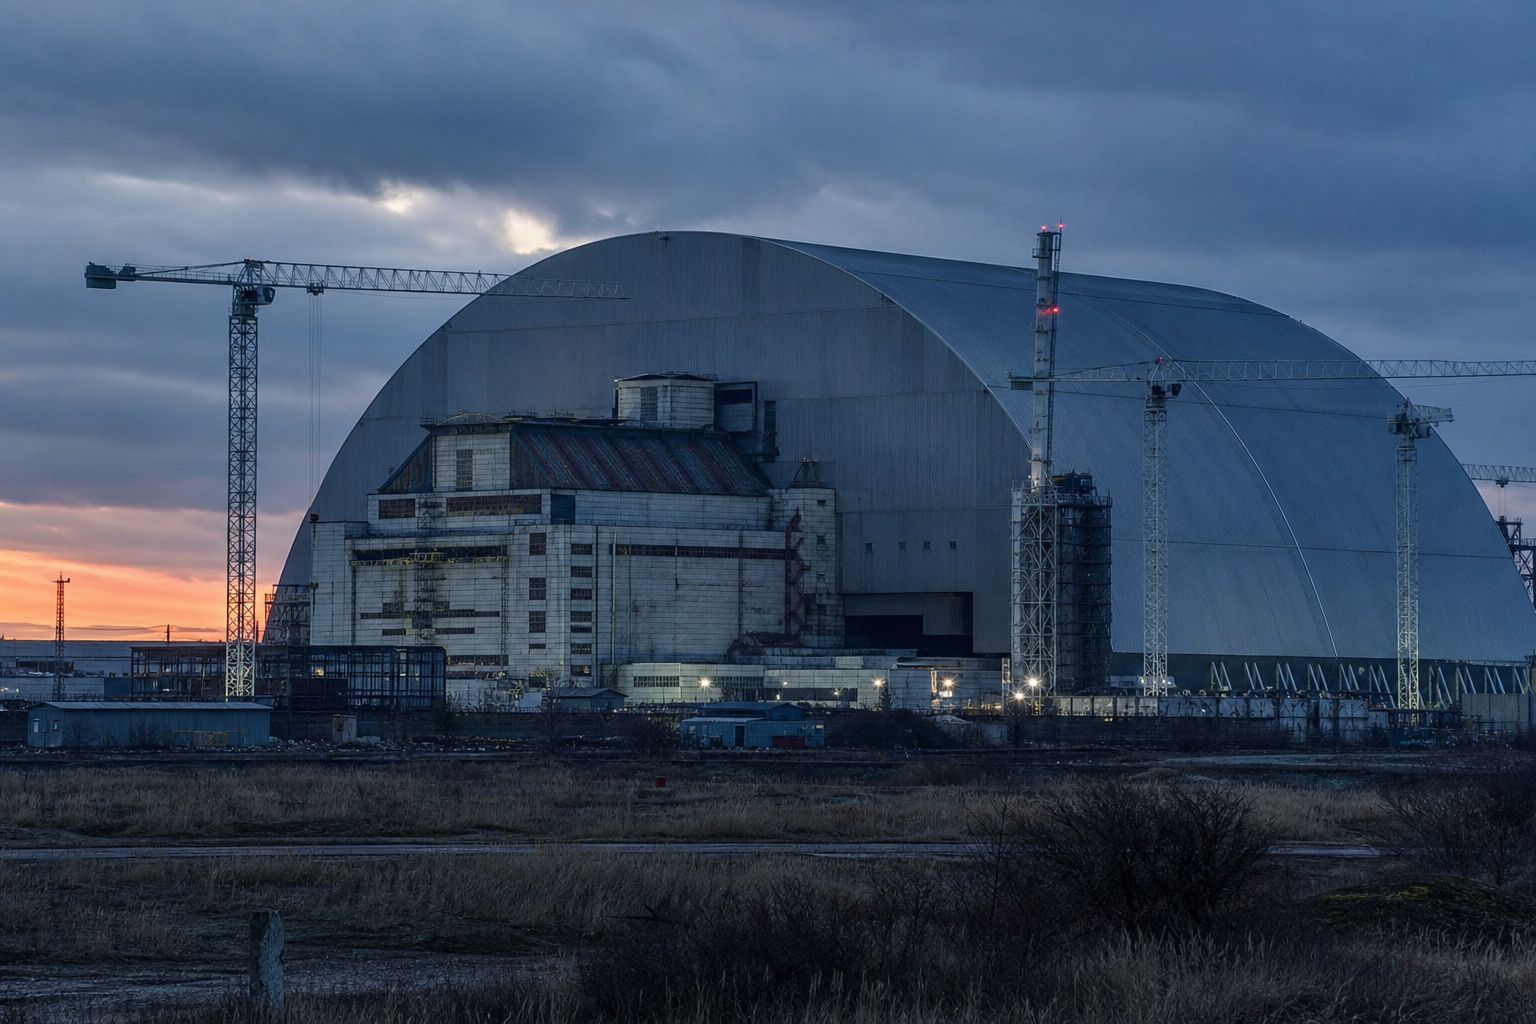
In November 2016, a steel arch, a hundred and ten metres high and weighing thirty-six thousand tonnes, was slid over the old shell. It was designed to last a hundred years. Slide it back and forth.
~7 months
to build, done by October 1986
20–30 yr
design life
The sarcophagus (WNA)
1991 Unit 2 shut after a turbine-hall fire
1997 Unit 1 closed
Dec 2000 Unit 3, the last, shut down
The other reactors (WNA)
110 m
high; 165 m long, 260 m span
36,000 t
in place Nov 2016
100 yr
design life
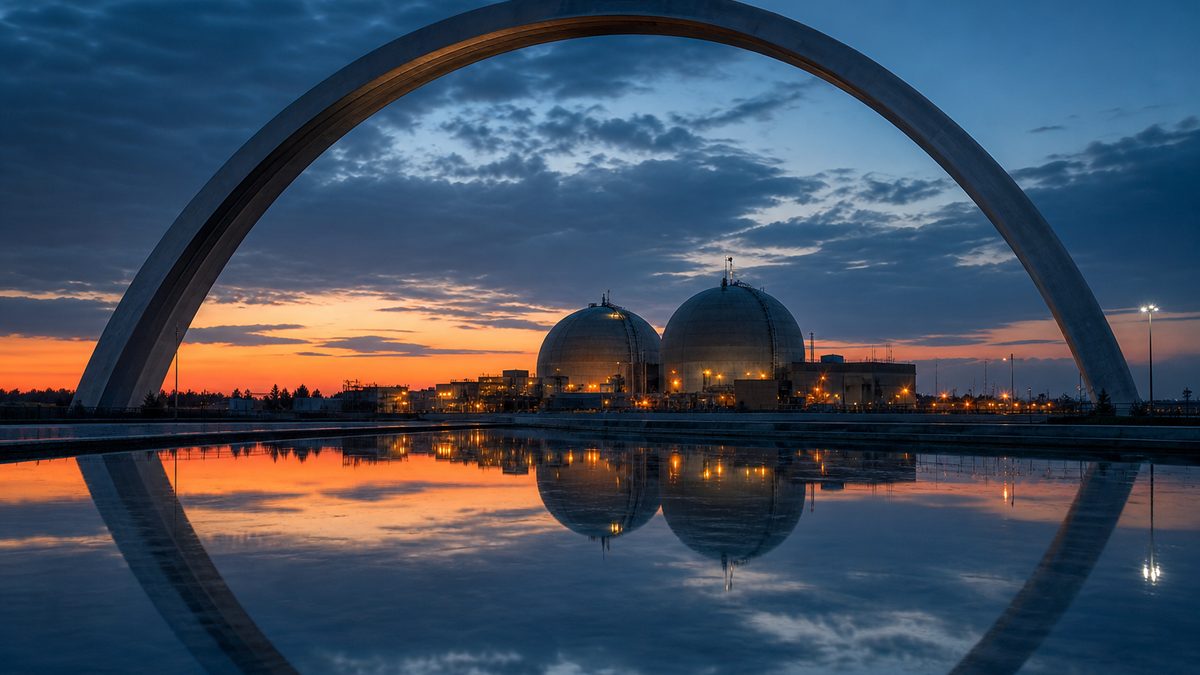
New Safe Confinement (WNA)The arch A steel arch over the old reactor building, at dusk. AI-generated still.
Chapter VI · Covering the ruin
Two covers
World Nuclear Association: a reinforced-concrete shelter, the “sarcophagus”, was built over about seven months and erected by October 1986, designed for a 20–30-year life. Unit 2 was shut down after a turbine-hall fire in 1991, Unit 1 at the end of 1997, and Unit 3, the last Chernobyl reactor, in December 2000. The New Safe Confinement was moved into position in November 2016 and completed in 2017; it is 110 m high, 165 m long, with a 260 m span, weighs 36,000 tonnes and is designed for a 100-year life.
Try it: the arch and buildings are a simplified model, roughly to scale with each other.
The 3D reactor, atoms, crystal and arch are simplified teaching models, not to scale; the map and the path of the cloud are schematic.
On the fourteenth of February 2025, Ukrainian officials said a drone with a high-explosive warhead hit the arch and started a fire. Ukraine blamed Russia. Russia denied it.
Radiation levels stayed normal. But in December 2025, the International Atomic Energy Agency said the arch had lost its main safety function, keeping radioactive material confined, and still needed full repair.
drone
with a high-explosive warhead, per Ukraine
fire
and damaged cladding
14 February 2025 (UN, via Al Jazeera)
Ukraine: Russia carried out the strike
Russia: denies attacking the plant
Two accounts
Primary safety functions lost, including confinement
No permanent damage to load-bearing structures
Radiation levels: normal and stable
IAEA, December 2025
standing
no permanent damage to its load-bearing frame
The arch after the strike (IAEA)
Chapter VI · Covering the ruin
A strike on the arch
Al Jazeera (6 December 2025): the UN reported that on 14 February 2025 Ukrainian authorities said a drone with a high-explosive warhead hit the plant, caused a fire and damaged the protective cladding around reactor No. 4. Ukraine accused Russia; Moscow denied attacking the plant. Radiation levels were reported normal and stable, with no reports of leaks. After an inspection, the IAEA said the structure had lost its primary safety functions, including confinement, but with no permanent damage to its load-bearing structures or monitoring systems; IAEA chief Rafael Grossi said full restoration was still needed.
The damage shown on the model is schematic.
The 3D reactor, atoms, crystal and arch are simplified teaching models, not to scale; the map and the path of the cloud are schematic.
Some of the core flew out not as gas but as solid specks of fuel: hot particles, hot meaning radioactive. Forty years later, these are what the German team studied.
They turned each speck in a fine beam of X-rays and measured it from two thousand angles. The patterns showed three kinds: uranium dioxide fuel, fuel fused with the zirconium metal of its tubes, and fuel oxidised in the ten-day graphite fire.
A speck that keeps its crystal shape can hold its radioactive atoms inside, instead of releasing them into soil and water. But the specks differed, and some may release theirs later. Compare an intact crystal with a weathered one.
A hot particle A microscopic speck of fuel, as an electron microscope might show it. AI-generated still.
~100 µm
X-ray beam
2,000
angles per particle
The method (Rossendorf Beamline, Grenoble)
Fuel-like uranium dioxide
Fuel fused with or enclosed in zirconium
Fuel oxidised (to U₃O₈ and similar) in the graphite fire
Three kinds of particle
Six specks cannot describe the whole region
The contamination is not becoming harmless
No case for lifting the zone’s restrictions
What the team says it does not show
Chapter VII · What is still there
Inside the specks
Interesting Engineering and ScienceDaily: each particle was rotated in an X-ray beam about 100 micrometres wide at the Rossendorf Beamline in Grenoble and measured from 2,000 angles. The particles fell into three broad classes: fuel-like uranium dioxide, fuel fused with or enclosed in zirconium, and fuel oxidised into uranium oxides such as U3O8 when the graphite moderator caught fire and burned for ten days. Their stability may keep fission products inside the fragments and limit their release into soil and water; but each particle had a different structure, and some may retain radionuclides longer and release them later.
Try it: the crystal is a schematic of the uranium dioxide (fluorite-type) lattice; real particles are millions of atoms across.
The 3D reactor, atoms, crystal and arch are simplified teaching models, not to scale; the map and the path of the cloud are schematic.
Forty years on, the iodine is long gone, about two fifths of the caesium remains, and some specks of fuel are still holding on to what they carry.
How long will those specks stay stable? How much of the land can ever be lived on again? And how many lives did the accident really cost? Scientists are still answering, one speck at a time.
26 Apr 1986 Unit 4 explodes
27 Apr 1986 Pripyat evacuated
Oct 1986 Sarcophagus finished
2000 Last reactor shut down
2016 Steel arch slid into place
2026 Hot particles found largely intact
Chernobyl, 1986–2026The zone today Forest closing over an abandoned road. AI-generated still.Pripyat at dawn A town reclaimed by forest. AI-generated still.
Stills are AI-generated
Reactor, atoms and arch are teaching models
The map and the cloud’s path are schematic
About this film
Epilogue · Sources
Sources
Every fact in this film comes from the sources below. Long-term death figures are projections and are labelled as such. After the accident the remaining RBMK reactors were modified, according to the World Nuclear Association. The chapter stills and pictures are AI-generated illustrations; the reactor, the atoms, the crystal and the arch are simplified teaching models; the map uses Natural Earth borders, and the path of the cloud is schematic.