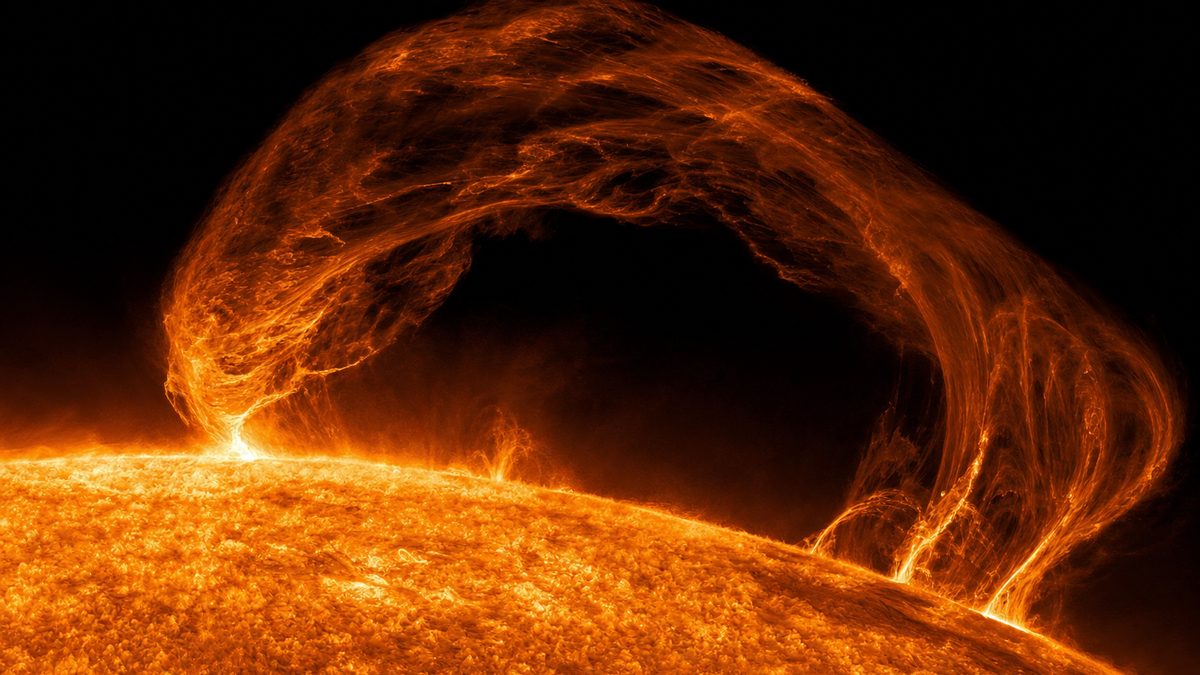
How the Sun makes its light, why it has spots and an 11-year cycle, and how flares, coronal mass ejections and the solar wind light up auroras, pull satellites down and black out power grids on Earth.
Interactive 3D film7 min1859 to 2026Published 2026-10-13
On 10 October a cloud of solar plasma struck Earth’s magnetic field, and the night sky over northern Europe turned green and red.
On the tenth of October 2026, a cloud of magnetised gas from the Sun slammed into Earth’s magnetic field.
Forecasters had watched it leave the Sun two days earlier, from a busy group of sunspots.
The storm reached G3, strong, on NOAA’s five-step scale, and auroras lit up the skies over Britain, Germany and Scandinavia.
To understand what happened, we have to start a hundred and fifty million kilometres away, deep inside the Sun.
Prologue · Why the news matters
A storm from the Sun
On 10 October 2026 a coronal mass ejection (CME) from the Sun reached Earth at about 14:34 UTC. NOAA’s Space Weather Prediction Center recorded a G3 (strong) geomagnetic storm from 17:58 UTC, more than its G2 watch had expected. NOAA linked it to a CME launched on 8 October. The source was sunspot region AR4549, which had also thrown off CMEs on 6 October. Skies were dark over Europe at the peak, so Britain, Germany and Scandinavia saw bright auroras; most of the United States was still in daylight.
Peak storm level
G3 · Kp 7
10 October 2026 (NOAA)
Source
AR4549
several CMEs on 6 and 8 October
Distance the cloud travelled
About 150 million km, from the Sun to Earth, in roughly two days
Its plasma density near Earth jumped tenfold on arrival
The globe shows the auroral oval, the ring of light around Earth’s magnetic pole. Its size and brightness are drawn schematically from the storm level, not from measurements.
How to use: pick a chapter below the scene or press ← → to change step · ▶ plays the step · drag to rotate, scroll or pinch to zoom · “Play the film” runs every step full-screen.
In the Sun’s core, hydrogen fuses into helium. Each second, about 600 billion kilograms of hydrogen are used up.
At the centre of the Sun the temperature is about fifteen million degrees Celsius, and matter is packed eight times denser than gold.
There, hydrogen nuclei, single protons, crash together. They repel each other, but quantum tunnelling lets a few of them fuse.
In three steps, four protons become one helium nucleus. A little mass disappears and turns into energy, as Einstein’s E equals m c squared describes.
The first step is so unlikely that an average proton waits about nine billion years for it. That is why the Sun burns slowly and steadily.
Chapter I · Step 1 · The core
The proton–proton chain
The core reaches from the centre to about a quarter of the Sun’s radius. At about 15 million °C and 150 grams per cubic centimetre, protons collide hard enough to fuse. Classically they should bounce off each other; quantum tunnelling lets a tiny fraction get through. About 99% of the Sun’s energy comes from this proton–proton chain, the rest from the CNO cycle.
¹H + ¹H → ²H + e⁺ + νe · one proton turns into a neutron; a positron and a neutrino fly off. This is the slow step.
²H + ¹H → ³He + γ · deuterium captures a proton and gives off a gamma ray.
³He + ³He → ⁴He + 2 ¹H · two helium-3 nuclei make helium-4 and return two protons.
Energy per helium-4
26.7 MeV
about 2% leaves with neutrinos
Average proton’s wait
~9 billion yr
before step 1 happens to it
Hydrogen fused
~600 billion kg/s
into helium
Mass turned into energy
~4.3 billion kg/s
E = mc²
The animation loops the three steps for one helium nucleus. Particle sizes are not to scale.
The energy made in the core today will not reach the surface for many thousands of years.
The energy made in the core does not simply shine out. In the radiative zone, light is absorbed and re-emitted again and again, in random directions.
NASA estimates this slow escape takes about one hundred and seventy thousand years. Other estimates go as low as ten thousand.
Further out, about seventy percent of the way to the surface, the gas starts to churn. Hot bubbles of plasma rise, cool and sink again: the convection zone.
When the energy finally reaches the surface, it escapes as sunlight, and crosses to Earth in just eight minutes and nineteen seconds.
Chapter I · Step 2 · Inside the Sun
A journey of thousands of years
Between about 25% and 70% of the Sun’s radius, the gas is so dense that light cannot travel far before it is absorbed and sent off again in a new direction. Energy leaks outward in a random walk. Above 70% of the radius, the gas is cool enough to churn: hot plasma rises in huge bubbles, releases heat near the surface and sinks again.
Core · 0 to ~0.25 of the radiusabout 15 million °C; fusion happens here
Radiative zone · ~0.25 to 0.7about 7 million °C falling to 2 million °C; energy moves by radiation
Convection zone · 0.7 to the surfacebelow 2 million °C; energy is carried by rising and sinking plasma
Photosphere · the visible surfaceabout 5,500 °C; sunlight leaves from here
Escape through the radiative zone
~170,000 yr
NASA; published estimates range from about 10,000
Surface to Earth
8 min 19 s
at the speed of light, 1 au
The yellow line is a drawn random walk. A real photon path would have far more, far shorter steps; it is shortened so you can follow it. The cut-away is to scale for the layer boundaries.
The Sun has no solid surface. What we see is a thin layer of glowing gas, covered in boiling cells.
The layer we see is the photosphere. It is not solid: it is gas at about five thousand five hundred degrees Celsius, roughly four hundred kilometres thick.
It is covered in granules, the tops of rising convection cells. Bright centres are hot gas rising; dark lanes are cooler gas sinking.
A typical granule is about fifteen hundred kilometres across and lasts only eight to twenty minutes. About four million of them cover the Sun at any moment.
Above it lies the corona, the Sun’s thin outer atmosphere, at a million degrees or more. Exactly how it gets so hot is still being studied.
Chapter II · Step 3 · The surface
A boiling surface
The Sun is a ball of plasma, so it has no solid surface. The photosphere, the layer that emits most of the visible light, is about 400 km (250 miles) thick. It is covered with granules: the tops of convection cells, each with hot gas rising in the middle and cooler, darker gas sinking at the edges.
Photosphere
~5,500 °C
about 400 km thick
Corona
1–2 million K
and far hotter in places
Granule size
~1,500 km
each lasts 8–20 minutes
Granules at once
~4 million
covering the whole Sun
Granules are drawn about ten times larger than real so you can see them at this distance. The shader animates them, but much faster than the real 8–20 minutes.
Dark spots come and go in a rhythm of about eleven years. Behind them is the Sun’s twisting magnetic field.
Sunspots are places where bundles of magnetic field break through the surface. The field blocks convection, so the gas there cools to about three to four and a half thousand kelvin, and looks dark.
In 1843 Samuel Schwabe noticed that the number of spots rises and falls in a cycle of about eleven years. Cycles have lasted from nine to fourteen years.
Around each peak, the Sun’s magnetic poles flip. Between 1645 and 1715, the Maunder Minimum, there were hardly any spots at all.
The current cycle, number twenty-five, began in December 2019. Its smoothed sunspot number peaked in October 2024, at about one hundred and sixty.
Chapter II · Step 4 · The solar cycle
The Sun’s eleven-year heartbeat
Sunspots form where strong magnetic fields, typically around 3,000 gauss, poke through the surface and choke off the convection that brings up heat. The dark centre (umbra) is roughly 3,000–4,500 K, against about 5,780 K around it. Spots range from 16 km to 160,000 km across and last from days to months. Early in each cycle they appear at higher latitudes and then drift toward the equator.
1610–12 First telescopic sunspot records (Harriot, the Fabriciuses, Galileo)
1645–1715 The Maunder Minimum: very few spots
1843 Samuel Schwabe identifies the cycle
1908 George Ellery Hale links sunspots to magnetic fields
Dec 2019 Solar Cycle 25 begins
Oct 2024 Cycle 25 maximum (smoothed sunspot number ~161)
Try it: drag along the sunspot chart in the top-left corner to travel through time. The Sun shows a number of spot groups that follows the real yearly mean sunspot number, and their latitude follows the phase of the cycle. The spot positions themselves are invented. On 15 October 2024, NASA and NOAA announced that the Sun had reached its solar maximum period; the Royal Observatory of Belgium later confirmed the peak month as October 2024.
When twisted magnetic fields above a sunspot group snap and reconnect, they release their energy in minutes.
Above sunspot groups, magnetic loops get twisted and tangled. When they suddenly reconnect, the stored energy is released as a solar flare.
In minutes, gas is heated above ten million degrees, and a burst of X-rays and ultraviolet light races away at the speed of light.
Flares are graded A, B, C, M and X. Each letter is ten times stronger than the one before. The biggest ever measured, in November 2003, overloaded the detectors.
Eight minutes later, the flash hits Earth’s upper atmosphere on the sunlit side, and can black out shortwave radio for a while.
Chapter III · Step 5 · Flares
A flash of light
A flare is a sudden release of magnetic energy stored in the corona, over minutes to tens of minutes. It accelerates particles and heats plasma above 10 million K. Flares are ranked by their peak brightness in soft X-rays (0.1–0.8 nm), measured by NOAA’s GOES satellites.
Class
Peak X-ray flux
A, B
below 10⁻⁶ W/m²
C
10⁻⁶ to 10⁻⁵ W/m²
M
10⁻⁵ to 10⁻⁴ W/m²
X
above 10⁻⁴ W/m² · X2 is twice X1
Largest measured
~X28 to X45
4 Nov 2003; detectors saturated
Strongest of Cycle 25 (to Oct 2024)
X9.0
3 October 2024
What reaches Earth
X-rays and ultraviolet ionise the sunlit upper atmosphere
NOAA’s radio blackout scale runs from R1 (an M1 flare) to R5 (X20)
Try it: trigger a C, M or X flare. Each class is drawn about ten times brighter than the one below, though the screen cannot show the full range.
Sometimes the Sun throws off a billion tonnes of plasma at once. If it is aimed at Earth, a storm is coming.
The Sun is always losing gas. The solar wind blows out in every direction, at about three hundred to seven hundred and fifty kilometres per second.
A coronal mass ejection is much bigger: an average one carries more than a billion tonnes of plasma, with its own magnetic field wrapped inside.
Most take one to five days to reach us. The fastest have arrived in as little as fifteen to eighteen hours.
Watch what happens when one reaches Earth. In explore mode, you can launch your own.
Chapter III · Step 6 · CMEs and the solar wind
Clouds of magnetised gas
The corona is so hot that it streams away as the solar wind. Eugene Parker predicted it in 1958, and the Soviet probe Luna 1 first detected it in January 1959. A coronal mass ejection (CME) is a much larger burst of plasma that carries a magnetic field stronger than the normal solar wind’s.
Slow solar wind
300–500 km/s
from the equatorial streamer belt
Fast solar wind
~750 km/s
from coronal holes
Average CME mass
~1.6 billion t
a lower limit
CME speed
~250–3,000 km/s
NOAA SWPC
Typical arrival
1–5 days
fastest 15–18 hours
At solar maximum
~3 CMEs/day
about 1 every 5 days at minimum
Try it: launch a fast or a slow CME. The readout gives its travel time at constant speed over 150 million km. The scene is not to scale: the real Earth would be a speck 215 solar radii from the Sun.
Earth’s magnetic field deflects the solar wind and carves a protective bubble around the planet.
Earth’s magnetic field forms a bubble called the magnetosphere. On the side facing the Sun, its edge sits about ten Earth radii away.
In front of it, the solar wind slows down abruptly at the bow shock. Behind Earth, the field is stretched into a magnetotail millions of kilometres long.
When a CME arrives, it squeezes the bubble. If its magnetic field points south, opposite to Earth’s, the two fields connect, and energy pours in.
That energy drives electric currents and sends particles down the field lines toward the poles. This is a geomagnetic storm.
Chapter IV · Step 7 · The shield
The magnetosphere
Earth’s magnetic field pushes back against the solar wind. Where the two pressures balance, on the dayside, lies the magnetopause. The storms that matter most come when the solar wind’s magnetic field points south, opposite to Earth’s field at the dayside: then the fields reconnect and energy flows into the magnetosphere for hours.
Magnetopause (dayside)
~10 Earth radii
about 65,000 km from Earth
Bow shock
~90,000 km
about 17 km thick
Magnetotail
Stretches more than 6.3 million km behind Earth
Energy stored there is released toward the poles during substorms
Try it: launch a CME and watch the bubble get squeezed, the field lines bend and the polar rings of aurora brighten. The compression and the brightening are schematic.
Particles raining down the field lines make the upper atmosphere glow, like a neon sign the size of a continent.
Particles guided down Earth’s field lines collide with atoms and molecules high in the atmosphere, and make them glow. NOAA puts the aurora at eighty to five hundred kilometres up.
The common green light comes from oxygen atoms, between about one hundred and three hundred kilometres.
Above three hundred kilometres, oxygen glows red. That red light takes up to two minutes to come out, so it only survives where the air is thin and collisions are rare.
Lower down, around one hundred kilometres, nitrogen adds pink, red or purple fringes. All of this forms a ring around each magnetic pole: the auroral oval.
Chapter IV · Step 8 · The aurora
Why green, why red
An aurora works like a neon light: fast particles, mostly electrons, hit atoms and molecules and lift them to higher energy states; when they settle back, they give off light at their own colours. Which colour you see depends on which gas is hit, and at what height.
Red · oxygen · above ~300 kmrare; an excited oxygen atom needs up to ~2 minutes to emit it, so only thin air allows it
Green · oxygen · ~100–300 kmthe most common colour; emitted in about 0.7 seconds
Pink, red, blue, purple · nitrogen · around 100 kmlower fringes of the curtains, strongest in intense storms
Height
80–500 km
NOAA SWPC
Best latitudes
~60–75°
under the auroral oval
The curtains are drawn at their real heights above a globe of radius 6,371 km, so they look thin. Their shape and folds are schematic.
Two astronomers saw a white flash on the Sun. Within a day, the sky was on fire and telegraph lines went wild.
Just before noon on the first of September 1859, two British astronomers, Richard Carrington and Richard Hodgson, independently saw a brilliant white flare on the Sun.
About seventeen and a half hours later, the eruption reached Earth, and one of the strongest geomagnetic storms on record began.
Auroras were seen close to the tropics: in Cuba, Hawaii, southern Mexico, and even Colombia.
Telegraph lines sparked and some operators got shocks. Between Boston and Portland, operators disconnected their batteries and kept sending messages on the aurora’s current alone.
Chapter V · Step 9 · 1859
The Carrington Event
The first solar flare ever recorded was seen on 1 September 1859 by Richard Carrington and Richard Hodgson. The CME behind it crossed the 150 million km to Earth in an estimated 17.6 hours. The storm that followed, on 1–2 September, is one of the most intense on record.
Aurora Seen from the poles to low latitudes: south-central Mexico, Cuba, Hawaii, Queensland, southern Japan, China and Colombia
Telegraphs Sparks and fires at stations; some operators got electric shocks
Boston–Portland Operators worked for about two hours on aurora-induced current, with their batteries disconnected
Sun to Earth
~17.6 hours
one of the fastest known
Flare size (estimate)
~X45 ± 5
not measured at the time
The oval is drawn far toward the equator and redder than usual, because high-altitude red light is what people far from the poles tend to see. Its shape is schematic.
A geomagnetic storm drove currents into Québec’s power grid. In about ninety seconds, six million people lost electricity.
In March 1989, coronal mass ejections struck Earth, and the aurora was seen as far south as Texas and Florida.
A storm makes the magnetic field over the ground swing. Long power lines pick up slow, almost direct currents, and push them into transformers.
At 2:44 in the morning on the thirteenth of March, these currents caused equipment failures on Hydro-Québec’s grid, and in about ninety seconds the whole system collapsed.
About six million people were left without power for at least nine hours.
Chapter V · Step 10 · 1989
Ninety seconds to darkness
A changing magnetic field induces an electric field in the ground. Long transmission lines, grounded at both ends, then carry geomagnetically induced currents that vary over seconds to tens of minutes. In a transformer this almost-direct current pushes the iron core into saturation, so it overheats and draws reactive power the grid was not designed for.
Start of the storm
01:27 UT
13 March 1989
Collapse
~90 seconds
from 2:44 a.m. local time
People without power
~6 million
Québec
Outage
≥ 9 hours
a transformer was also lost
The lines and cities on the globe are a simplified sketch of Québec’s grid, not its real layout. Press “Replay the blackout” to run the sequence again.
Storms heat the upper atmosphere. It swells, drag grows, and satellites in low orbit can fall.
A geomagnetic storm heats the thermosphere, the thin air hundreds of kilometres up. It expands, and satellites in low orbit feel more drag.
In February 2022, SpaceX launched forty-nine Starlink satellites into low orbit while a minor but prolonged storm was under way.
The extra drag was too much. Thirty-eight of the forty-nine fell back into the atmosphere and burned up.
Storms also disturb the ionosphere that GPS signals pass through. In calm conditions a simple receiver is accurate to about a metre; in a severe storm, errors can grow to tens of metres.
Chapter VI · Step 11 · Satellites and GPS
When the sky gets thicker
Energy dumped into the upper atmosphere during a storm heats it and makes it expand. Satellites in low orbit then fly through denser gas and slow down. In February 2022, a few days after eruptions began on 29 January, 49 newly launched Starlink satellites met a prolonged but only minor storm; the higher drag and reduced stability brought 38 of them down.
Launched
49
Starlink, February 2022
Re-entered and burned up
38
after a minor storm
Single-frequency GPS, calm
~1 m
or better
In a severe storm
tens of m
or loss of lock
Try it: press “Start the storm”. The swelling of the atmosphere, the heights and the orbital speeds are exaggerated to make them visible. Dual-frequency receivers correct for most of the ionosphere and reach centimetres, until the ionosphere becomes too disturbed.
The strongest geomagnetic storm in more than twenty years carried auroras far from the poles.
In May 2024, a giant sunspot group, region 13664, launched a series of coronal mass ejections toward Earth.
They arrived on the tenth of May, and the storm reached G5, extreme, for the first time since 2003. It is often called the Gannon storm, after space physicist Jennifer Gannon.
Auroras appeared far from the poles. In India, cameras at the observatories of Hanle and Merak in Ladakh, about thirty-three degrees north, recorded them.
A 2025 study ranks the second night of this storm as the third most widespread aurora known, behind only nights in 1872 and 1859.
Chapter VI · Step 12 · 2024
The Gannon storm
From 8 May 2024, region 13664 launched several CMEs. Three reached Earth on 10 May and more followed. The storm peaked at G5 with Kp 9, the most powerful since March 1989 and the first G5 since the Halloween storms of 2003.
Aurora Recorded by cameras at Hanle and Merak in Ladakh, India, on the night of 10–11 May; Hanle is at about 32.8° N
Satellites About half of ~10,000 payloads in low orbit made a coordinated manoeuvre; Starlink service was degraded
GPS Precision farm guidance lost accuracy; some farmers had to stop planting
Power No outages reported in Canada; New Zealand’s Transpower took some lines out of service as a precaution
Peak
G5 · Kp 9
11 May 2024
Ranking (Lockwood et al. 2025)
3rd
most extensive aurora known, by lowest latitude
The oval reaching toward India is schematic. Aurora high in the sky can be seen from far away, low on the horizon, which is how low-latitude cameras catch it.
Forecasters watch the Sun around the clock and rate geomagnetic storms on a five-step scale, a little like hurricanes.
NOAA’s Space Weather Prediction Center watches the Sun day and night, and rates geomagnetic storms from G1, minor, to G5, extreme.
A G1 storm happens about seventeen hundred times in an eleven-year cycle. A G5 happens about four times.
The last warning comes from spacecraft about one and a half million kilometres toward the Sun, at a point called L1. They feel the solar wind fifteen to sixty minutes before it reaches us.
Choose a level, and see how far the aurora can reach and what the storm can do to power grids and satellites.
Chapter VII · Step 13 · Forecasting
From G1 to G5
Coronagraphs show a CME leaving the Sun, and models estimate when it will arrive, usually days ahead. The final check comes at the L1 point, where NOAA’s DSCOVR and, since 2026, SOLAR-1 measure the solar wind and its magnetic field. That gives about 15 to 60 minutes of warning before the storm hits.
Level
Effects (NOAA)
G1 · Minor Kp 5
Weak grid fluctuations. Minor impact on satellite operations possible. Aurora: High latitudes (e.g. northern Michigan, Maine). ~1,700 per cycle (~900 days)
G2 · Moderate Kp 6
Voltage alarms at high latitudes; long storms may damage transformers. Orientation corrections; drag changes orbit predictions. Aurora: As low as New York and Idaho (~55° geomagnetic). ~600 per cycle (~360 days)
G3 · Strong Kp 7
Voltage corrections; false alarms on protection devices. Surface charging; more drag on low-orbit satellites. Aurora: As low as Illinois and Oregon (~50°). ~200 per cycle (~130 days)
G4 · Severe Kp 8–9−
Widespread voltage problems; protection may trip key grid assets. Surface charging and tracking problems. Aurora: As low as Alabama and northern California (~45°). ~100 per cycle (~60 days)
G5 · Extreme Kp 9
Possible grid collapse or blackouts; transformer damage. Extensive charging; uplink, downlink and tracking problems. Aurora: As low as Florida and southern Texas (~40°). ~4 per cycle (~4 days)
Try it: pick G1 to G5 in the box on the scene. The oval’s reach is schematic; the place names are the ones NOAA gives for each level. SOLAR-1 (formerly SWFO-L1) launched on 24 September 2025, reached L1 on 23 January 2026 and entered operational service by June 2026; its coronagraph images reach forecasters within 30 minutes.
A spacecraft named after the man who predicted the solar wind has flown closer to the Sun than anything ever built.
NASA’s Parker Solar Probe launched in August 2018. In April 2021 it became the first spacecraft to fly through the Sun’s corona.
Seven flybys of Venus slowly shrank its orbit. On the twenty-fourth of December 2024, it passed about 6.1 million kilometres above the Sun’s surface.
At that moment it was moving at about 690,000 kilometres per hour, faster than any human-made object has ever travelled.
Its carbon heat shield, about eleven centimetres thick, is built to withstand around 1,370 degrees Celsius, while the instruments behind it stay near room temperature.
Chapter VII · Step 14 · Parker Solar Probe
Touching the Sun
Named after Eugene Parker, the probe launched on 12 August 2018. On 28 April 2021, at 18.8 solar radii, it crossed the Alfvén surface, where the corona lets go of the solar wind: NASA called it “touching the Sun”. Its closest pass, on 24 December 2024, came within 9.86 solar radii of the Sun’s centre.
Closest approach
6.1 million km
above the surface · 24 Dec 2024
Top speed
~191 km/s
about 690,000 km/h
Heat shield
11.4 cm
carbon foam between carbon-carbon panels
Shield front
~1,370 °C
instruments ~29 °C behind it
The orbit near the Sun is drawn to scale in solar radii; the spacecraft is drawn far larger than real. The readout follows the probe’s distance and speed along the orbit. The mission has been extended to 2029.
The Sun has passed the peak of its cycle, but it is still active, and the watch never stops.
The Sun passed the peak of cycle twenty-five in October 2024, but it is still active. In January 2026 a G4 storm struck, and in October another reached G3.
New eyes are watching. India’s Aditya-L1 has studied the Sun from the L1 point since January 2024, and NOAA’s SOLAR-1 joined that watch in 2026.
Parker Solar Probe keeps diving close to the Sun, in a mission extended to 2029.
The same star that powers almost all life on Earth can reach across a hundred and fifty million kilometres and switch off our lights. Learning its weather is how we live safely with it.
Epilogue · 2026 →
Living with a star
1843 Schwabe finds the sunspot cycle
1859 Carrington Event: the first flare seen, auroras near the tropics
1958 Parker predicts the solar wind
1989 Québec blackout: six million without power
2022 38 of 49 new Starlink satellites lost to drag
2024 First G5 storm since 2003; Cycle 25 peaks; Parker’s record pass
2026 G4 storm in January; SOLAR-1 operational; G3 storm in October
Aditya-L1 (ISRO)
At L1 since 6 Jan 2024
India’s first solar observatory; 7 instruments; launched 2 Sep 2023, about 1.5 million km from Earth
G4 storm
19 Jan 2026
reached at 19:38 UTC after a CME shock (NOAA)
The sunspot chart uses the SILSO yearly mean total sunspot number (version 2.0), 1700–2025; drag along it to travel in time. Sunspot positions on the 3D Sun are invented; their number and latitude follow the data and the cycle phase. All full-screen stills are AI-generated to help the imagination and are not photographs. The globe uses NASA Blue Marble imagery.