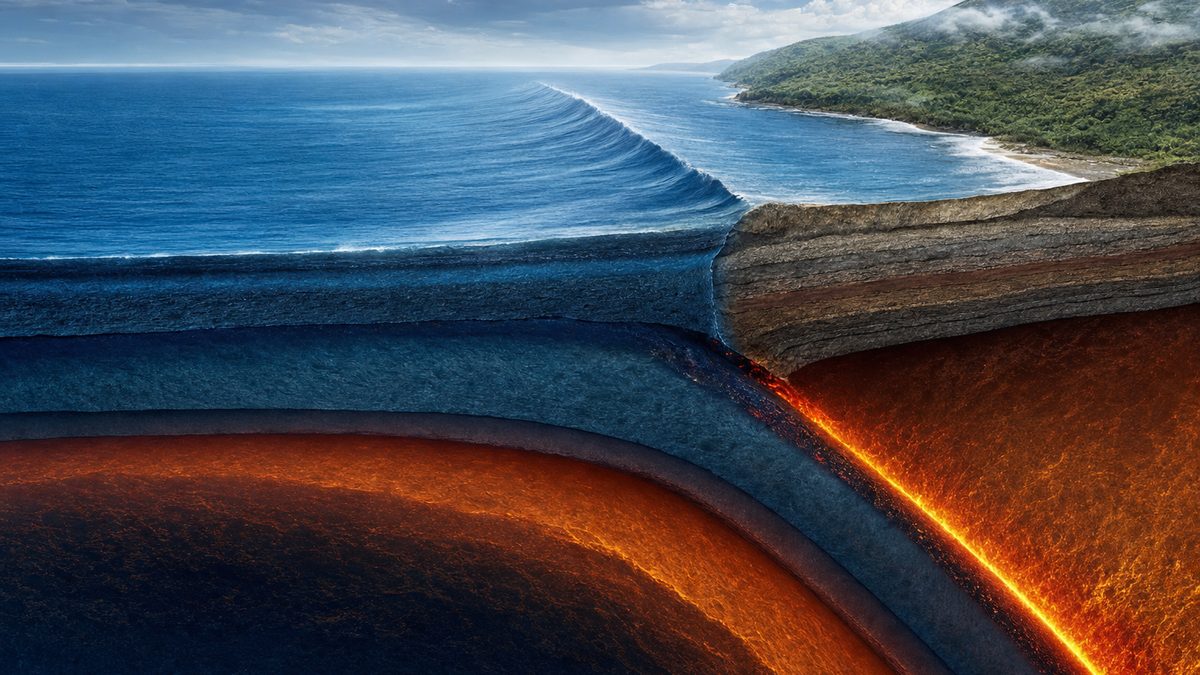
How earthquakes and tsunamis happen, told through the plates beneath Central America and Panama: elastic rebound, seismic waves, magnitude, how a tsunami is born and crosses an ocean, warning systems and how to stay safe.
Interactive 3D film7 min1880 to 2026Published 2026-10-12
A magnitude 7.7 earthquake shook Panama. Why there, and what happens beneath our feet when the Earth breaks?
On the ninth of October 2026, just before one in the afternoon, the ground in central Panama began to shake.
The United States Geological Survey measured it at magnitude seven point seven, centred in Herrera province, about thirteen kilometres deep.
Buildings swayed in Panama City, and tsunami threat messages went out for Pacific coasts of Panama and its neighbours.
To understand why, we need to go beneath the surface: to the plates, the faults, the waves, and the sea.
Prologue · Why the news matters
A magnitude 7.7 in Panama
On 9 October 2026 at 12:56 local time, a magnitude 7.7 earthquake struck 12 km west-southwest of Pitaloza Arriba in Herrera province, central Panama, according to the US Geological Survey. It was felt across the country, including in Panama City, and tsunami threat messages were issued for Pacific coasts of Panama and nearby countries. This story uses that event as a starting point to explain how earthquakes and tsunamis work.
Magnitude
Mw 7.7
moment magnitude, USGS
Depth
~13 km
a shallow earthquake
Type of faulting
Strike-slip
the two sides slid sideways (USGS)
Large later quakes
M6.6 and M6.0
that afternoon and that night (USGS)
Assessments of damage and casualties were still under way when this story was written, so figures are not given here. The rings on the globe stand for seismic waves spreading out; they are not to scale.
How to use: pick a chapter below the scene or press ← → to change step · ▶ plays the step · drag to rotate, scroll or pinch to zoom · “Play the film” runs every step full-screen.
Earth’s rigid outer layer is broken into plates that drift a few centimetres a year. Almost every big earthquake happens where they meet.
The Earth’s rigid outer shell is cracked into seven or eight large plates and many smaller ones.
They move slowly, from almost nothing up to about ten centimetres a year.
Where plates pull apart, slide past each other or collide, rock is strained. Each dot here is an earthquake of magnitude six and a half or more since 1976.
See how the dots trace the edges of the plates, above all the ring around the Pacific Ocean.
Chapter I · Step 1 · Plate tectonics
A planet in pieces
Earth’s lithosphere, its cool and rigid outer layer, is broken into seven or eight major plates, depending on how they are defined, plus many smaller ones. They move at speeds from about zero to 10 cm a year. Most earthquakes happen at their boundaries.
Divergentplates move apart; new crust forms at ridges Transformplates slide past each other sideways Convergentplates collide; one may sink below the other (subduction)
Ring of Fire
~40,000 km
the belt of plate boundaries around the Pacific
Share of earthquakes there
~90%
including most of the largest
Boundaries: Bird (2003) PB2002 model, coloured by type. Dots: 2,224 earthquakes of magnitude 6.5 or more from 1976 to October 2026, from the USGS catalogue. Bigger dots are bigger earthquakes; colour shows depth, from white (shallow) to violet (deep).
Panama rides on a small block of crust, pushed and dragged by the Cocos, Nazca, Caribbean and South American plates.
Zoom in on Central America. Here several plates meet at once.
Off the Pacific coast, the oceanic Cocos plate dives beneath Central America along the Middle America Trench, at about seven to eight centimetres a year.
Panama rides on a small block, the Panama microplate, wedged between the Cocos and Nazca plates to the south and the Caribbean and South American plates to the north and east.
The 2026 earthquake broke a fault near the southern edge of this block. The glowing patch shows where the USGS model says the fault slipped most.
Chapter I · Step 2 · Panama’s tectonic setting
Squeezed between four plates
According to the USGS, Panama lies near the junction of the oceanic Cocos and Nazca plates to the west and south and the Caribbean and South American plates to the north and east, which surround the Panama microplate. The Cocos plate subducts beneath it, the Nazca plate converges with it at an angle, and along its northern edge the Caribbean plate is pushed beneath it.
Cocos vs Caribbean
~77 mm/yr
north-northeast, off Costa Rica (USGS)
Middle America Trench
2,750 km
central Mexico to Costa Rica; up to 6,669 m deep
2026 fault model
up to ~8 m
of slip; USGS finite-fault model, plane ~150 km long
Earlier large quakes
M7.5 (1934), M7.2 (1962)
mostly to the west, near the Panama Fracture Zone
Panama’s largest recorded earthquake, on 7 September 1882 on the Caribbean side, is estimated at about magnitude 7.9; it caused a tsunami with a run-up of about 3 m. Rings: magnitude 7+ earthquakes since 1900 (USGS). Arrows: plate motion relative to the Panama block, in mm per year, from the PB2002 model. Relief is exaggerated vertically.
After the great 1906 earthquake, Harry Fielding Reid explained what a fault really does.
On the eighteenth of April 1906, the San Andreas Fault broke along hundreds of kilometres. Roads and fences across it were torn apart by several metres.
The geophysicist Harry Fielding Reid compared land surveys from before and after. His explanation, published in 1910, is called elastic rebound.
The plates keep moving, but the fault between them is locked by friction. The rock on either side bends, storing energy like a drawn bow.
When the strain becomes greater than the strength of the fault, it suddenly slips. The rock springs back, and the stored energy is released as seismic waves.
Chapter II · Step 3 · Elastic rebound
Stick, bend, snap
Two plates slide past each other a few centimetres a year, but the fault between them sticks. The rock near it deforms elastically, building up strain. When the strain exceeds the strength of the rock, the fault slips within seconds and the rock snaps back almost to its original shape. The energy goes partly into heat, partly into breaking rock, and partly into seismic waves.
Locked: the far sides move; the fault does not. The fence bends.
Strain grows for decades or centuries (orange glow).
Rupture: the fault slips; the fence is cut and offset.
1906 San Francisco
M 7.9
rupture ~480 km long; surface offsets up to ~6 m
Reid’s finding
3.2 m
of bending measured in the 50 years before 1906
The 2026 Panama earthquake was this kind of motion: strike-slip, with the two sides sliding sideways past each other. Use the buttons on the scene to load the fault and let it go.
When one plate sinks beneath another, the contact between them can lock over a huge area.
Now the same idea at a subduction zone, like the one off Central America. The ocean plate slides under the edge of the continent.
The shallow part of the contact sticks. As the ocean plate keeps moving, it drags the edge of the upper plate down and squeezes it.
After decades or centuries, the locked zone gives way. The edge of the upper plate springs back up, and the sea floor above it is lifted, in places by several metres.
These are megathrust earthquakes. Every earthquake of magnitude nine or more since 1900 has been one, and because they lift the sea floor, they can launch tsunamis.
Chapter II · Step 4 · Megathrust earthquakes
Where the biggest earthquakes are born
At a subduction zone, the interface between the sinking plate and the overriding plate is a giant thrust fault. Where it is locked, the edge of the overriding plate is slowly pulled down and compressed. In a megathrust earthquake the lock fails over an area that can be hundreds of kilometres long, and the edge of the overriding plate rebounds upward and seaward.
Off Nicoya, Costa Rica
M 7.6 (2012)
thrust faulting on the Cocos–Caribbean interface (USGS)
All M9+ since 1900
Megathrust
including Chile 1960, Sumatra 2004 and Japan 2011
Japan 2011, sea floor near the trench
moved ~50 m and rose ~7 m
as reported in Science in 2011
Cross-section not to scale; the vertical is stretched and the bending is exaggerated so it can be seen. Press “Load” and “Rupture” on the scene to run the cycle yourself.
From the broken fault, energy races out through the rock in waves of different kinds and speeds.
When a fault slips, waves spread out through the Earth. First comes the P wave, a push and pull like sound, squeezing and stretching the rock along its path.
Next comes the S wave, about sixty percent as fast. It shakes the rock from side to side. S waves cannot travel through liquid, which is how we know the Earth’s outer core is molten.
Last come surface waves, trapped near the ground. They roll and sway with the largest motion, so they tend to cause the most damage.
A seismometer records all three: a small jolt, a stronger shake, then long rolling waves. Try each wave with the buttons.
Chapter III · Step 5 · P, S and surface waves
Three ways the ground shakes
P primary compression along the direction of travel; about 5–8 km/s; passes through solids and liquids S secondary shear, side to side; around 60% of P speed; solids only Surface Love, Rayleigh slowest; near the surface; largest motion, rolling and swaying
Because S waves cannot cross a liquid, they vanish beyond a certain distance from large earthquakes: evidence, first recognised by Richard Dixon Oldham, that Earth has a liquid outer core.
First seismoscope
AD 132
Zhang Heng, Han China; showed shaking but did not record it
First seismogram
3 Nov 1880
Milne, Ewing and Gray’s team in Japan
A seismometer works by inertia: a heavy mass hangs from a frame. The frame moves with the ground, the mass tends to stay still, and the difference is recorded. In the scene each small block is a piece of rock; motion is exaggerated and slowed down.
The gap between the first two waves tells a station how far away the earthquake is.
Because P waves outrun S waves, the delay between them grows with distance.
For nearby earthquakes there is a handy rule: multiply the delay in seconds by about eight, and you have the distance in kilometres.
One station gives a circle. Three stations give three circles, and they cross at the epicentre.
The same race makes early warning possible. Sensors near the fault detect the fast P waves and send an alert that can arrive seconds before the strong shaking.
Chapter III · Step 6 · Locating an earthquake
The race between P and S
Each station measures the time between the P and S arrivals. For a local earthquake less than about 200 km away, that delay in seconds times about 8 gives the distance in kilometres. Draw a circle of that radius around each station: three circles meet at the epicentre.
Rule of thumb
d ≈ 8 × (tS − tP)
km and seconds; local earthquakes
Japan’s early warning
since 2007
first nationwide system, fully operational 1 Oct 2007
Japan, 11 March 2011
Public warning ~31 s after the earthquake began
early warning detects an earthquake already under way; it does not predict
An illustration: wave speeds are typical crustal values (P 6 km/s, S 3.4 km/s) and the three “stations” are placed at real towns, but they do not represent actual instruments or recorded times.
Each step up the magnitude scale means about 32 times more energy.
In 1935 Charles Richter, working with Beno Gutenberg, defined a magnitude scale from the size of the wiggles on a standard seismograph. Each whole number meant ten times bigger wiggles.
But for the largest earthquakes, that scale stops growing. So in 1979 Thomas Hanks and Hiroo Kanamori introduced moment magnitude, based on the physics of the fault itself.
Seismic moment is the stiffness of the rock, times the area that slipped, times how far it slipped. Moment magnitude is a logarithm of it.
Each step up means about thirty-two times more energy, and two steps a thousand times. Each small cube here holds one earthquake’s energy; the big cube holds the other.
Chapter IV · Step 7 · Magnitude
About 32 times per step
Richter’s 1935 local magnitude (ML) measured the largest trace amplitude on a Wood-Anderson seismograph: ten times the amplitude meant one magnitude unit more. It saturates around magnitude 7, so it cannot tell large earthquakes apart. Moment magnitude (Mw, 1979) is based on the seismic moment, M0 = μ × A × D.
μ
rigidity of the rock
shear modulus, in pascals
A × D
area × average slip
how much fault moved, and how far
Moment magnitude
Mw = ⅔ log10(M0) − 6.03
M0 in newton-metres. For Panama 2026 the USGS gives M0 ≈ 3.8 × 10²⁰ N·m, which gives Mw ≈ 7.7
+1 about 32× the energy (101.5 ≈ 31.6)
+2 1,000× the energy
7.7 → 9.1 about 126×: Japan 2011 compared with Panama 2026
Pick a comparison with the buttons on the scene. Cube volume is proportional to energy.
A tsunami is not a wind wave. It is the whole depth of the ocean, pushed up from below.
When a megathrust earthquake lifts the sea floor, it lifts the entire column of water above it, kilometres deep.
Gravity pulls the mound back down, and it spreads out as waves in both directions: out to the open ocean, and towards the shore.
In deep water a tsunami may be only about a metre high but over a hundred kilometres long. Ships at sea may barely notice it.
Faults that slide sideways, like Panama’s in 2026, move the sea floor much less up and down, so they usually make smaller tsunamis. But warning centres have to act within minutes, before that is certain.
Chapter V · Step 8 · How a tsunami forms
Lifting the ocean
Most tsunamis are caused by earthquakes that suddenly raise or drop the sea floor. Landslides, volcanic eruptions and, rarely, meteorite impacts can cause them too. Unlike wind waves, which stir only the surface, a tsunami moves the whole water column.
Wind wave
~100 m
typical wavelength
Tsunami, deep ocean
up to ~200 km
wavelength; height often about 1 m
Typical period
~12 min
between crests of a damaging tsunami
Strike-slip faults
Usually small tsunamis
little vertical movement of a flat sea floor
Warning centres first use the earthquake’s size and location, then check sea-level gauges to see whether a tsunami has formed, then forecast its path. For Panama on 9 October 2026, the US National Weather Service said waves of 1 to 3 m above tide were possible on some Panamanian coasts. Press “Trigger the earthquake” on the scene; heights in the scene are exaggerated.
As a tsunami reaches shallow water it slows down, bunches up and rises.
A tsunami’s speed depends only on the depth of the water: the square root of gravity times depth.
Over five kilometres of ocean that is about eight hundred kilometres an hour, as fast as a jet airliner. A tsunami can cross an ocean in less than a day.
Near the coast the water gets shallow. The front of the wave slows down, the back catches up, and the energy piles into a much taller wave.
Often the trough arrives first, and the sea draws back, exposing the sea bed. That is a warning: the wave is coming. Head for high ground at once.
Chapter V · Step 9 · Shoaling
Slower, shorter, taller
In water much shallower than its wavelength, a wave travels at c = √(g·d), where g ≈ 9.8 m/s² and d is the depth. As the depth falls, the wave slows, its wavelength shrinks and its height grows. This is called shoaling. A tsunami often reaches land not as a curling breaker but as a fast, rising flood, like a tidal bore.
depth 5,000 m
797 km/h
depth 4,000 m
713 km/h
depth 1,000 m
357 km/h
depth 200 m
159 km/h
depth 50 m
80 km/h
depth 10 m
36 km/h
Speeds computed from c = √(g·d). The drawback (the sea receding) can expose hundreds of metres of sea bed. A tsunami is a series of waves: the first may not be the largest, and the danger can last for hours.
A magnitude 9.1 megathrust earthquake off Sumatra sent a tsunami across an ocean that had no warning system.
On the morning of the twenty-sixth of December 2004, the sea floor off northern Sumatra broke along a fault more than twelve hundred kilometres long.
The rupture lasted at least ten minutes, the longest ever observed. The tsunami it launched spread across the Indian Ocean.
About two hours later it reached the coasts of southwestern Thailand, Sri Lanka and India. There was no tsunami warning system in the Indian Ocean.
About two hundred and twenty-eight thousand people died in fourteen countries, about eight thousand of them in Thailand. On one Phuket beach, a ten-year-old who had learned the signs at school warned others in time.
Chapter VI · Step 10 · 2004 Indian Ocean
The longest rupture ever seen
At 07:58 local time on 26 December 2004, a megathrust earthquake struck off the west coast of Aceh, northern Sumatra. The fault ruptured over 1,200–1,300 km and the sea floor rose by several metres. Waves up to 30 m high struck coasts around the Indian Ocean.
Magnitude
Mw 9.1–9.3
USGS: 9.1; later studies 9.2–9.3
Reached SW Thailand
~2 hours
after the earthquake; Sri Lanka and India also about 2 h
Deaths, 14 countries
~227,898
estimated
Thailand
~8,000
Khao Lak was the hardest-hit Thai area
At Maikhao Beach in Phuket, 10-year-old Tilly Smith recognised the sea drawing back from a geography lesson; she and her parents warned others, and the beach was cleared in time. Today a warning system with sirens lines the affected Thai coast.
The spreading colour is a simple model made for this story: first-arrival time computed from c = √(g·d) over NOAA ETOPO1 bathymetry, with a line every hour. It shows when the wave could arrive, not how high it was. It agrees with the roughly two hours observed for Thailand.
Japan had the world’s most advanced warning systems. The tsunami was still larger than many defences were built for.
At two forty-six in the afternoon of the eleventh of March 2011, a magnitude nine point one megathrust earthquake struck off northeastern Japan.
Near the trench the sea floor moved about fifty metres sideways and rose about seven metres. Japan’s earthquake early warning went out about thirty-one seconds after the shaking began.
The largest waves arrived within about half an hour, with run-up reaching about forty metres in places. Nearly twenty thousand people died.
The tsunami then crossed the whole Pacific, damaging harbours in California and Oregon and homes in Chile.
Chapter VI · Step 11 · 2011 Tōhoku
A wave across the Pacific
The 11 March 2011 earthquake occurred where the Pacific plate subducts beneath northern Honshu, about 72 km east of the Oshika Peninsula. It was the largest megathrust earthquake of the past two decades.
Magnitude
Mw 9.0–9.1
upgraded to 9.1 by the USGS in 2016
Maximum run-up
~40.5 m
at Miyako
Largest waves
26–35 min
after the quake; Sendai had about 8–10 minutes
Dead and missing
19,759 and 2,553
official figures, 2021
Across the Pacific, waves up to 2.4 m reached parts of California and Oregon. The spread is shown with the same simple travel-time model as the previous step.
Sensors on the ocean floor can feel a tsunami pass overhead, even when it is only centimetres high.
After a tsunami in 1946 killed more than one hundred and seventy people in Hawaii, a warning centre was set up there. It became the Pacific Tsunami Warning Center.
Today DART stations sit on the deep sea floor. Their pressure sensors can detect a change of about one millimetre of water, kilometres down.
Each sends its reading by sound to a buoy at the surface, which relays it by satellite to warning centres.
After 2004 the Indian Ocean got its own warning system, in 2006. Thailand’s two DART stations watch the Andaman Sea and the Bay of Bengal. Pick an earthquake to see which stations would feel the wave first.
Chapter VII · Step 12 · Warning systems
Listening to the deep sea
A DART station has a bottom pressure recorder on the sea floor and a surface buoy. The recorder measures changes in water pressure; the buoy receives the data by an acoustic link and sends it by satellite to tsunami warning centres. Together with seismometers and coastal tide gauges, this confirms whether a tsunami is under way and how big it is.
Sensitivity
~1 mm
of water, at depths of several kilometres
DART stations listed
76
by NOAA’s National Data Buoy Center, 2026
Pacific warning centre
1948 →
Hawaii; set up after the 1946 tsunami
Indian Ocean system
June 2006
under UNESCO leadership
Yellow dots: DART stations in the NDBC list; the two Thai stations are run by Thailand’s National Disaster Warning Center. The first DART buoy in the Indian Ocean was launched in December 2006. Arrival times on the scene come from this story’s simple travel-time model, not from real records.
A few simple actions save lives. Near the coast, the shaking itself can be your tsunami warning.
If the ground shakes, drop to your hands and knees, take cover under a sturdy table, and hold on until the shaking stops. Do not run outside, and do not stand in a doorway.
If you are near the coast and the shaking is strong or long, that is your tsunami warning. So is a loud roar from the sea, or the water suddenly drawing back.
Do not wait for an official message. Go to high ground, or as far inland as you can, on foot if possible.
Then stay there. A tsunami is a series of waves; the first is not always the largest, and the danger can last for hours.
Chapter VII · Step 13 · Staying safe
Drop, cover, hold on, then go high
During shaking
Drop to the ground before the earthquake drops you.
Cover under a sturdy table or desk; if there is none, get down by an interior wall and protect your head and neck with your arms.
Hold on until the shaking stops. If you are in bed, stay there and cover your head with a pillow.
Do not run outside or to other rooms during shaking, and do not stand in a doorway: in modern homes doorways are no stronger than the rest of the house.
Near the coast
Natural warnings: strong or long shaking, a loud roar from the ocean, the sea suddenly drawing back.
Go as high or as far inland as possible, straight away. Do not wait for officials.
Stay away from the shore until officials say it is safe: the first wave may not be the largest.
We cannot stop earthquakes, and we still cannot predict them. But we understand them, and we can be ready.
The plates beneath Panama will keep moving, a few centimetres every year, and strain will build up again.
No one can yet predict when a fault will break. But in little more than a century we have learned how faults work, how to measure earthquakes, and how to read their waves.
Seismometers, sea-floor sensors and warning centres now watch every ocean.
And the most important knowledge is simple enough for a child to carry: when the earth shakes, protect yourself; near the sea, go high.
Epilogue · 1880 → 2026
Living with a moving Earth
1880 First seismogram recorded, in Japan
1882 Panama’s largest recorded earthquake, about M7.9, with a tsunami
1906 San Francisco; Reid’s elastic rebound theory follows (1910)
1935 Richter’s magnitude scale
1948 Tsunami warning centre in Hawaii, after the 1946 tsunami
1960 Chile, M9.4–9.6: the strongest earthquake ever recorded
1979 Moment magnitude introduced
2004 Indian Ocean earthquake and tsunami
2006 Indian Ocean Tsunami Warning System begins
2011 Tōhoku earthquake and tsunami, Japan
2026 M7.7 strike-slip earthquake in central Panama
All full-screen stills are AI-generated to help the imagination; they are not photographs and do not show real places on the days described. The globe uses NASA Blue Marble imagery. Plate boundaries: Bird (2003). Relief and bathymetry: NOAA ETOPO1. Earthquakes: USGS catalogue and finite-fault model. Tsunami travel-time maps and DART arrival times are simple models made for this story.