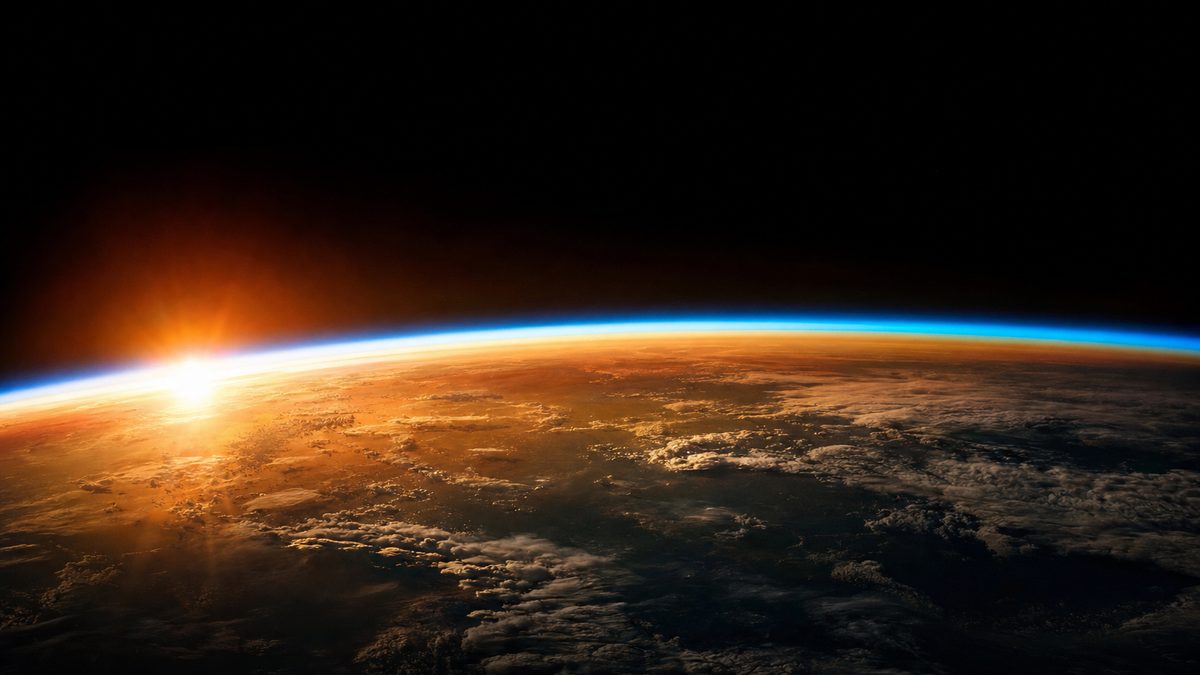
How a few trace gases keep Earth 33 °C warmer, why CO₂ and water vapour trap infrared while nitrogen and oxygen do not, and how the Keeling Curve, 800,000 years of ice cores and global thermometers show the climate changing. With real NOAA data and an interactive CO₂ model.
Interactive 3D film11 min1824 to 2026Published 2026-10-13
A thin layer of gases keeps our planet habitable. We have been making it thicker.
On 12 October 2026, Europe’s Copernicus service reported that this September was the second-warmest September on record.
In four weeks, governments meet in Antalya, Türkiye, for the COP31 climate conference.
Behind the headlines lies a piece of physics that has been understood for well over a century: the greenhouse effect.
This is how it works, how it was discovered, and how we know that it is getting stronger.
Prologue · Why now
The greenhouse effect
On 12 October 2026 the EU’s Copernicus Climate Change Service reported that September 2026 was the second-warmest September in its records, 1.63 °C above the 1850–1900 average, with record sea-surface temperatures for the month. On 9 November the COP31 climate conference opens in Antalya, Türkiye, with Australia’s climate minister presiding over the negotiations. This story is the science underneath: how a few trace gases warm the planet, how that was discovered, and how we measure the change.
September 2026
+1.63 °C
vs 1850–1900 · one month, Copernicus ERA5
COP31
9–20 Nov 2026
Antalya, Türkiye
Mauna Loa CO₂, 2025 average
427.35 ppm
NOAA Global Monitoring Laboratory (data file of 9 Oct 2026)
In the scene, yellow streaks are sunlight arriving and red streaks are infrared (heat) leaving Earth. Real light is invisible in space and unimaginably more plentiful; the streaks are a drawing to follow the energy.
How to use: pick a chapter below the scene or press ← → to change step · ▶ plays the step · drag to rotate, scroll or pinch to zoom · buttons in the box at the top right change the scene · “Play the film” runs every step full-screen.
Every second, Earth must shed as much energy as it absorbs.
Sunlight brings about 340 watts per square metre to the top of the atmosphere, averaged over the whole planet.
About 29 percent bounces straight back to space, from clouds, ice and bright ground. The rest is absorbed.
A warm planet sheds that energy as invisible infrared light. The hotter it is, the more it radiates.
Balance the books for a bare rock at our distance from the Sun, and you get about minus 18 degrees Celsius. Yet Earth averages about plus 15.
Chapter I · Step 1
A planet in balance
Averaged over day and night and the whole globe, about 340 watts of sunlight arrive on each square metre at the top of the atmosphere. About 29 percent is reflected straight back by clouds, particles and bright surfaces such as snow and sea ice. The remaining ~240 W/m² is absorbed and has to leave again as thermal infrared radiation, or the planet would keep heating up. A surface radiates in proportion to the fourth power of its absolute temperature, so a warmer planet sheds energy much faster.
Sunlight arriving
~340 W/m²
global average, top of atmosphere
Reflected
~29%
clouds, aerosols, ice, deserts
Bare-rock Earth
−18 °C
no infrared-absorbing gases
Real Earth
~+15 °C
the 33 °C difference is the greenhouse effect
The readout uses the simplest possible energy balance: absorbed sunlight (340 × 0.71 W/m²) equals σT⁴ radiated by the surface. It gives −18 °C. Use the buttons to switch the greenhouse gases off and on.
Something keeps Earth far warmer than sunlight alone can explain.
In the 1820s, the French mathematician Joseph Fourier noticed this puzzle: by his reckoning, Earth was too warm.
He wondered whether the atmosphere acts like the glass panes of a hot box, letting sunlight in but holding heat back.
Watch the greenhouse gases switch on. Some outgoing infrared is caught and sent back down, and the surface warms until the books balance again.
That extra warmth, about 33 degrees, is the natural greenhouse effect.
Chapter I · Step 2 · 1824
The 33-degree puzzle
In articles of 1824 and 1827, Joseph Fourier calculated that an Earth warmed only by sunlight should be much colder than it is. He compared the atmosphere with Horace-Bénédict de Saussure’s “hot box”, a box lined with blackened cork under several panes of glass that grew hot in sunlight, and suggested that the gases of the air might form a barrier like the glass panes. He is generally credited with discovering the greenhouse effect, though he never used the name.
Sunlight (mostly visible) passes through the air and warms the ground.
The ground radiates infrared. Some gases absorb it and radiate it again in all directions, part of it back down.
The surface warms until enough infrared escapes from higher, colder air to balance the sunlight again.
“Greenhouse” is a loose name. A real glasshouse stays warm mainly because its glass stops warm air from rising away; Fourier himself noted that convection was absent from de Saussure’s box. Fourier also wrongly thought that heat from interstellar space helped explain the gap.
An American experimenter puts different gases in the sun.
In 1856, Eunice Foote put gases in glass cylinders, placed thermometers inside, and set them side by side in the sun.
Moist air warmed more than dry air. The cylinder of carbon dioxide, then called carbonic acid gas, became hottest of all.
She wrote that an atmosphere of that gas would give our Earth a high temperature.
Her paper was read at a scientific meeting in August 1856 by Joseph Henry. It was largely overlooked until historians revived it in the 2010s.
Chapter II · Step 3 · 1856
Two glass cylinders
Eunice Newton Foote used an air pump, two glass cylinders and four mercury thermometers. She compared cylinders of air, carbon dioxide and hydrogen, and moist air with dry air, in sunlight and in shade. The carbon dioxide cylinder heated the most, reaching 125 °F (52 °C). Her paper, “Circumstances Affecting the Heat of the Sun’s Rays”, was presented by Joseph Henry at the American Association for the Advancement of Science meeting on 23 August 1856 and published that year in the American Journal of Science and Arts.
CO₂ cylinder
125 °F
52 °C, the hottest in her test
Her conclusion
“An atmosphere of that gas would give to our earth a high temperature”
Foote, 1856
Historians note that her simple apparatus could not separate the absorption of sunlight from the absorption of infrared radiated by the Earth, which is what the greenhouse effect depends on. Her insight that more water vapour or carbon dioxide would change the climate still came three years before Tyndall’s work. The thermometer heights in the scene are illustrative.
A long tube, a hot cube and a very sensitive detector.
From 1859, at the Royal Institution in London, John Tyndall sent infrared heat through a long tube, filled with one gas at a time.
Nitrogen and oxygen, which make up 99 percent of dry air, let it pass almost untouched.
Water vapour, carbon dioxide and other compound gases absorbed it strongly. Water vapour was the strongest absorber in the air.
“The atmosphere admits of the entrance of solar heat,” he said, “but checks its exit.”
Chapter II · Step 4 · 1859
Measuring invisible heat
John Tyndall began his experiments in May 1859 and presented them at the Royal Institution on 10 June 1859. Using a thermopile, a sensitive detector of radiant heat, he measured how strongly different gases absorb infrared. He was the first to correctly measure the relative absorptive powers of nitrogen, oxygen, water vapour, carbon dioxide, ozone, methane and other trace gases, and concluded that water vapour is the strongest absorber of radiant heat in the atmosphere.
Nitrogen + oxygen
~99%
of dry air · almost transparent to infrared
Carbon dioxide
~0.04%
of the air · a strong infrared absorber
Tyndall, 10 June 1859
“The atmosphere admits of the entrance of solar heat; but checks its exit”
Royal Institution discourse
Try the gas buttons. The share of rays stopped in the scene is illustrative, chosen only to show “almost none” versus “a lot”; it is not Tyndall’s measured data.
The first calculation of what more, or less, CO₂ would do.
In 1896 the Swedish chemist Svante Arrhenius tried to explain the ice ages. Could less carbon dioxide have cooled the planet?
Using infrared measurements of the Moon, he estimated how much the temperature would change if the gas were halved, or doubled.
Building on a colleague’s figures, he also concluded that burning coal adds enough carbon dioxide to warm the Earth.
His numbers were rough, but the idea held up. Today’s best estimate for a doubling is about 3 degrees.
Chapter II · Step 5 · 1896
Turning the dial
Svante Arrhenius (Nobel Prize in Chemistry, 1903) published “On the Influence of Carbonic Acid in the Air upon the Temperature of the Ground” in 1896. He wanted to know whether changes in CO₂ could explain the swings between glacial and interglacial periods. Using infrared observations of the Moon by Very and Langley, and the Stefan–Boltzmann law, he made the first quantitative estimate of warming from more CO₂. Using figures from his colleague Arvid Högbom, he was also the first to predict that emissions from burning fossil fuels could be large enough to cause global warming.
Arrhenius, 1896
−4 to −5 °C
if CO₂ fell to 55–62% of its level; +8 to 9 °C in the Arctic for 2.5–3 times as much
Arrhenius, 1908
~4 °C
for doubled CO₂; about −4 °C for halved
IPCC AR6 (2021) best estimate
3 °C
likely range 2.5–4 °C for a doubling, in the long run (“equilibrium climate sensitivity”)
Arrhenius left out clouds, convection and other important factors, and he expected warming to be gradual and even welcome: he hoped for “more equable and better climates”. His work is now seen less as an accurate number than as the first demonstration that more CO₂ means a warmer planet.
Why do carbon dioxide and water vapour absorb infrared light, while nitrogen and oxygen do not?
Molecules vibrate. Infrared light is absorbed only if a vibration makes the molecule’s electric charge slosh from side to side.
Nitrogen is two identical atoms. When it stretches, its charge stays perfectly balanced, so infrared light passes straight through.
Carbon dioxide can bend. Its slightly negative oxygens and slightly positive carbon swing apart, and that bend catches infrared at about 15 micrometres, close to where Earth glows brightest.
Chapter III · Step 6
Why some gases trap heat
A molecule absorbs infrared light only through a vibration that changes its dipole moment, the uneven spread of its electric charge. Nitrogen (N₂) and oxygen (O₂) each have two identical atoms, so their charge is always symmetric: they are almost totally unaffected by thermal infrared. Argon, about 0.9% of the air, is a single atom and fully transparent. Molecules made of different atoms, such as CO₂, H₂O, CH₄ and N₂O, have vibrations that do shift charge, and they absorb and emit infrared.
CO₂ bending
14.99 µm
IR-active · near the peak of Earth’s glow
CO₂ asymmetric stretch
4.26 µm
IR-active
CO₂ symmetric stretch
—
charge stays balanced · IR-inactive
N₂ / O₂ stretch
—
no dipole change · IR-inactive
Use the buttons to switch molecule and vibration. A red wave of infrared comes in from the left. If the vibration shifts charge (yellow arrow), the wave is absorbed and the molecule shakes harder, then re-emits infrared in a random direction, sometimes back towards the ground. Sizes, speeds and wavelengths are not to scale.
Now add carbon dioxide. The extra molecules catch more of the outgoing infrared and send part of it back down.
Less heat escapes than arrives, so the planet gains energy and warms until it radiates enough to balance again.
Each doubling of carbon dioxide adds roughly the same push, about 3.7 watts per square metre.
The IPCC’s best estimate is that a doubling would, in the long run, warm Earth by about 3 degrees, likely between 2.5 and 4. Try the slider.
Chapter III · Step 7 · Interactive
A thicker blanket
Adding CO₂ makes the air more opaque to infrared, so the infrared that finally escapes to space comes from higher, colder air and is weaker. Earth then absorbs more sunlight than it radiates, an energy imbalance, and warms until the books balance again. The push, called radiative forcing, grows with the logarithm of the concentration: each doubling adds about the same amount, roughly 3.7 W/m². Absorption does not “saturate”; the effect simply grows more slowly.
Forcing (simple formula)
5.35 × ln(C/C₀)
W/m², C₀ = 280 ppm
Warming per doubling
~3 °C
IPCC AR6 best estimate, likely 2.5–4 °C
The readout is a deliberately simple model: CO₂ only, long-run (equilibrium) warming relative to 280 ppm, using 3 °C per doubling with the IPCC likely range in brackets. It ignores other gases, aerosols, and the decades the ocean takes to warm up. Real projections come from full climate models.
One mountain-top record shows the air breathing, and filling up.
In March 1958, Charles David Keeling began measuring carbon dioxide on Mauna Loa, high above the Pacific. The level was then about 315 parts per million.
The line zig-zags every year: northern forests draw carbon dioxide down each summer and release it in winter.
But underneath the breathing, it only climbs. The 2025 average was 427 parts per million, and May 2026 set a monthly record of 432.
In the 1960s it rose by less than one part per million a year. Over the last decade, by more than two and a half.
Chapter IV · Step 8 · 1958 → 2026 · Real data
The Keeling Curve
Charles David Keeling of the Scripps Institution of Oceanography started continuous measurements at Mauna Loa Observatory in March 1958. Data from March 1958 to April 1974 are Keeling’s (Scripps); NOAA’s Global Monitoring Laboratory measurements follow. The yearly zig-zag of about 6 ppm comes from Northern Hemisphere plants: CO₂ peaks around May, falls through the northern summer as plants grow, and rises again in autumn and winter. The American Chemical Society named the Keeling Curve a National Historic Chemical Landmark in 2015.
First monthly mean
315.7 ppm
March 1958
2025 annual mean
427.35 ppm
Mauna Loa
Highest month so far
432.3 ppm
May 2026
Latest month
426.1 ppm
September 2026 (seasonal low)
Growth, 1960s
~0.9 ppm/yr
from the annual means
Growth, 2015–2025
~2.6 ppm/yr
from the annual means
The chart plots all 823 monthly means from March 1958 to September 2026, downloaded from NOAA GML (file created 9 October 2026; the latest year is provisional). After the 2022 eruption of Mauna Loa, measurements from December 2022 to July 2023 came from nearby Maunakea. Use the buttons to zoom into the seasonal cycle.
Tiny bubbles of ancient air, sealed in Antarctic ice.
To look further back, scientists drill into the Antarctic ice sheet. Snow piles up year after year and seals tiny bubbles of the air of its time.
The EPICA core at Dome C, about three kilometres deep, reaches back some 800,000 years.
Through repeated ice-age cycles, carbon dioxide rose and fell between about 170 and 300 parts per million.
Today’s level is more than 40 percent above that natural ceiling, and the jump took little more than two centuries.
Chapter V · Step 9 · Real data
800,000 years in the ice
As snow builds up on an ice sheet, each layer presses on the ones below until the snow becomes ice and the air between the grains is sealed into bubbles. The European EPICA project drilled to bedrock at Dome C, East Antarctica, at 3,260 m. Measuring the air in those bubbles gives a continuous record of CO₂ through the last eight hundred thousand years, with glacial cycles about 100,000 years long.
Lowest in the record
~172 ppm
about 668,000 years ago
Highest before industry
~299 ppm
about 333,000 years ago
Before industry
~280 ppm
mid-1700s
2025, Mauna Loa
427 ppm
about 43% above the 800,000-year maximum
The chart shows the EPICA Dome C composite record (Lüthi et al. 2008, data from NOAA NCEI) averaged into 2,000-year bins, then today’s value. The IPCC (2021) assessed that CO₂ in 2019 was higher than at any time in at least 2 million years.
Fossil fuels, forests, and the ocean and land that take some of it back.
Carbon constantly moves between the air, the ocean, plants and soils. For a very long time those flows were roughly balanced.
Burning coal, oil and gas releases carbon that was buried underground. In 2025 that was about 38 billion tonnes of carbon dioxide, a record.
Clearing forests and other land-use change added about 4 billion tonnes more.
Over the past decade the ocean took up about 29 percent of our emissions and land plants about 21 percent. The rest, roughly half, stays in the air.
Chapter V · Step 10 · 2025
Where the extra carbon comes from
The Global Carbon Project’s 2025 budget projected record fossil CO₂ emissions of 38.1 billion tonnes (+1.1%), with all three fuels rising (coal +0.8%, oil +1%, gas +1.3%). Land-use change, mostly deforestation, added about 4.1 billion tonnes. By sector, electricity and heat production are the largest source of greenhouse gases, followed by transport, manufacturing and construction, and agriculture, which dominates methane and nitrous oxide emissions.
Fossil CO₂ 38.1
Land-use change 4.1
Ocean sink
~29%
of human CO₂, last decade
Land sink
~21%
of human CO₂, last decade
Atmospheric CO₂, 2025 (global)
425.7 ppm
52% above pre-industrial · GCB estimate
Billions of tonnes of CO₂ per year. The GCB also finds that warming has made the land and ocean sinks nearly 20% smaller than they would otherwise have been over 2015–2024. In the scene, particle flows are proportional to these numbers but greatly simplified.
Warm air holds more water, and water vapour is itself a greenhouse gas.
Water vapour causes about half of the natural greenhouse effect. So why is carbon dioxide the one we talk about?
Because water vapour only stays in the air for about nine days. Its amount is set by temperature, not by what we emit.
For every degree of warming, air can hold about 7 percent more water vapour.
So when carbon dioxide warms the planet, extra water vapour follows, and adds to the warming. That is a feedback.
Chapter VI · Step 11 · Interactive
The water vapour amplifier
Water vapour is the most important greenhouse gas overall, responsible for roughly half of the greenhouse effect, but human activity barely changes its global amount directly: a molecule of water vapour stays in the air for only about nine days. What controls it is temperature. By the Clausius–Clapeyron relation, the water-holding capacity of air rises by about 7% for every 1 °C, and satellites have detected the increase.
Capacity per °C
~+7%
Clausius–Clapeyron
Feedback strength
1.85 ± 0.32
W/m² per °C, from observations
Warming is still kept in check overall because a warmer planet radiates much more heat (the Planck response). Feedbacks like this one make the warming from CO₂ larger than it would be on its own. Press +1 °C or +2 °C to add vapour to the column.
White ice reflects sunlight. Open ocean absorbs it.
Bare sea ice reflects 50 to 70 percent of the sunlight that reaches it. Open ocean reflects only about 6 percent.
As the Arctic warms and ice melts, dark water takes its place, absorbs more sunlight, and warms further. Another amplifying feedback.
Between the 1980s and the 2010s, Arctic sea ice in September shrank by about 40 percent.
Use the buttons to take the ice away, and watch where the sunlight goes.
Chapter VI · Step 12 · Interactive
When the ice goes dark
Albedo is the fraction of sunlight a surface reflects. Bare sea ice reflects 50–70%, snow-covered ice up to about 90%, while the open ocean reflects only about 6%. When warming melts ice, darker water and land are exposed, more sunlight is absorbed, and the region warms further. The IPCC found that human influence is very likely the main driver of the decrease in Arctic sea ice area, about 40% in September between 1979–1988 and 2010–2019.
Sea ice
50–70%
of sunlight reflected
Open ocean
~6%
of sunlight reflected
Ice-free Arctic summers (June–September)
+0.19 °C
estimated extra global warming in climate models (range 0.16–0.21 °C)
The scene looks down on the Arctic. Switch between sea ice and open ocean: yellow sunlight streaks bounce off ice but mostly vanish into dark water, and the meter counts what the Arctic sends back to space.
Measurements from weather stations, ships and buoys build global temperature records that begin in 1850.
The World Meteorological Organization combines eight of them. 2024 was the warmest year on record, about 1.55 degrees above the late 1800s, likely the first calendar year above 1.5.
2025 came in at about 1.4 degrees, the second or third warmest. The last eleven years are the eleven warmest on record.
In 2021 the IPCC concluded that it is unequivocal that human influence has warmed the atmosphere, ocean and land.
Chapter VII · Step 13 · Real data
What the thermometers say
WMO’s consolidated analysis uses eight datasets, including ERA5, GISTEMP, NOAAGlobalTemp, HadCRUT5 and Berkeley Earth. All show 2015–2025 as the eleven warmest years on record. The IPCC’s 2021 assessment concluded: “It is unequivocal that human influence has warmed the atmosphere, ocean and land.” Hot extremes, including heatwaves, have become more frequent and more intense across most land regions since the 1950s.
2024
1.55 ± 0.13 °C
warmest on record · likely first calendar year above 1.5 °C
2025
1.43 ± 0.13 °C
second or third warmest, depending on dataset
Long-term warming
1.34–1.41 °C
WMO estimate in its 2024 report
Sea level
~11 cm
higher in 2025 than in 1993
Bars: HadCRUT5 annual global anomalies, re-based by us to the 1850–1900 average (one of WMO’s eight datasets, so its values differ slightly from the WMO averages above). A single year above 1.5 °C does not mean the Paris goal is missed, because that goal refers to long-term averages. Arctic sea-ice extent in 2025 was the lowest or second-lowest in the satellite record, and ocean heat content reached a new high.
What the Paris Agreement aims for, and what a carbon budget is.
In December 2015, the Paris Agreement set a goal: hold warming well below 2 degrees, and pursue efforts to limit it to 1.5. These goals refer to averages over about twenty years, not to a single hot year.
Warming depends on the total carbon dioxide emitted, so each goal comes with a budget.
From January 2026, the Global Carbon Project estimates about 170 billion tonnes left for 1.5 degrees, 525 for 1.7, and 1,055 for 2.
At today’s rate of emissions, that is roughly 4, 12 and 25 years.
Chapter VIII · Step 14 · 2015 → 2026
1.5 and 2 degrees
The Paris Agreement, adopted in December 2015 and in force since 4 November 2016, aims at “holding the increase in the global average temperature to well below 2 °C above pre-industrial levels and pursuing efforts to limit the temperature increase to 1.5 °C”. Because warming rises almost in a straight line with cumulative CO₂ emissions (about 0.45 °C per 1,000 billion tonnes, IPCC best estimate), each temperature limit corresponds to a remaining carbon budget.
Budget for 1.5 °C
170 Gt CO₂
~4 years at 2025 emissions
Budget for 1.7 °C
525 Gt CO₂
~12 years
Budget for 2 °C
1,055 Gt CO₂
~25 years
Cumulative 1850–2019
~2,390 Gt CO₂
IPCC AR6
Budgets are from the Global Carbon Budget 2025, counted from January 2026. The tank in the scene drains at about 42 billion tonnes a year (fossil plus land-use emissions in 2025). In March 2025 WMO stressed that a single year above 1.5 °C does not mean the Paris goals are out of reach. The GCB itself describes the 1.5 °C budget as “virtually exhausted”.
What the IPCC’s pathways to 1.5 and 2 degrees have in common.
In the IPCC’s pathways that limit warming to 1.5 or 2 degrees, emissions fall rapidly in every sector.
The options include low-carbon electricity such as renewables, using energy more efficiently, electrification, cutting methane, and removing some carbon dioxide from the air.
From 2010 to 2019, the cost of solar power fell by 85 percent, wind by 55 percent and lithium-ion batteries by 85 percent.
Every option faces challenges of cost, scale, land or technology, and countries weigh them differently. That is where science hands over to policy.
Chapter VIII · Step 15
Many routes, one direction
In the IPCC’s assessed pathways that limit warming to 1.5 °C (>50% chance) or 2 °C (>67%), global net CO₂ reaches zero in the early 2050s or around the early 2070s respectively. They combine a shift from unabated fossil fuels to very low- or zero-carbon energy (renewables, or fossil fuels with carbon capture), demand-side measures and efficiency, cuts in methane and other gases, and some carbon dioxide removal for emissions that are hard to eliminate. Without stronger policies than those in place at the end of 2020, the IPCC projected a median warming of 3.2 °C by 2100.
Unit cost fall, 2010–2019
Solar −85% · Wind −55% · Li-ion batteries −85%
IPCC WGIII
Fuel use in 2050 vs 2019
Coal −95% · Oil −60% · Gas −45%
median, 1.5 °C pathways
The IPCC notes that all strategies face implementation challenges: technology risks, scaling and costs, dependence on carbon removal, pressure on land and biodiversity (for example from bioenergy), and high upfront investment (for example nuclear). Which mix to choose, and how fast, is a question of policy and values, which this story does not try to answer.
From Fourier’s puzzle to today’s satellites, the physics has held: some gases let sunlight in and slow the escape of heat.
The air now holds about 50 percent more carbon dioxide than before the industrial age, and recent years have been about one and a half degrees warmer than the late 1800s.
How quickly emissions fall is a choice for societies to make. How the greenhouse effect works is not in doubt.
Epilogue · 1824 → 2026
A blanket we can measure
1824 Fourier: the atmosphere keeps Earth warmer
1856 Foote: CO₂ and water vapour heat up most in sunlight
1859 Tyndall measures infrared absorption by gases
1896 Arrhenius calculates warming from more CO₂
1958 Keeling starts the Mauna Loa record
2015 Paris Agreement: well below 2 °C, aim for 1.5 °C
2024 First calendar year likely above 1.5 °C
2026 COP31 in Antalya, 9–20 November
All full-screen stills are AI-generated to help the imagination; they are not photographs and show no real people or places. The globe uses NASA Blue Marble imagery. Charts use real data: NOAA GML Mauna Loa CO₂, the EPICA Dome C CO₂ composite and HadCRUT5. The temperature readouts on the globe come from a deliberately simple model and are labelled as such.